OPEN-SOURCE SCRIPT
Relative Strength vs Benchmark SPY

Relative Strength vs Benchmark (SPY)
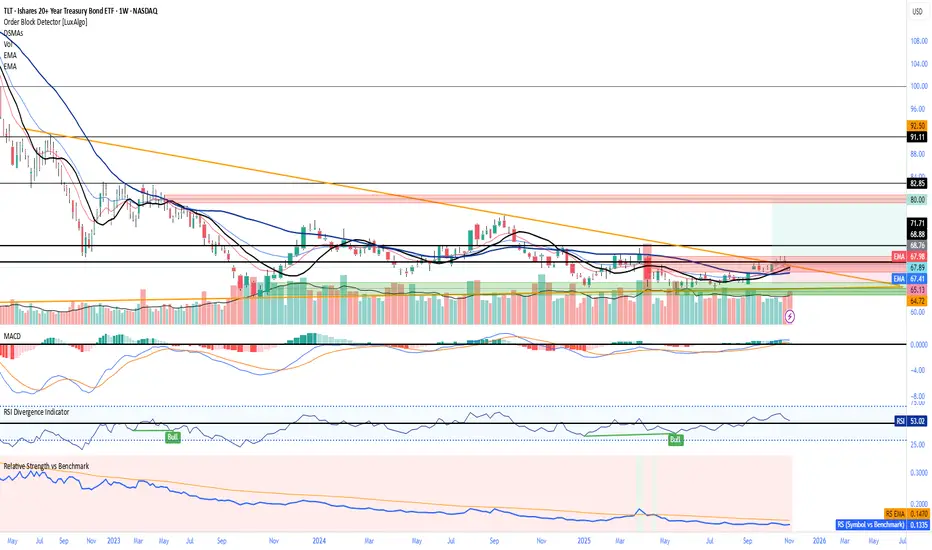
This indicator compares the performance of the charted symbol (stock or ETF) against a benchmark index — by default, SPY (S&P 500). It plots a Relative Strength (RS) ratio line (Symbol / SPY) and its EMA(50) to visualize when the asset is outperforming or underperforming the market.
Key Features
📈 RS Line (blue): Shows how the asset performs relative to SPY.
🟠 EMA(50): Smooths the RS trend to highlight sustained leadership.
🟩 Green background: Symbol is outperforming SPY (RS > EMA).
🟥 Red background: Symbol is underperforming SPY (RS < EMA).
🔔 Alerts: Automatic notifications when RS crosses above/below its EMA — signaling new leadership or weakness.
How to Use
Apply to any stock or ETF chart.
Keep benchmark = SPY, or switch to another index (e.g., QQQ, IWM, XLK).
Watch for RS crossovers and trends:
Rising RS → money flowing into the asset.
Falling RS → rotation away from the asset.
Perfect for sector rotation, ETF comparison, and momentum analysis workflows.
Script open-source
Dans l'esprit TradingView, le créateur de ce script l'a rendu open source afin que les traders puissent examiner et vérifier ses fonctionnalités. Bravo à l'auteur! Bien que vous puissiez l'utiliser gratuitement, n'oubliez pas que la republication du code est soumise à nos Règles.
Clause de non-responsabilité
Les informations et publications ne sont pas destinées à être, et ne constituent pas, des conseils ou recommandations financiers, d'investissement, de trading ou autres fournis ou approuvés par TradingView. Pour en savoir plus, consultez les Conditions d'utilisation.