OPEN-SOURCE SCRIPT
Mis à jour Swing Profile Analyzer [ChartPrime]

Swing Profile Analyzer [ChartPrime]
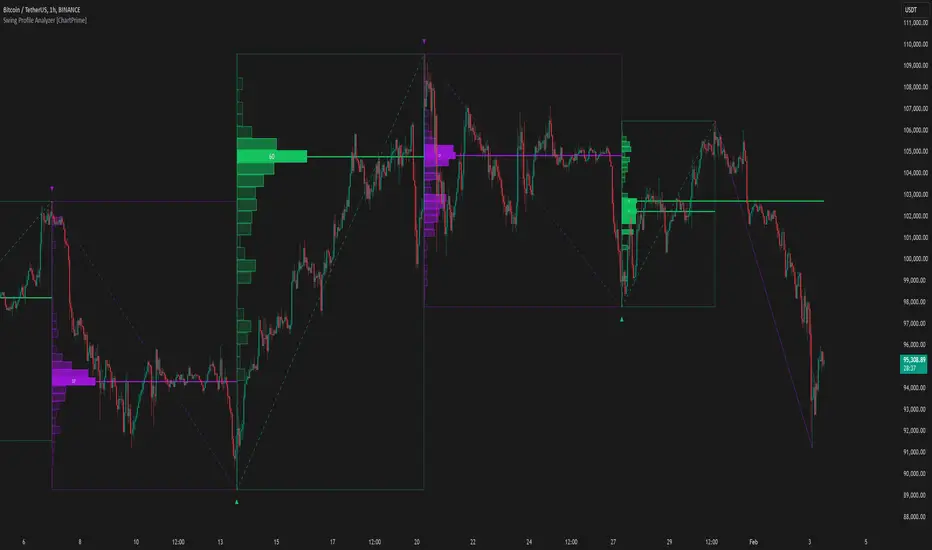
The Swing Profile Analyzer is a comprehensive tool designed to provide traders with valuable insights into swing frequency profiles, enabling them to identify key price levels and areas of market interest.
⯁ KEY FEATURES
⯁ HOW TO USE
⯁ CONCLUSION
The Swing Profile Analyzer is an essential tool for traders seeking to understand price dynamics within market swings. By combining frequency profiles, POC levels, and trend visualization, it enhances your ability to interpret and act on market movements effectively.
The Swing Profile Analyzer is a comprehensive tool designed to provide traders with valuable insights into swing frequency profiles, enabling them to identify key price levels and areas of market interest.
⯁ KEY FEATURES
- Swing Frequency Profiles
Automatically plots frequency profiles for each swing, highlighting price distribution and key levels of significance. - Point of Control (POC) Line
Marks the price level with the highest number of closes within a swing, acting as a key area for potential price reactions. - Customizable Trend Display
Allows users to toggle between displaying profiles for bullish swings, bearish swings, or both, offering tailored analysis. - Integrated ZigZag Lines
Visualizes swing highs and lows, providing a clear picture of market trends and reversals. - Dynamic Profile Visualization
Profiles are color-coded to indicate the frequency of closes, with the highest value bins distinctly marked for easy recognition. - Max Frequency Highlight
Displays numerical values for the most active price level within each profile, showing how many closes occurred at the peak bin. - Updates only after swing formed
Profiles and POC lines automatically appear after swing is done
⯁ HOW TO USE
- Identify Critical Price Levels
Use the POC line and frequency distribution to locate levels where price is likely to react or consolidate. - Analyze Swing Characteristics
Observe swing profiles to understand the strength, duration, and behavior of market trends. - Plan Entries and Exits
Leverage significant price levels and high-frequency bins to make more informed trading decisions. - Focus on Specific Trends
Filter profiles to analyze bullish or bearish swings based on your trading strategy.
⯁ CONCLUSION
The Swing Profile Analyzer is an essential tool for traders seeking to understand price dynamics within market swings. By combining frequency profiles, POC levels, and trend visualization, it enhances your ability to interpret and act on market movements effectively.
Notes de version
Updated ThumbnailScript open-source
Dans l'esprit TradingView, le créateur de ce script l'a rendu open source afin que les traders puissent examiner et vérifier ses fonctionnalités. Bravo à l'auteur! Bien que vous puissiez l'utiliser gratuitement, n'oubliez pas que la republication du code est soumise à nos Règles.
Clause de non-responsabilité
Les informations et publications ne sont pas destinées à être, et ne constituent pas, des conseils ou recommandations financiers, d'investissement, de trading ou autres fournis ou approuvés par TradingView. Pour en savoir plus, consultez les Conditions d'utilisation.
Script open-source
Dans l'esprit TradingView, le créateur de ce script l'a rendu open source afin que les traders puissent examiner et vérifier ses fonctionnalités. Bravo à l'auteur! Bien que vous puissiez l'utiliser gratuitement, n'oubliez pas que la republication du code est soumise à nos Règles.
Clause de non-responsabilité
Les informations et publications ne sont pas destinées à être, et ne constituent pas, des conseils ou recommandations financiers, d'investissement, de trading ou autres fournis ou approuvés par TradingView. Pour en savoir plus, consultez les Conditions d'utilisation.