PROTECTED SOURCE SCRIPT
TradeChartist MA Waterslide
™TradeChartist MA Waterslide is a beautiful visual indicator that uses an original method to plot a trend based waterslide on price action, based on one of the 15 types of moving averages of the source price. The Waterslide helps identify the trend and also helps spot key Support and Resistance levels visually from the confluence of Waterslide levels.
===================================================================================================================
Key features included in the settings
MA Waterslide - Displays Waterslide based on one of the 15 MA types - disabling this option removes the fill and shows just the Waterslide levels.
Waterslide MA Type - User can choose one of 15 different types of Moving Averages.
Waterslide MA Length - User can input the required MA length for the Waterslide.
Offset - Offset upto the value of 5 can be used to visually see the levels better by projecting them into the future by the Offset value.
Waterslide Width - Width of the Waterslide. Default width is 3 and Minimum is 1. It can be changed to suit the risk based support and resistance spotting.
Display MA - Displays the True MA Plot
===================================================================================================================
Example charts
1. BTC Multi Window showing different Themes and MA types.

2. GBPUSD 15m chart using 200 period Hull MA with Offset 5 and Width 5 along with True MA plot.

3. XAUUSD 1 hr chart using 200 period TEMA with Offset 5 and Width 5 of BaseLine (Kijun Sen) of Ichimoku Cloud as Price Source.

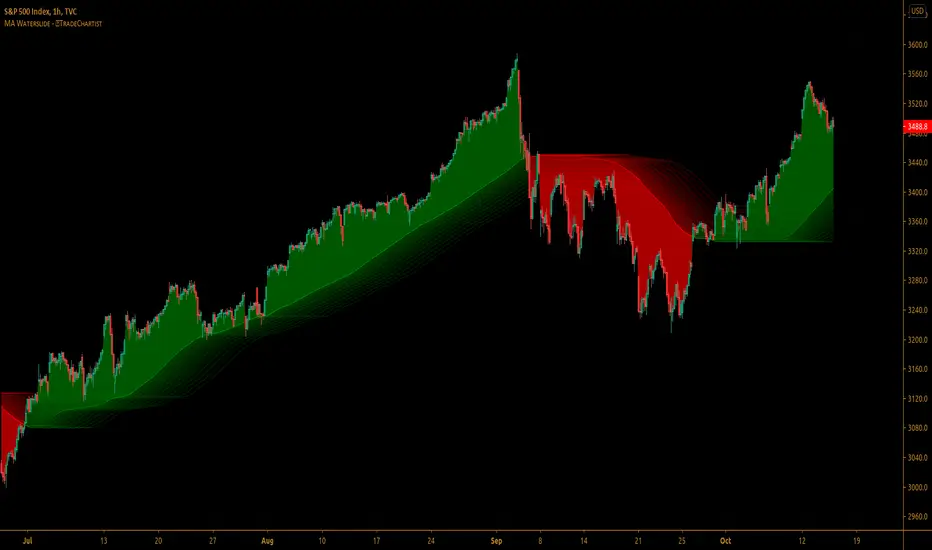
4. SPX 1 hr chart using 100 SMA and Width 5 with just the MA Waterslide Levels.

===================================================================================================================
===================================================================================================================
Key features included in the settings
MA Waterslide - Displays Waterslide based on one of the 15 MA types - disabling this option removes the fill and shows just the Waterslide levels.
Waterslide MA Type - User can choose one of 15 different types of Moving Averages.
Waterslide MA Length - User can input the required MA length for the Waterslide.
Offset - Offset upto the value of 5 can be used to visually see the levels better by projecting them into the future by the Offset value.
Waterslide Width - Width of the Waterslide. Default width is 3 and Minimum is 1. It can be changed to suit the risk based support and resistance spotting.
Display MA - Displays the True MA Plot
===================================================================================================================
Example charts
1. BTC Multi Window showing different Themes and MA types.
2. GBPUSD 15m chart using 200 period Hull MA with Offset 5 and Width 5 along with True MA plot.
3. XAUUSD 1 hr chart using 200 period TEMA with Offset 5 and Width 5 of BaseLine (Kijun Sen) of Ichimoku Cloud as Price Source.
4. SPX 1 hr chart using 100 SMA and Width 5 with just the MA Waterslide Levels.
===================================================================================================================
Script protégé
Ce script est publié en source fermée. Cependant, vous pouvez l'utiliser librement et sans aucune restriction – pour en savoir plus, cliquez ici.
Get in touch with me if you would like access to my Premium scripts for a trial before deciding on lifetime access.
Telegram - @Trade_Chartist
Free Scripts - bit.ly/Free-Scripts
Telegram - @Trade_Chartist
Free Scripts - bit.ly/Free-Scripts
Clause de non-responsabilité
Les informations et publications ne sont pas destinées à être, et ne constituent pas, des conseils ou recommandations financiers, d'investissement, de trading ou autres fournis ou approuvés par TradingView. Pour en savoir plus, consultez les Conditions d'utilisation.