AlphaTrend - Medium Term Trend Probability Indicator on TOTALES
AlphaTrend is a consensus-based trend identification system that combines 7 independent trend detection methodologies into a single probability score. Designed for medium-term trading (days to weeks), it aggregates diverse analytical approaches—from volatility-adjusted moving averages to statistical oscillators—to determine directional bias with quantifiable confidence.
Unlike single-indicator systems prone to false signals during consolidation, AlphaTrend requires majority agreement across multiple uncorrelated methods before generating directional signals, significantly reducing whipsaws in choppy markets.
METHODOLOGY - THE 7-INDICATOR VOTING SYSTEM
Each indicator analyzes trend from a mathematically distinct perspective and casts a vote: +1 (bullish), -1 (bearish), or 0 (neutral). The average of all 7 votes creates the final probability score ranging from -1 (strong bearish) to +1 (strong bullish).
1. FLXWRT RMA (VOLATILITY-ADJUSTED BASELINE)
Method: RMA (Running Moving Average) with ATR-based dynamic bands
Calculation:
RMA = Running MA of price over 12 periods
ATR = Average True Range over 20 periods
Long Signal: Price > RMA + ATR
Short Signal: Price < RMA - ATR
Logic: Trend confirmed only when price breaks beyond volatility-adjusted boundaries, not just the moving average itself. This filters noise by requiring momentum sufficient to overcome recent volatility.
Why it works: Standard MA crossovers generate excessive false signals in ranging markets. Adding ATR bands ensures price has genuine directional momentum, not just minor fluctuations.
Settings:
RMA Length (12): Base trend smoothing
ATR Length (20): Volatility measurement period
2. BOOSTED MOVING AVERAGE (MOMENTUM-ENHANCED TREND)
Method: Double EMA with acceleration boost factor
Calculation:
EMA1 = EMA(close, length)
EMA2 = EMA(close, length/2) // Faster EMA
Boosted Value = EMA2 + sensitivity × (EMA2 - EMA1)
Final = EMA smoothing of Boosted Value
Logic: Amplifies the difference between fast and slow EMAs to emphasize trend momentum. The boost factor (1.3) accelerates response to directional moves while subsequent smoothing prevents over-reaction.
Why it works: Traditional MAs lag price action. The boost mechanism projects trend direction forward by amplifying the momentum differential between two EMAs, providing earlier signals without sacrificing reliability.
Settings:
Length (36): Base EMA period
Boost Factor (1.3): Momentum amplification multiplier
Originality: This is a proprietary enhancement to standard double EMA systems. Most indicators simply cross fast/slow EMAs; this one mathematically projects momentum trajectory.
3. HEIKIN ASHI TREND (T3-SMOOTHED CANDLES)
Method: Heikin Ashi candles with T3 exponential smoothing
Calculation:
Heikin Ashi candles = Smoothed OHLC transformation
T3 Smoothing = Triple-exponential smoothing (Tillson T3)
Signal: T3(HA_Open) crosses T3(HA_Close)
Logic: Heikin Ashi candles filter intrabar noise by averaging consecutive bars. T3 smoothing adds additional filtering using Tillson's generalized DEMA algorithm with custom volume factor.
Why it works: Regular candlesticks contain high-frequency noise. Heikin Ashi transformation creates smoother trends, and T3 smoothing eliminates remaining whipsaws while maintaining responsiveness. The T3 algorithm specifically addresses the lag-vs-smoothness tradeoff.
Settings:
T3 Length (13): Smoothing period
T3 Factor (0.3): Volume factor for T3 algorithm
Percent Squeeze (0.2): Sensitivity adjustment
Technical Note: T3 is superior to simple EMA smoothing because it applies the generalized DEMA formula recursively, reducing lag while maintaining smooth output.
4. VIISTOP (ATR-BASED TREND FILTER)
Method: Simple trend detection using price position vs smoothed baseline with ATR confirmation
Calculation:
Baseline = SMA(close, 16)
ATR = ATR(16)
Uptrend: Close > Baseline
Downtrend: Close < Baseline
Logic: The simplest component—pure price position relative to medium-term average. While basic, it provides a "sanity check" against over-optimized indicators.
Why it works: Sometimes the simplest approach is most robust. In strong trends, price consistently stays above/below its moving average. This indicator prevents the system from over-complicating obvious directional moves.
Settings:
Length (16): Baseline period
Multiplier (2.8): ATR scaling (not actively used in vote logic)
Purpose in Ensemble: Provides grounding in basic trend logic. Complex indicators can sometimes generate counterintuitive signals; ViiStop ensures the system stays aligned with fundamental price positioning.
5. NORMALIZED KAMA OSCILLATOR (ADAPTIVE EFFICIENCY-BASED TREND)
Method: Kaufman Adaptive Moving Average normalized to oscillator format
Calculation:
Efficiency Ratio = |Close - Close[8]| / Sum(|Close - Close[1]|, 8)
Smoothing Constant = ER × (Fast SC - Slow SC) + Slow SC
KAMA = Adaptive moving average using dynamic smoothing
Normalized = (KAMA - Lowest) / (Highest - Lowest) - 0.5
Logic: KAMA adjusts its smoothing speed based on market efficiency. In trending markets (high efficiency), it speeds up. In ranging markets (low efficiency), it slows down. Normalization converts absolute values to -0.5/+0.5 oscillator for consistent voting.
Why it works: Fixed-period moving averages perform poorly across varying market conditions. KAMA's adaptive nature makes it effective in both trending and choppy environments by automatically adjusting its responsiveness.
Settings:
Fast Period (9): Maximum responsiveness
Slow Period (21): Minimum responsiveness
ER Period (8): Efficiency calculation window
Normalization Lookback (35): Oscillator scaling period
Mathematical Significance: Kaufman's algorithm is one of the most sophisticated adaptive smoothing methods in technical analysis. The Efficiency Ratio mathematically quantifies trend strength vs noise.
6. LÉVY FLIGHT RSI (HEAVY-TAILED MOMENTUM)
Method: Modified RSI using Lévy distribution weighting for gains/losses
Calculation:
Weighted Gain = (Max(Price Change, 0))^Alpha
Weighted Loss = (-Min(Price Change, 0))^Alpha
RSI = 100 - (100 / (1 + RMA(Gain) / RMA(Loss)))
Centered RSI = RSI - 50
Logic: Standard RSI treats all price changes linearly. Lévy Flight RSI applies power-law weighting (Alpha = 1.5) to emphasize larger moves, modeling heavy-tailed distributions observed in real market data.
Why it works: Market returns exhibit "fat tails"—large moves occur more frequently than normal distribution predicts. Lévy distributions (Alpha between 1-2) better model this behavior. By weighting larger price changes more heavily, this RSI variant becomes more sensitive to genuine momentum shifts while filtering small noise.
Settings:
RSI Length (14): Standard period
Alpha (1.5): Lévy exponent (1=linear, 2=quadratic)
MA Length (12): Final smoothing
Originality: Standard RSI uses unweighted gains/losses. This implementation applies stochastic process theory (Lévy flights) from quantitative finance to create a momentum indicator more aligned with actual market behavior.
Mathematical Background: Lévy flights describe random walks with heavy-tailed step distributions, observed in financial markets, animal foraging patterns, and human mobility. Alpha=1.5 balances between normal distribution (Alpha=2) and Cauchy distribution (Alpha=1).
7. REGULARIZED-MA OSCILLATOR (Z-SCORED TREND DEVIATION)
Method: Moving average converted to z-score oscillator
Calculation:
MA = EMA(close, 19)
Mean = SMA(MA, 30)
Std Dev = Standard Deviation(MA, 30)
Z-Score = (MA - Mean) / Std Dev
Logic: Converts absolute MA values to statistical standard deviations from mean. Positive z-score = MA above its typical range (bullish), negative = below range (bearish).
Why it works: Raw moving averages don't indicate strength—a 50-day MA at $50k vs $60k has no contextual meaning. Z-scoring normalizes this to "how unusual is current MA level?" This makes signals comparable across different price levels and time periods.
Settings:
Length (19): Base MA period
Regularization Length (30): Statistical normalization window
Statistical Significance: Z-scores are standard in quantitative analysis. This indicator asks: "Is the current trend statistically significant or just random noise?"
AGGREGATION METHODOLOGY
Voting System:
Each indicator returns: +1 (bullish), -1 (bearish), or 0 (neutral)
Total Score = Sum of all 7 votes (-7 to +7)
Average Score = Total / 7 (-1.00 to +1.00)
Signal Generation:
Long Signal: Average > 0 (majority bullish)
Short Signal: Average < 0 (majority bearish)
Neutral: Average = 0 (perfect split or all neutral)
Why Equal Weighting:
Each indicator represents a fundamentally different analytical approach:
Volatility-adjusted (RMA, ViiStop)
Momentum-based (Boosted MA, Lévy RSI)
Adaptive smoothing (KAMA)
Statistical (MA Oscillator)
Noise-filtered (Heikin Ashi T3)
Equal weighting ensures no single methodology dominates. This diversification reduces bias and improves robustness across market conditions.
ORIGINALITY - WHY THIS COMBINATION WORKS
Traditional Multi-Indicator Approaches:
Combine similar indicators (multiple MAs, multiple oscillators)
Use arbitrary thresholds for each indicator
Don't normalize signals (hard to compare RSI to MACD)
Often just "if RSI > 70 AND MACD > 0 = buy"
AlphaTrend MTPI Innovations:
Methodological Diversity: Includes volatility-adaptive (RMA), momentum-enhanced (Boosted MA), efficiency-based (KAMA), heavy-tailed statistics (Lévy RSI), and smoothed candles (HA). No redundant indicators.
Binary Voting: Each indicator reduces to simple +1/-1/0 vote, making aggregation transparent and preventing any indicator from overwhelming the consensus.
Medium-Term Optimization: Parameter choices (12-36 period averages) specifically target multi-day to multi-week trends, not scalping or long-term positioning.
Advanced Mathematics: Incorporates Tillson T3, Kaufman Efficiency Ratio, Lévy distributions, and statistical z-scoring—not just basic MAs and RSIs.
No Overfit Risk: With 7 diverse components voting equally, the system can't overfit to any specific market regime. If trending markets favor KAMA, but choppy markets favor Boosted MA, the ensemble stays robust.
Why 7 Indicators, Not 3 or 10:
Fewer than 5: Insufficient diversification, single indicator failures impact results heavily
More than 9: Diminishing returns, redundancy increases, computational load grows
7 provides: Odd number (no ties), sufficient diversity, manageable complexity
VISUAL COMPONENTS
1. Bar Coloring:
Cyan bars: Bullish consensus (average score > 0)
Magenta bars: Bearish consensus (average score < 0)
No color: Neutral (score = 0 or date filter disabled)
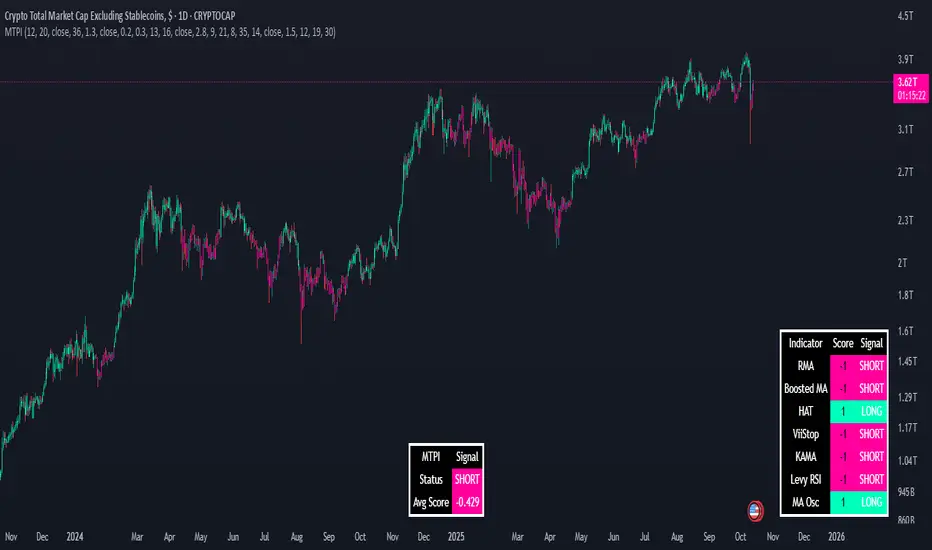
2. MTPI Summary Table (Bottom Center):
MTPI Signal: Current directional bias (LONG/SHORT/NEUTRAL)
Average Score: Precise consensus reading (-1.00 to +1.00)
3. Indicator Status Table (Bottom Right):
Shows all 7 individual indicator scores
Score column: +1 (bullish), -1 (bearish), 0 (neutral)
Signal column: Text interpretation of each vote
Color-coded cells: Cyan (long), Magenta (short), Gray (neutral)
HOW TO USE
For Swing Trading (Recommended - Days to Weeks):
Entry Signals:
Strong Long: 5+ indicators bullish (score ≥ 0.71)
Standard Long: 4+ indicators bullish (score ≥ 0.57)
Weak Long: Simple majority (score > 0) — use with caution
Exit Signals:
Hard Stop: Score flips negative (consensus reverses)
Partial Take Profit: Score drops to +0.30 or below (weakening)
Trailing Stop: Use ATR-based stop below entry
Position Sizing:
Strong signals (|score| > 0.7): Full position
Moderate signals (0.4-0.7): 50-75% position
Weak signals (< 0.4): 25-50% or skip
For Trend Confirmation:
Use alongside your primary strategy for confluence
Only take trades when AlphaTrend agrees with your analysis
Avoid counter-trend trades when score is extreme (|score| > 0.7)
Best Timeframes:
4H: Primary timeframe for swing trading
1D: Position trading and major trend identification
1H: Active trading (shorter hold periods)
< 1H: Not recommended (designed for medium-term)
Market Conditions:
Trending markets: System excels (consensus emerges quickly)
Ranging markets: Expect mixed signals (score oscillates near zero)
High volatility: RMA and ViiStop provide stabilization
Low volatility: KAMA and Boosted MA maintain responsiveness
SETTINGS EXPLAINED
General Settings:
Use Date Filter: Enable/disable historical backtesting range
Start Date: When to begin signal generation (default: Jan 1, 2018)
Flxwrt RMA Settings:
RMA Length (12): Base trend smoothing
ATR Length (20): Volatility measurement period
Source: Price input (default: close)
Boosted MA Settings:
Length (36): Base EMA period
Boost Factor (1.3): Momentum amplification
Source: Price input
Heikin Ashi Settings:
Percent Squeeze (0.2): Sensitivity adjustment
T3 Factor (0.3): Tillson volume factor
T3 Length (13): Smoothing period
ViiStop Settings:
Length (16): Baseline period
Multiplier (2.8): ATR scaling
Source: Price input
KAMA Settings:
Fast Period (9): Maximum responsiveness
Slow Period (21): Minimum responsiveness
ER Period (8): Efficiency calculation
Normalization Lookback (35): Oscillator scaling
Levy RSI Settings:
RSI Length (14): Standard period
Alpha (1.5): Lévy exponent (power-law weighting)
MA Length (12): Final smoothing
Source: Price input
MA Oscillator Settings:
Length (19): Base MA period
Regularize Length (30): Z-score normalization window
PERFORMANCE CHARACTERISTICS
Strengths:
✅ Reduced whipsaws vs single indicators
✅ Works across varying market conditions (adaptive components)
✅ Transparent methodology (see every vote)
✅ Customizable to trading style via timeframe selection
✅ No curve-fitting (equal weighting, no optimization)
Limitations:
⚠️ Medium-term focus (not for scalping or very long-term)
⚠️ Lagging by design (consensus requires confirmation)
⚠️ Less effective in violent reversals (momentum carries votes)
⚠️ Requires clean price data (gaps/thin volume can distort)
ALERTS & AUTOMATION
No built-in alerts in current version (visual-only indicator). Users can create custom alerts based on:
Bar color changes (cyan to magenta or vice versa)
Average score crossing above/below thresholds
Specific indicator status changes in the table
BEST PRACTICES
Risk Management:
Never risk more than 1-2% per trade regardless of score
Use stop losses (ATR-based recommended)
Scale positions based on signal strength
Don't average down on losing positions
Combining with Other Analysis:
✅ Support/Resistance levels for entries
✅ Volume confirmation (accumulation/distribution)
✅ Market structure (higher highs/lower lows)
✅ Volatility regimes (adjust position size)
❌ Don't combine with redundant trend indicators (adds no value)
❌ Don't override strong consensus with gut feeling
❌ Don't use on news-driven spikes (wait for stabilization)
Backtesting Notes:
Use "Date Filter" to test specific periods
Forward-test before live deployment
Remember: consensus systems perform best in trending markets, expect reduced edge in ranges
IMPORTANT NOTES
Not a standalone strategy - Use with proper risk management
Requires clean data - Works best on liquid markets with tight spreads
Medium-term by design - Don't expect scalping signals
No magic - No indicator predicts the future; this shows current trend probability
Diversification within - The 7-component ensemble IS the diversification strategy
Not financial advice. This indicator identifies medium-term trend probability based on multi-component consensus. Past performance does not guarantee future results. Always use proper risk management and position sizing.
Script sur invitation seulement
Seuls les utilisateurs approuvés par l'auteur peuvent accéder à ce script. Vous devrez demander et obtenir l'autorisation pour l'utiliser. Celle-ci est généralement accordée après paiement. Pour plus de détails, suivez les instructions de l'auteur ci-dessous ou contactez directement AlphaEdge_.
TradingView ne recommande PAS de payer ou d'utiliser un script à moins que vous ne fassiez entièrement confiance à son auteur et que vous compreniez comment il fonctionne. Vous pouvez également trouver des alternatives gratuites et open-source dans nos scripts communautaires.
Instructions de l'auteur
Clause de non-responsabilité
Script sur invitation seulement
Seuls les utilisateurs approuvés par l'auteur peuvent accéder à ce script. Vous devrez demander et obtenir l'autorisation pour l'utiliser. Celle-ci est généralement accordée après paiement. Pour plus de détails, suivez les instructions de l'auteur ci-dessous ou contactez directement AlphaEdge_.
TradingView ne recommande PAS de payer ou d'utiliser un script à moins que vous ne fassiez entièrement confiance à son auteur et que vous compreniez comment il fonctionne. Vous pouvez également trouver des alternatives gratuites et open-source dans nos scripts communautaires.