OPEN-SOURCE SCRIPT
Mis à jour Exponential Regression Slope Annualized with R-squared Histogram
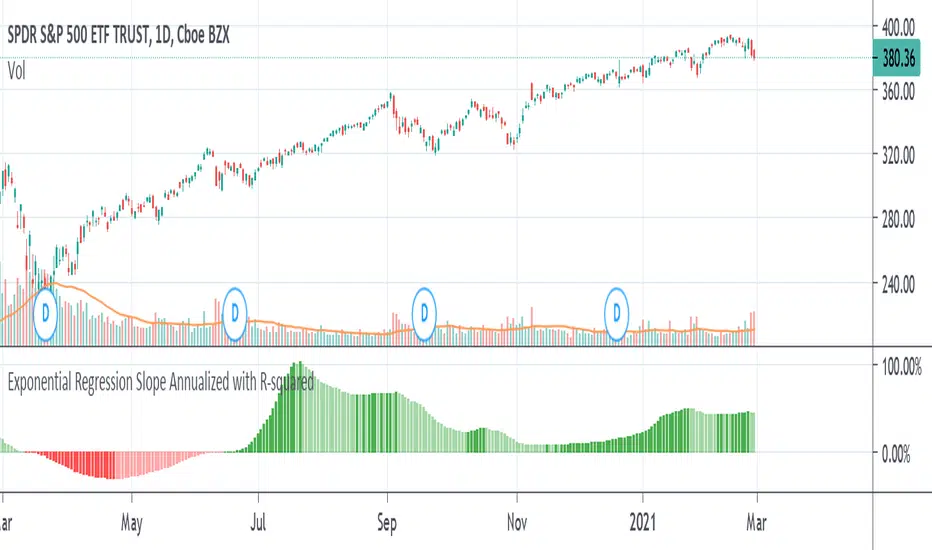
My other indicator shows the linear regression slope of the source. This one finds the exponential regression slope and optionally multiplies it by R-squared and optionally annualizes it. Multiplying by R-squared makes sure that the price movement was significant in order to avoid volatile movements that can throw off the slope value. Annualizing the exponential slope will let you see how much percentage you will make in a year if the price continues at its current pace.
The annualized number is the number of trading days in a year. This and the length might need adjusting for the extra bars that might be in futures or other markets. The number does not have to be a year. For example, it can be a month if you set the number to 20 or so trading days to find how much you would make in a month if price continues at its current pace, etc. This can also be used as an alternative to relative strength or rate of change.
The annualized number is the number of trading days in a year. This and the length might need adjusting for the extra bars that might be in futures or other markets. The number does not have to be a year. For example, it can be a month if you set the number to 20 or so trading days to find how much you would make in a month if price continues at its current pace, etc. This can also be used as an alternative to relative strength or rate of change.
Notes de version
Changed the default year from 250 to 252, not a big difference.Changed the value to show percentage.
This indicator is like rate of change but lags in order to give less weight to the outliers or the prices that don't fit the exponential regression line.
Script open-source
Dans l'esprit TradingView, le créateur de ce script l'a rendu open source afin que les traders puissent examiner et vérifier ses fonctionnalités. Bravo à l'auteur! Bien que vous puissiez l'utiliser gratuitement, n'oubliez pas que la republication du code est soumise à nos Règles.
Clause de non-responsabilité
Les informations et publications ne sont pas destinées à être, et ne constituent pas, des conseils ou recommandations financiers, d'investissement, de trading ou autres fournis ou approuvés par TradingView. Pour en savoir plus, consultez les Conditions d'utilisation.