OPEN-SOURCE SCRIPT
Mis à jour SMA(20,50,200)
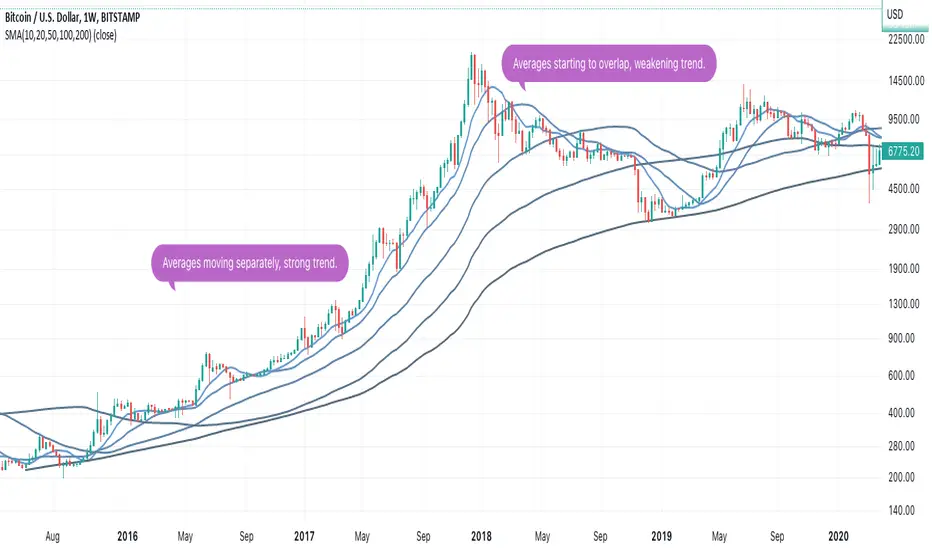
Simple Moving Average over 20, 50 and 200 close prices.
Notes de version
Simple Moving Average IndicatorDraws simple moving average prices as a line chart for three different time frames.
1) The last 21 bars (close price)
2) The last 50 bars (close price)
3) The last 200 bars (close price)
One of the most common and efficient trend analysis.
Notes de version
Simple Moving Average IndicatorDraws simple moving average prices as a line chart for three different time frames.
1) The last 21 bars (close price)
2) The last 50 bars (close price)
3) The last 200 bars (close price)
One of the most common and efficient trend analysis.
Notes de version
Add another SMA(100) to the script. Reduce default transparency to 50%. Can be overridden in the settings.Notes de version
Multiple moving averages (SMA Ribbon). Updated colors and added one more MA.Notes de version
Updated colors.Notes de version
Remove the 10 SMA.Notes de version
Update colorsNotes de version
Update docs and colors.Notes de version
Minor bug fixes.Script open-source
Dans l'esprit TradingView, le créateur de ce script l'a rendu open source afin que les traders puissent examiner et vérifier ses fonctionnalités. Bravo à l'auteur! Bien que vous puissiez l'utiliser gratuitement, n'oubliez pas que la republication du code est soumise à nos Règles.
Clause de non-responsabilité
Les informations et publications ne sont pas destinées à être, et ne constituent pas, des conseils ou recommandations financiers, d'investissement, de trading ou autres fournis ou approuvés par TradingView. Pour en savoir plus, consultez les Conditions d'utilisation.
Script open-source
Dans l'esprit TradingView, le créateur de ce script l'a rendu open source afin que les traders puissent examiner et vérifier ses fonctionnalités. Bravo à l'auteur! Bien que vous puissiez l'utiliser gratuitement, n'oubliez pas que la republication du code est soumise à nos Règles.
Clause de non-responsabilité
Les informations et publications ne sont pas destinées à être, et ne constituent pas, des conseils ou recommandations financiers, d'investissement, de trading ou autres fournis ou approuvés par TradingView. Pour en savoir plus, consultez les Conditions d'utilisation.