Trend Pullback Reversal TPR
TPR works on all timeframes and all symbols and all type of bar chart.
TPR never repaints.
There are 4 Parameters:
Period: umber of bars used for calculations
Factor: Multiplier factor, small number for short trend, large number for long trend
Source: the input series, default is Close
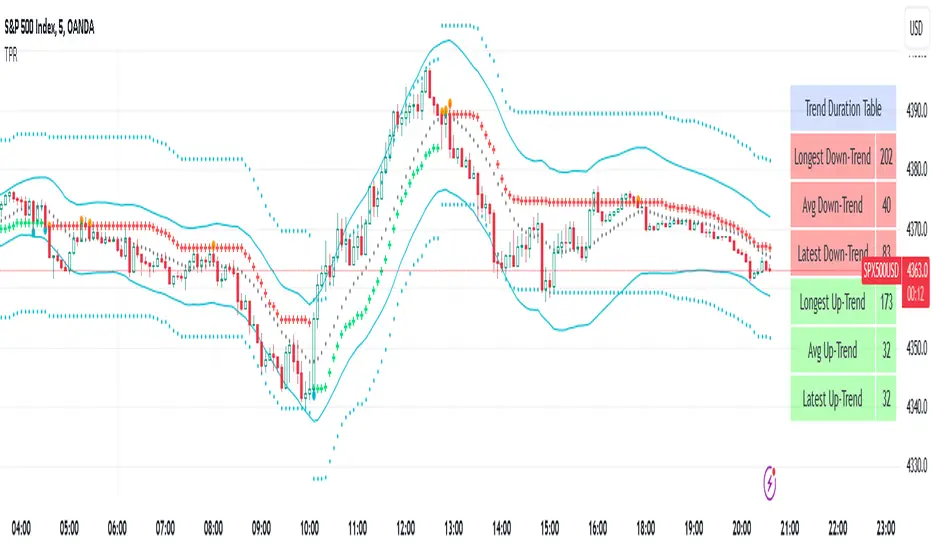
ShowBand: enable to show band and center line
Most trend indicators have similar plot, the difference is where and when they change the direction. Unlike other trend indicators, TPR will focus on main trend and filter out most minor price movements. The green cross-line represents an uptrend, the red cross-line represents a downtrend.
The additional band and center line may look like bollinger band, but the TPR band algorithm is completely different from bollingerband. There is no standard deviation in TPR band calculation.
It can be used as trailing stop for intraday chart.
It has the following six info:
- Longest Up-Trend
- Avg Up-Trend
- Latest Up-Trend
- Longest Down-Trend
- Avg Down-Trend
- Latest Down-Trend
Script sur invitation seulement
Seuls les utilisateurs approuvés par l'auteur peuvent accéder à ce script. Vous devrez demander et obtenir l'autorisation pour l'utiliser. Celle-ci est généralement accordée après paiement. Pour plus de détails, suivez les instructions de l'auteur ci-dessous ou contactez directement Patternsmart.
TradingView ne recommande PAS d'acheter ou d'utiliser un script à moins que vous ne fassiez entièrement confiance à son auteur et que vous compreniez son fonctionnement. Vous pouvez également trouver des alternatives gratuites et open source dans nos scripts communautaires.
Instructions de l'auteur
Clause de non-responsabilité
Script sur invitation seulement
Seuls les utilisateurs approuvés par l'auteur peuvent accéder à ce script. Vous devrez demander et obtenir l'autorisation pour l'utiliser. Celle-ci est généralement accordée après paiement. Pour plus de détails, suivez les instructions de l'auteur ci-dessous ou contactez directement Patternsmart.
TradingView ne recommande PAS d'acheter ou d'utiliser un script à moins que vous ne fassiez entièrement confiance à son auteur et que vous compreniez son fonctionnement. Vous pouvez également trouver des alternatives gratuites et open source dans nos scripts communautaires.