PROTECTED SOURCE SCRIPT
Simply Trendy RasterChart

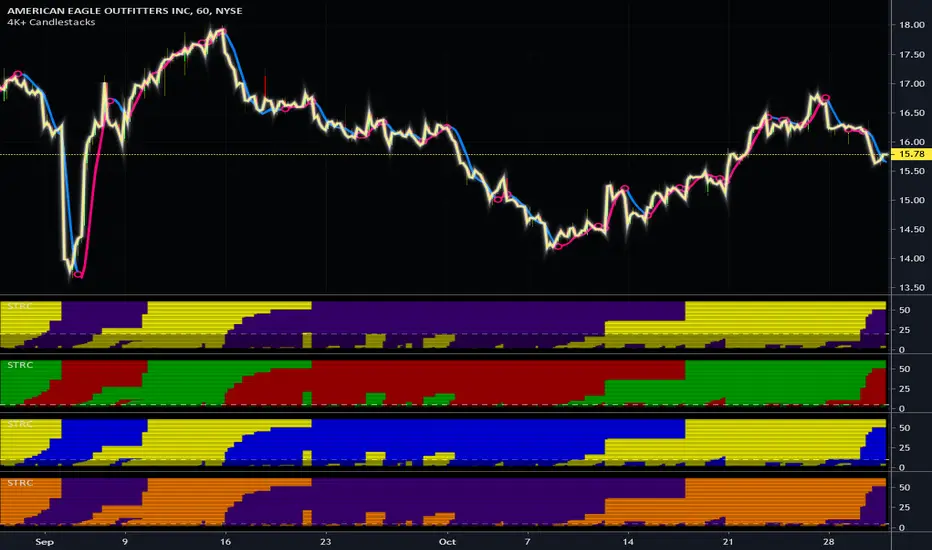
This is my "Simply Trendy RasterChart" using PSv4.0 freely available to ALL! Simply Trendy, shown with the multiple color schemes on the bottom portion of the chart, is an indicator that differentiates with color between trending moments up and down, but is also effective at identifying trend reversals clearly. The bottom of the indicator is most reactive and indicates reversals, while the upper portion of the indicator commonly shows enduring trends. I included a horizontal rule to approximately gauge at what level you may wish to have before entering/exiting a trade upon identifying a trend change. This gizmo functions on all assets on time frames ranging from one second bars up to the "All" chart having monthly bars. Possible uses are quickly identifying assets that are not only opportunistic towards buying, but also selling/shorting when that time arrives later.
I decided to release this freely so members can become familiar with how my RasterCharts function. However, it may serve as another tool in the trend analysis tool belt you may want to have. It's the most basic of RasterCharts that I may have, and it gives the user an opportunity to witness/grasp RasterChart fundamental theory and operation in real time. Underneath the hood, the code is truly VERY SIMPLE also, hence the entitled name given. This was originally an experiment that turned out to be impressive, exceeding my expectations of attempting it. It's behavior is similarly close to my "TrendSetter RasterChart" and may serve as a trainer before acquiring that, any other RasterCharts I have currently, or shall create in the future. With that said, I hope you find this "simply" handy , and I'm also wishful for it to potentially garner a "trendy" reputation among the many members who may discover it.
I provided multiple color schemes for those of you who may have color blindness vision impairments. You may contact me in private if these color schemes are not suitable for your diagnosed visual impairment, and you would wish to contribute to seeing the color schemes improved along with other future indicators I shall release.
Features List Includes:
"Color Scheme" selection (all displayed above)
"RasterChart Transparency" control
"Source" selection
"Horizontal Rule" adjustment
The comments section below is solely just for commenting and other remarks, ideas, compliments, etc... regarding only this indicator, not others. When available time provides itself, I will consider your inquiries, thoughts, and concepts presented below in the comments section if you do have any questions or comments regarding this indicator. When my indicators achieve more prevalent use by TV members, I may implement more ideas when they present themselves as worthy additions. As always, "Like" it if you simply just like it with a proper thumbs up, and also return to my scripts list occasionally for additional postings. Have a profitable future everyone!
Script protégé
Ce script est publié en source fermée. Cependant, vous pouvez l'utiliser librement et sans aucune restriction – pour en savoir plus, cliquez ici.
Clause de non-responsabilité
Les informations et publications ne sont pas destinées à être, et ne constituent pas, des conseils ou recommandations financiers, d'investissement, de trading ou autres fournis ou approuvés par TradingView. Pour en savoir plus, consultez les Conditions d'utilisation.