PROTECTED SOURCE SCRIPT
Saracino Bitcoin Relative Momentum Index

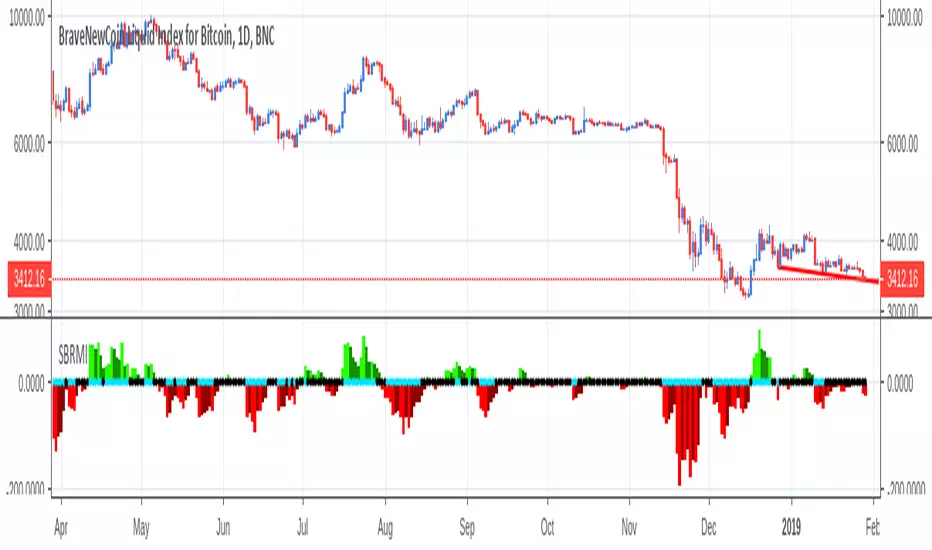
This is a technical indicator developed by Andrea Saracino. It gives buy and sell signals and works best on the daily charts.
This indicator is better suited for Bitcoin. In fact, throughout the history, it gave very consistent buy and sell signals on this asset. Could also be used in other cryptocurrencies.
It consists of two components: the histogram and the dots.
HISTOGRAM
The histogram shows the actual momentum of a given price trend and can be used to check if the trend is strong or if it's getting weaker overtime. When the momentum is to the upside it is green, while it is red if the momentum is to the downside.
DOTS
This is the actual signal part. It consists of a series of dots that become blue if there is a clear signal in either way.
For example: if the momentum is going up and the dots become blue it is a buy signal, or a sell signal if momentum goes down.
DISCLAIMER
This is NOT the Saint Grail indicator. You must not open any trade using just this indicator. Create a strategy instead.
Script protégé
Ce script est publié en source fermée. Cependant, vous pouvez l'utiliser librement et sans aucune restriction – pour en savoir plus, cliquez ici.
Clause de non-responsabilité
Les informations et publications ne sont pas destinées à être, et ne constituent pas, des conseils ou recommandations financiers, d'investissement, de trading ou autres fournis ou approuvés par TradingView. Pour en savoir plus, consultez les Conditions d'utilisation.