PROTECTED SOURCE SCRIPT
Mis à jour The Curve by Atilla Yurtseven

The Curve by Atilla Yurtseven
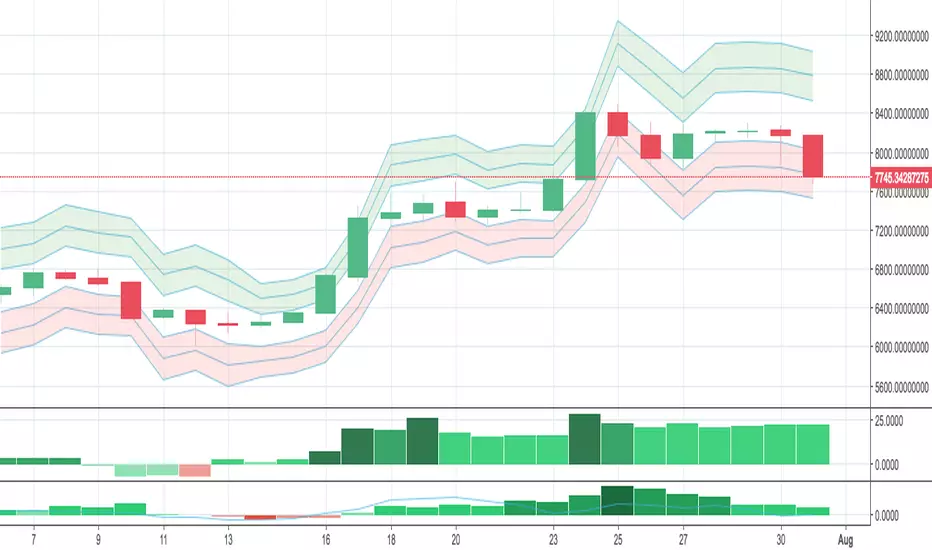
This indicator uses real empirical rule (68 - 95 - 99.7 rule). This is not a Bollinger Band indicator. I know BB is a very good indicator however it's unreliable.
First of all, I believe that price is not in a normal distribution. When you plot the histogram, you can not see a nice bell curved shape. It's know that bollinger bands simply uses a simple moving average and add standard deviation of closing price over it. TheCruve in the other hand, converts price to the nice bell shaped normal distribution and it never repaints. If it does, so there is a bug :)
The Curve indicator does not repaint. It's just there at the opening of the new bar! You can use The Curve with any time frame you like and any securities/pairs. Even for stocks. Longer look back periods, give better results.
Inputs:
Look Back Period: This is for calculating probability. Longer periods give better results.
Use Trend: When you enable Trend option, all lines will be calculated based on a Linear Regression trend
What do lines / ranges mean?
1st lines range is 68%. There is 68% probability that bar will close in this range.
2nd lines range is 95%. There is 95% probability that bar will close in this range.
3rd lines range is 99.7%: There is 99.7% probability that bar will close in this range.
FYI: This is an indicator that I have developed for myself. You can use it, apply or not to apply it to your trades. Keep in mind that, you are responsible for all your loses (or wins). Risk is 100% yours. Please use / try "The Curve" only if you accept this condition.
Have fun :)
Atilla Yurtseven
Notes de version
Note that this is not a new version. There was a bug calculating the trend. Also, the Price is not needed for "The Curve" method. I calculate and forecast the range using statistical methods. That's why i have removed the "Use Trend" option.Hope you enjoy!
Bests,
Atilla Yurtseven
Notes de version
Note that this is not a new version. There was a bug calculating the trend. Also, the Price is not needed for "The Curve" method. I calculate and forecast the range using statistical methods. That's why i have removed the "Use Trend" option. Hope you enjoy!
Bests,
Atilla Yurtseven
Notes de version
Updated using a clean chart!Script protégé
Ce script est publié en source fermée. Cependant, vous pouvez l'utiliser librement et sans aucune restriction – pour en savoir plus, cliquez ici.
I know Kung-Fu!
Clause de non-responsabilité
Les informations et publications ne sont pas destinées à être, et ne constituent pas, des conseils ou recommandations financiers, d'investissement, de trading ou autres fournis ou approuvés par TradingView. Pour en savoir plus, consultez les Conditions d'utilisation.
Script protégé
Ce script est publié en source fermée. Cependant, vous pouvez l'utiliser librement et sans aucune restriction – pour en savoir plus, cliquez ici.
I know Kung-Fu!
Clause de non-responsabilité
Les informations et publications ne sont pas destinées à être, et ne constituent pas, des conseils ou recommandations financiers, d'investissement, de trading ou autres fournis ou approuvés par TradingView. Pour en savoir plus, consultez les Conditions d'utilisation.