OPEN-SOURCE SCRIPT
Mis à jour Volume Profile With Buy & Sell Pressure Label

VOLUME PROFILE WITH BUY AND SELL PRESSURE LABEL
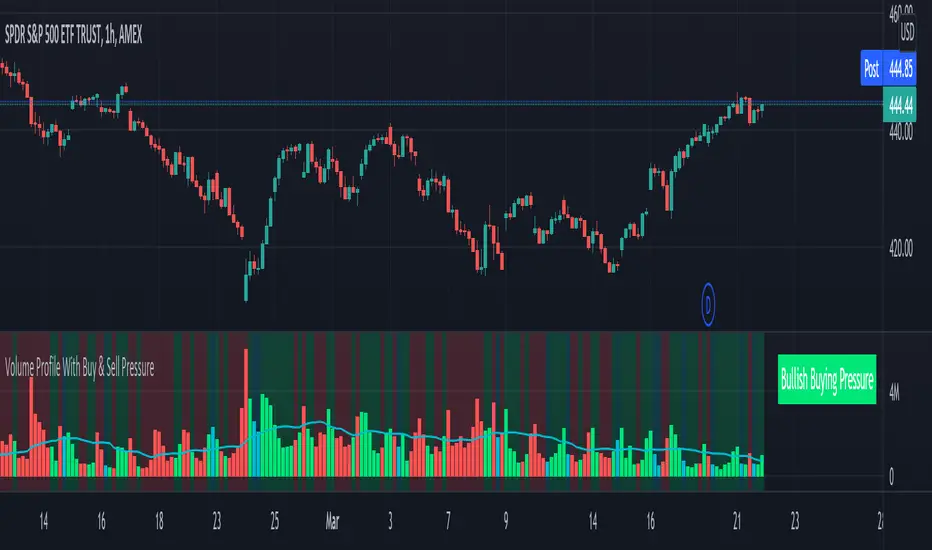
This volume profile indicator shows volume traded for each bar and is colored according to the difference in buy and sell pressure(DMI).
***HOW TO USE***
If the bar and background is colored green, there is more market buying than selling on that bar.
If the bar and background is colored red, there is more market selling than buying on that bar.
If the bar and background is colored blue, there is an equal amount of market buying and selling on that bar.
***BUY/SELL LABEL***
There is also a label on the right side that tells you whether there is more buying or selling on the current bar. This table updates in real time and changes colors so you can get an easy, quick interpretation of the current buy/sell pressure without having to look at the volume bars so you can make faster decisions on whether to enter or exit a trade. The table changes colors in sync with the volume bars and background. Green means more market buying than selling. Red means more market selling than buying. Blue means an equal amount of market buying and selling.
***MARKETS***
This indicator can be used as a signal on all markets, including stocks, crypto, futures and forex.
***TIMEFRAMES***
This volume profile indicator can be used on all timeframes.
***TIPS***
Try using numerous indicators of ours on your chart so you can instantly see the bullish or bearish trend of multiple indicators in real time without having to analyze the data. Some of our favorites are our Auto Fibonacci, DMI, Momentum, Auto Support And Resistance and Money Flow Index in combination with this Volume Profile. They all have real time Bullish and Bearish labels as well so you can immediately understand each indicator's trend.
Notes de version
Added the ability to turn the bull/bear label on or off for better viewing on the mobile app or users that don't want the label.Script open-source
Dans l'esprit TradingView, le créateur de ce script l'a rendu open source afin que les traders puissent examiner et vérifier ses fonctionnalités. Bravo à l'auteur! Bien que vous puissiez l'utiliser gratuitement, n'oubliez pas que la republication du code est soumise à nos Règles.
Trend Friend - Data Driven Trading Indicators For All Your Favorite Markets
Get Access To Our Premium Indicator Suite -> friendofthetrend.com/
Join Our Trading Group - facebook.com/groups/stockandcryptotradingstrategies
Get Access To Our Premium Indicator Suite -> friendofthetrend.com/
Join Our Trading Group - facebook.com/groups/stockandcryptotradingstrategies
Clause de non-responsabilité
Les informations et publications ne sont pas destinées à être, et ne constituent pas, des conseils ou recommandations financiers, d'investissement, de trading ou autres fournis ou approuvés par TradingView. Pour en savoir plus, consultez les Conditions d'utilisation.
Script open-source
Dans l'esprit TradingView, le créateur de ce script l'a rendu open source afin que les traders puissent examiner et vérifier ses fonctionnalités. Bravo à l'auteur! Bien que vous puissiez l'utiliser gratuitement, n'oubliez pas que la republication du code est soumise à nos Règles.
Trend Friend - Data Driven Trading Indicators For All Your Favorite Markets
Get Access To Our Premium Indicator Suite -> friendofthetrend.com/
Join Our Trading Group - facebook.com/groups/stockandcryptotradingstrategies
Get Access To Our Premium Indicator Suite -> friendofthetrend.com/
Join Our Trading Group - facebook.com/groups/stockandcryptotradingstrategies
Clause de non-responsabilité
Les informations et publications ne sont pas destinées à être, et ne constituent pas, des conseils ou recommandations financiers, d'investissement, de trading ou autres fournis ou approuvés par TradingView. Pour en savoir plus, consultez les Conditions d'utilisation.