PROTECTED SOURCE SCRIPT
MM-Burj Khalifa Indicator
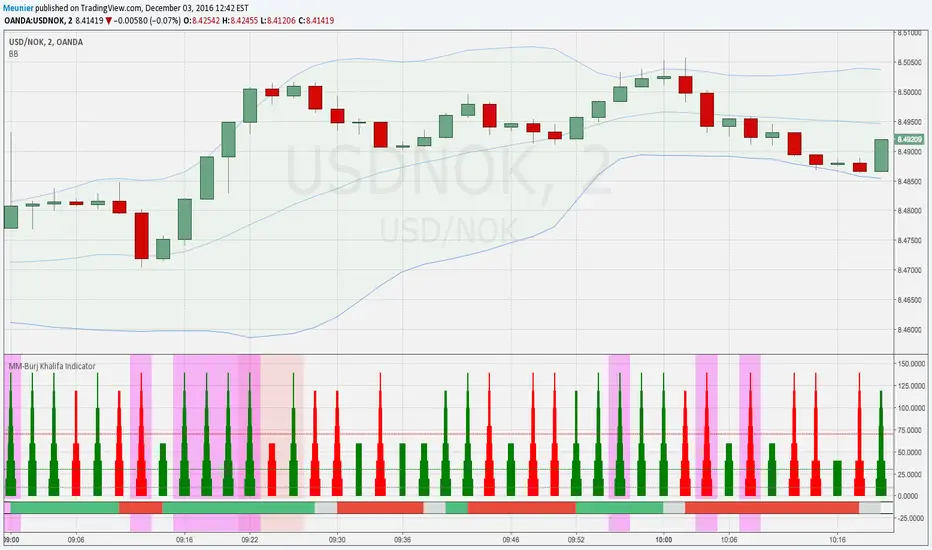
This indicator uses several signals to visualize a "perfect candle" to enter a trade.
It colors the background to identify the zones of interest (multiple configurable high or low RSI zones). Underlying is a trendbar with the current MACD direction. It's possible to tweak the indicator with a lot of options in the settings section (e.g. for which period you want a rising DM+-signal, etc.)
The indicator is using signals of:
--MACD
--RSI
--PVT
--ATR
--AD and DMI+/DMI-
When all 7 criterias are met it highlights the candle.
It also creates different colums with different height and width, so that you can see which signal is OK and which is maybe missing. When all signals are on GO you'll see a Burj-Khalifa-like figure. If not all signals are on GO you'see crippled versions.
To be clear:
it's not intended to detect trends or supertrends or reversals. It's purpose it's just to decide if this current candle is really going in the right direction. It doesn't prevent upcoming reversals in the opposite direction.
The Burj-Khalifa indicator could help to confirm the entry point of an trade which was already planned.
I'll come up with a more detailed documentation.
Script protégé
Ce script est publié en source fermée. Cependant, vous pouvez l'utiliser librement et sans aucune restriction – pour en savoir plus, cliquez ici.
Clause de non-responsabilité
Les informations et publications ne sont pas destinées à être, et ne constituent pas, des conseils ou recommandations financiers, d'investissement, de trading ou autres fournis ou approuvés par TradingView. Pour en savoir plus, consultez les Conditions d'utilisation.