OPEN-SOURCE SCRIPT
Mis à jour 63-Day Sector Relative Strength vs NIFTY
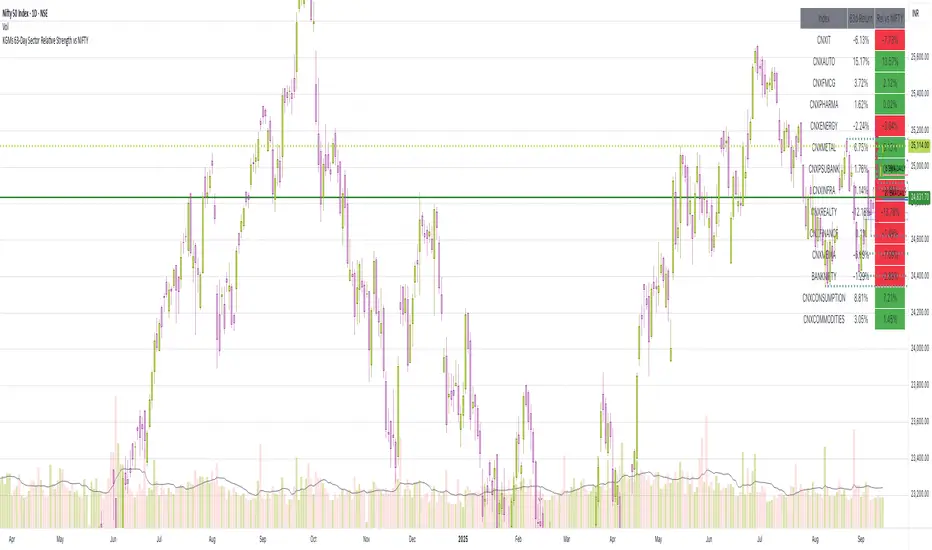
This script calculates and displays the 63-day returns of major NSE sectoral indices and their relative strength versus the NIFTY 50.
It,
Covered Indices: CNXIT, CNXAUTO, CNXFMCG, CNXPHARMA, CNXENERGY, CNXMETAL, CNXPSUBANK, CNXINFRA, CNXREALTY, CNXFINANCE, CNXMEDIA, BANKNIFTY, CNXCONSUMPTION, CNXCOMMODITIES
How to use this: Quickly identify which sectors are outperforming or underperforming relative to the NIFTY over the past 63 trading sessions (approx. 3 months).
It,
- [computes 63-day price returns for each sector index]
[calculates the relative performance of each sector against the Nifty 50]
[displays results in a table at the top right corner of the chart]
[highlights positive vs negative relative strength for quick comparision]
Covered Indices: CNXIT, CNXAUTO, CNXFMCG, CNXPHARMA, CNXENERGY, CNXMETAL, CNXPSUBANK, CNXINFRA, CNXREALTY, CNXFINANCE, CNXMEDIA, BANKNIFTY, CNXCONSUMPTION, CNXCOMMODITIES
How to use this: Quickly identify which sectors are outperforming or underperforming relative to the NIFTY over the past 63 trading sessions (approx. 3 months).
Notes de version
This script calculates and displays the 63-day returns of major NSE sectoral indices and their relative strength versus the NIFTY 50.It,
- Computes 63-day price returns for each sector index.
- Calculates the relative performance of each sector against the NIFTY 50.
- Displays results in a neat table at the top-right corner of the chart.
- Highlights positive vs negative relative strength for quick comparison.
Covered Indices: CNXIT, CNXAUTO, CNXFMCG, CNXPHARMA, CNXENERGY, CNXMETAL, CNXPSUBANK, CNXINFRA, CNXREALTY, CNXFINANCE, CNXMEDIA, BANKNIFTY, CNXCONSUMPTION, CNXCOMMODITIES
Useful to quickly identify which sectors are outperforming or underperforming relative to the broader market (i.e. NIFTY) over the past 63 trading sessions (approx. 3 months). Useful for sector rotation analysis, relative momentum analysis and macro market views
Script open-source
Dans l'esprit TradingView, le créateur de ce script l'a rendu open source afin que les traders puissent examiner et vérifier ses fonctionnalités. Bravo à l'auteur! Bien que vous puissiez l'utiliser gratuitement, n'oubliez pas que la republication du code est soumise à nos Règles.
Clause de non-responsabilité
Les informations et publications ne sont pas destinées à être, et ne constituent pas, des conseils ou recommandations financiers, d'investissement, de trading ou autres fournis ou approuvés par TradingView. Pour en savoir plus, consultez les Conditions d'utilisation.