PROTECTED SOURCE SCRIPT
Mis à jour US Market Strength Momentum [LG]
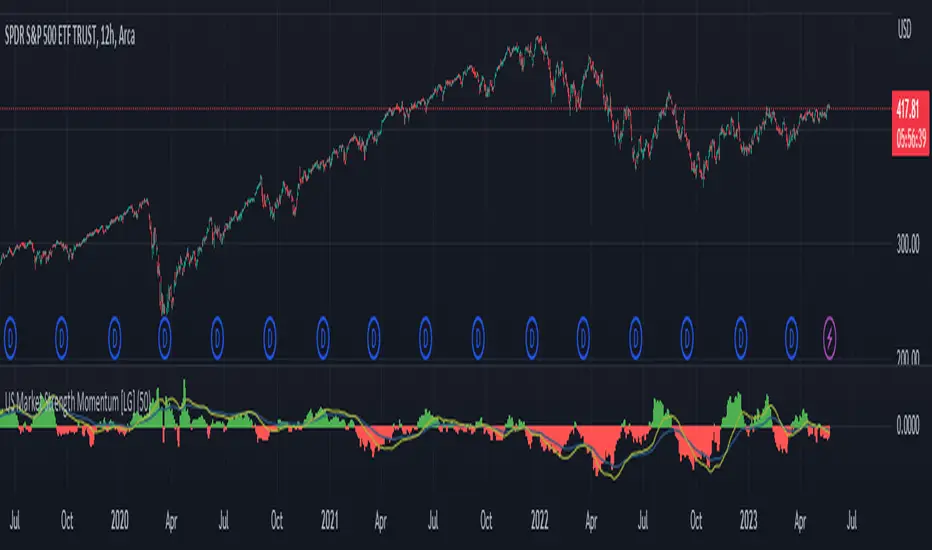
This indicator is designed to analyze the relative strength momentum of two US market indices, the Russell 2000 and S&P 500, by calculating their rate of change over a 21-bar period and comparing them. The difference between the average rate of change for IWM and SPY is then plotted as a histogram, with green bars indicating positive momentum and red bars indicating negative momentum.
The indicator also includes a moving average line, calculated over a 200-bar period, which is plotted on top of the histogram. This moving average helps to smooth out the data and provide a clearer picture of the longer-term trend.
In this indicator, the strength of the Russell 2000 compared to S&P 500 is seen as a gauge of market participants' risk tolerance. When Russell outperforms the S&P, market participants are assumed to be taking on greater risk in search of greater beta. When the S&P outperforms Russell, the assumption is that market participants are fleeing to safer assets (in regards to equities indices). The time frame the indicator is viewed on as well as the size of the rate of change delta dictates the strength of the trend.
Notes de version
Replaced the histogram MA with a momentum oscillator for greater insight.Notes de version
Major updates:Added in US Treasury rates of change to consider relative strength and weakness of the T-bill sector as part of US market strength and weakness as a whole.
Minor updates:
Added in input option to control the length of the ROC SMA.
Script protégé
Ce script est publié en source fermée. Cependant, vous pouvez l'utiliser librement et sans aucune restriction – pour en savoir plus, cliquez ici.
Clause de non-responsabilité
Les informations et publications ne sont pas destinées à être, et ne constituent pas, des conseils ou recommandations financiers, d'investissement, de trading ou autres fournis ou approuvés par TradingView. Pour en savoir plus, consultez les Conditions d'utilisation.