AlphaBTC - Long Term Trend Probability Indicator on Bitcoin
AlphaBTC is a consensus-based long-term trend probability indicator designed specifically for Bitcoin and cryptocurrency markets. It combines 9 independent trend detection methodologies into a single probabilistic score ranging from -1 (strong bearish) to +1 (strong bullish). Unlike single-indicator systems that can produce frequent false signals, AlphaBTC requires agreement across multiple analytical frameworks before generating directional signals.
METHODOLOGY - THE 9-INDICATOR CONSENSUS MODEL
Each indicator analyzes trend from a different mathematical perspective, providing a binary vote: +1 (bullish), -1 (bearish), or 0 (neutral). The average of all 9 votes creates the final probability score.
1. AADTREND (Average Absolute Deviation Trend)
Method: Calculates average absolute deviation from a moving average using 7 different MA types (SMA, EMA, HMA, DEMA, TEMA, RMA, FRAMA)
Logic: Price crossovers above/below AAD-adjusted bands signal trend changes
Purpose: Adapts to varying market volatility conditions
2. GAUSSIAN SMOOTH TREND (GST)
Method: Multi-stage smoothing using DEMA → Gaussian Filter → SMMA → Standard Deviation bands
Logic: Long when price > (SMMA + SDmultiplier), Short when price < (SMMA - SDmultiplier)
Purpose: Removes high-frequency noise while preserving trend structure
3. RTI (RELATIVE TREND INDEX)
Method: Percentile-based ranking system comparing current price to historical upper/lower trend boundaries
Logic: Generates 0-100 index score; >80 = bullish, <20 = bearish
Purpose: Identifies price position within statistical distribution
4. HIGHEST-LOWEST DEVIATIONS TREND
Method: Dual moving average system (100/50 periods) with dynamic standard deviation bands
Logic: Compares highest and lowest boundaries from both MAs to determine trend extremes
Purpose: Identifies breakouts from multi-timeframe volatility envelopes
5. 25-75 PERCENTILE SUPERTREND
Method: Modified SuperTrend using 25th and 75th percentile bands instead of simple highs/lows
Logic: ATR-based trailing stop system anchored to percentile boundaries
Purpose: More stable trend following by filtering outlier price spikes
6. TS VOLATILITY-ADJUSTED EWMA
Method: Exponentially Weighted Moving Average with dynamic period adjustment based on ATR
Logic: Speeds up during high volatility, slows during low volatility
Purpose: Adaptive responsiveness to changing market conditions
7. NORMALIZED KAMA OSCILLATOR
Method: Kaufman Adaptive Moving Average normalized to 0-centered oscillator
Logic: Uses Efficiency Ratio to adjust smoothing constant; >0 = bullish, <0 = bearish
Purpose: Adapts to both trending and ranging markets automatically
8. EHLERS MESA ADAPTIVE MOVING AVERAGE (EMAMA)
Method: John Ehlers' MAMA/FAMA system using Hilbert Transform for cycle period detection
Logic: MAMA crossover FAMA = bullish, crossunder = bearish
Purpose: Advanced DSP-based trend detection with phase-based adaptation
9. EMA Z-SCORE
Method: Statistical z-score applied to EMA values over lookback period
Logic: >1.0 standard deviation = bullish, <0.0 = bearish
Purpose: Identifies statistically significant trend deviations
AGGREGATION METHODOLOGY
Scoring System:
Each indicator produces: +1 (bullish), -1 (bearish), or 0 (neutral)
Total score = sum of all 9 indicators (-9 to +9)
Average score = total / 9 (displayed as -1.00 to +1.00)
Signal Interpretation:
+0.50 to +1.00: STRONG BULLISH (majority consensus)
+0.30 to +0.50: MODERATE BULLISH
-0.30 to +0.30: WEAK/NEUTRAL (mixed signals)
-0.50 to -0.30: MODERATE BEARISH
-1.00 to -0.50: STRONG BEARISH (majority consensus)
Bar Coloring:
Cyan bars: Bullish consensus (score > 0)
Magenta bars: Bearish consensus (score < 0)
WHY THIS APPROACH WORKS
Traditional Single-Indicator Problems:
Overfitting to specific market conditions
High false signal rates during consolidation
No mechanism for confidence measurement
AlphaBTC Multi-Consensus Solution:
Diversification: 9 uncorrelated methodologies reduce individual indicator bias
Robustness: Requires majority agreement before signaling (prevents whipsaws)
Adaptability: Mix of momentum, volatility, and statistical indicators captures multiple market regimes
Confidence Measurement: Score magnitude indicates signal strength
Why These 9 Specific Indicators:
AADTrend - Volatility adaptation
GST - Noise filtering
RTI - Statistical positioning
HL Deviations - Multi-timeframe breakouts
Percentile ST - Robust trend following
Volatility EWMA - Dynamic responsiveness
KAMA - Efficiency-based adaptation
EMAMA - Cycle-period awareness
EMA Z-Score - Statistical confirmation
This combination covers:
Trend following (ST, EWMA, KAMA, EMAMA)
Volatility adaptation (AAD, GST, HL Dev, EWMA)
Statistical validation (RTI, Z-Score)
Adaptive smoothing (KAMA, EMAMA, Gaussian)
No single indicator covers all these bases. The ensemble approach creates a more reliable system.
VISUAL COMPONENTS
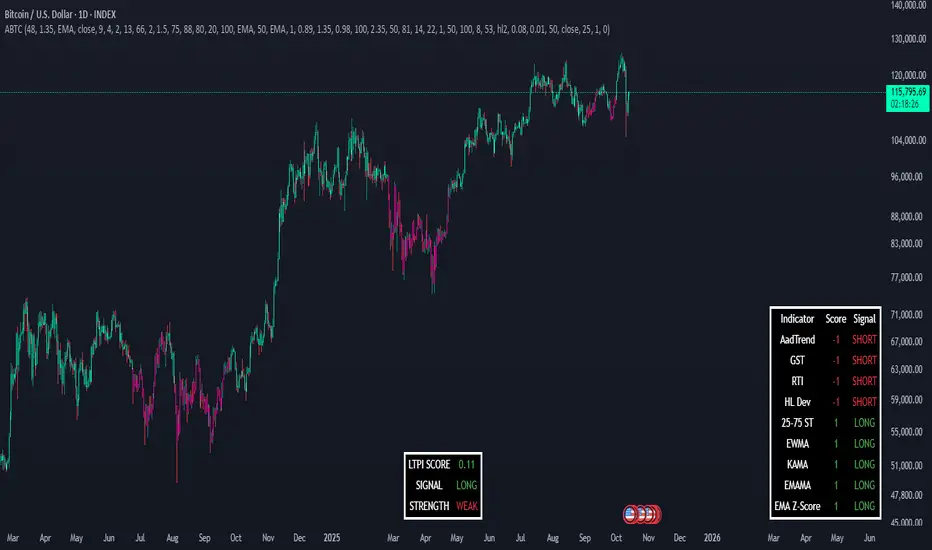
1. Score Table (Bottom Right):
Shows all 9 individual indicator scores
Color-coded: Green (bullish), Red (bearish), Gray (neutral)
Individual signals visible for transparency
2. Main Score Display (Bottom Center):
LTPI SCORE: The averaged consensus (-1.00 to +1.00)
SIGNAL: Current directional bias (LONG/SHORT)
STRENGTH: Signal confidence (STRONG/MODERATE/WEAK)
3. Bar Coloring:
Visual trend indication directly on price bars
Cyan = bullish consensus
Magenta = bearish consensus
HOW TO USE
For Long-Term Position Trading (Recommended):
Wait for average score to cross above 0 for long entries
Exit when score crosses below 0 or reverses to negative territory
Use STRENGTH indicator - only trade STRONG or MODERATE signals
For Trend Confirmation:
Use AlphaBTC as confluence with your existing strategy
Enter trades only when AlphaBTC agrees with your analysis
Avoid counter-trend trades when consensus is strong (|score| > 0.5)
Risk Management:
STRONG signals (|score| > 0.5): Full position size
MODERATE signals (0.3-0.5): Reduced position size
WEAK signals (< 0.3): Avoid trading or use for exits only
Best Timeframes:
1D chart: Primary trend identification for swing/position trading
4H chart: Intermediate trend for multi-day holds
1H chart: Short-term trend for active trading
Not Recommended:
Scalping (too many indicators create lag)
Timeframes < 1H (designed for longer-term trends)
SETTINGS EXPLAINED
Each of the 9 indicators has customizable parameters in its dedicated settings group:
AadTrend Settings:
Average Length (48): Base period for deviation calculation
AAD Multiplier (1.35): Band width adjustment
Average Type: Choose from 7 different MA types
GST Settings:
DEMA Length (9), Gaussian Length (4), SMMA Length (13)
SD Length (66): Standard deviation lookback
Multipliers for upper/lower bands
RTI Settings:
Trend Length (75): Historical data points for boundary calculation
Sensitivity (88%): Percentile threshold
Long/Short Thresholds (80/20): Entry trigger levels
HL Deviations Settings:
Dual MA system (100/50 periods)
Separate deviation coefficients for upper/lower bands
25-75 Percentile ST Settings:
SuperTrend Length (100)
Multiplier (2.35)
Percentile Length (50)
EWMA Settings:
Length (81), ATR Lookback (14)
Volatility Factor (1.0) for dynamic adjustment
KAMA Settings:
Fast/Slow Periods (50/100)
Efficiency Ratio Period (8)
Normalization Lookback (53)
EMAMA Settings:
Fast/Slow Limits (0.08/0.01) for cycle adaptation
EMA Z-Score Settings:
EMA Length (50)
Lookback Period (25)
Threshold levels for long/short signals
ALERTS
Four alert conditions available:
LTPI Long Signal: When average score crosses above 0
LTPI Short Signal: When average score crosses below 0
LTPI Long: Any bar with bullish consensus
LTPI Short: Any bar with bearish consensus
IMPORTANT NOTES
This is a CONSENSUS indicator - it shows probability, not prediction
Designed for Bitcoin
Best for long-term trend identification (days to weeks, not minutes to hours)
Lagging by design - prioritizes accuracy over speed
Not a standalone strategy - use with proper risk management and position sizing
Requires minimum 100+ bars of historical data for proper indicator calculation
Script sur invitation seulement
Seuls les utilisateurs approuvés par l'auteur peuvent accéder à ce script. Vous devrez demander et obtenir l'autorisation pour l'utiliser. Celle-ci est généralement accordée après paiement. Pour plus de détails, suivez les instructions de l'auteur ci-dessous ou contactez directement AlphaEdge_.
TradingView ne recommande PAS de payer ou d'utiliser un script à moins que vous ne fassiez entièrement confiance à son auteur et que vous compreniez comment il fonctionne. Vous pouvez également trouver des alternatives gratuites et open-source dans nos scripts communautaires.
Instructions de l'auteur
Clause de non-responsabilité
Script sur invitation seulement
Seuls les utilisateurs approuvés par l'auteur peuvent accéder à ce script. Vous devrez demander et obtenir l'autorisation pour l'utiliser. Celle-ci est généralement accordée après paiement. Pour plus de détails, suivez les instructions de l'auteur ci-dessous ou contactez directement AlphaEdge_.
TradingView ne recommande PAS de payer ou d'utiliser un script à moins que vous ne fassiez entièrement confiance à son auteur et que vous compreniez comment il fonctionne. Vous pouvez également trouver des alternatives gratuites et open-source dans nos scripts communautaires.