PROTECTED SOURCE SCRIPT
Mis à jour ZTrend
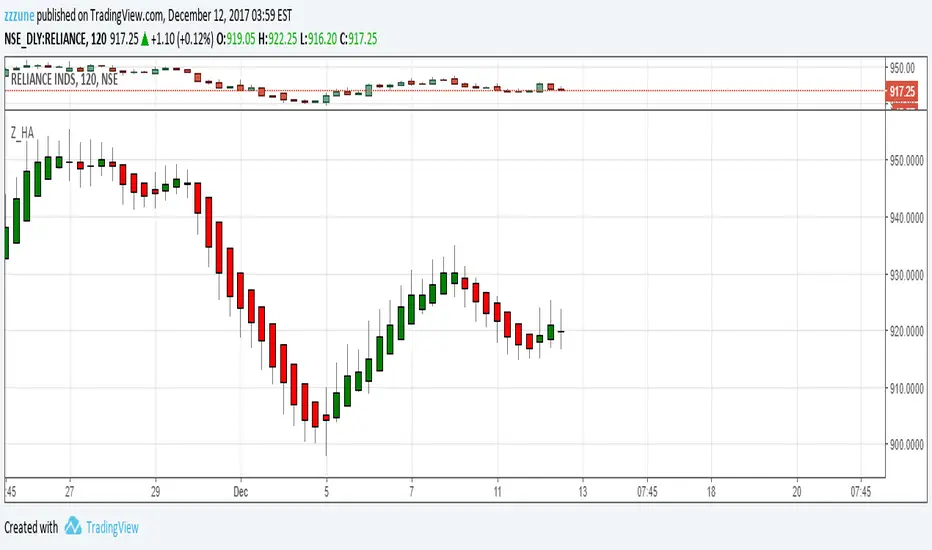
Pick Bottoms and Tops of a trend with ZTrend indicator. Use this indicator in multi frame for superb results.
If you are a Short Term trader, then use 2 hourly and Daily timeframe combination.
So after a downtrend, buy when 2 hourly candle turns green and wait until Daily candle also turns Green. Exit when 2 hourly candle turns red.
Ride the trend and do not exit until the 2 hourly candle turns Red.
When 2 consecutive candle body become thin, means end of a trend is near. Therefore either reduce the position or hedge.
Discipline is the key, therefore exit on the indication and do not wait in hope of marking turning your side.
Notes de version
study("ZTrend", shorttitle="Z_HA", overlay=false)O = ema(open,3)
H = ema(high,3)
L = ema(low,3)
C = ema(close,3)
haclose = (O + H + L + C) / 4
haopen = na(haopen[1]) ? (O + C) / 2 : (haopen[1] + haclose[1]) / 2
hahigh = max(H, max(haopen, haclose))
halow = min(L, min(haopen, haclose))
plotcandle(haopen, hahigh, halow, haclose, title='Mod_HA', color=(haopen < haclose) ? green : red, wickcolor=gray)
Notes de version
New update will plot ZTrend on the price chart itself.Use the Show/Hide button beside name of the instrument example show/Hide button just beside "NIFTY, 1D, NSE"
Notes de version
Actual closing price of each bar now is also plotted in light blue line. This will help give an indication where exactly the actual price is with respect to ZTrend bars.Script protégé
Ce script est publié en source fermée. Cependant, vous pouvez l'utiliser librement et sans aucune restriction – pour en savoir plus, cliquez ici.
Clause de non-responsabilité
Les informations et publications ne sont pas destinées à être, et ne constituent pas, des conseils ou recommandations financiers, d'investissement, de trading ou autres fournis ou approuvés par TradingView. Pour en savoir plus, consultez les Conditions d'utilisation.
Script protégé
Ce script est publié en source fermée. Cependant, vous pouvez l'utiliser librement et sans aucune restriction – pour en savoir plus, cliquez ici.
Clause de non-responsabilité
Les informations et publications ne sont pas destinées à être, et ne constituent pas, des conseils ou recommandations financiers, d'investissement, de trading ou autres fournis ou approuvés par TradingView. Pour en savoir plus, consultez les Conditions d'utilisation.