Quadro Volume Profile [BigBeluga]🔵 OVERVIEW
The Quadro Volume Profile is a precision-engineered volume profiling tool that segments market activity into four distinct quadrants surrounding the current price. By separating bullish and bearish volume above and below the current price, it helps traders identify dominant forces and high-interest price zones with ease. Each quadrant includes label annotations showing total volume and its share of overall activity — delivering powerful insights into the market’s internal structure.
🔵 CONCEPTS
Four-Quadrant Volume Distribution : Volume is separated into Buy and Sell profiles both above and below the current price.
Directional Volume Logic : Bullish and bearish candle volume is allocated to specific bins, creating color-coded volume stacks.
Dynamic PoC Detection : Point of Control (PoC) levels are calculated per quadrant and optionally displayed.
Lookback-Based Anchoring : The volume histogram is anchored to a fixed lookback window, ensuring consistency and historical context.
Label-Based Analytics : Each quadrant displays a labeled breakdown of direction, total volume, and percentage weight of total activity.
🔵 FEATURES
Four separate volume profiles:
Upper Left: Bearish volume (Sell Quad above price)
Upper Right: Bullish volume (Buy Quad above price)
Lower Left: Bullish volume (Buy Quad below price)
Lower Right: Bearish volume (Sell Quad below price)
Live Labels for Each Quad:
Displays BUY or SELL direction
Shows total volume per quadrant (e.g. 607.49K)
Displays percent share of total quad volume (e.g. 18.87%)
Toggle visibility for each profile and each Point of Control (PoC) dashed PoC lines with volume annotations
Adjustable calculation period (lookBack), number of bins, and horizontal offset
Color gradient intensity represents volume strength per bin
Auto-cleaning visuals to keep the chart uncluttered
Gradient color control for Buy and Sell volumes
Clean midline split between upper and lower quadrants
🔵 HOW TO USE
Select your desired calculation period (default: 200 bars) to define the range for volume analysis.
Adjust the bins parameter for more or less resolution in volume distribution.
Toggle each quadrant on/off depending on your preference using the settings panel:
“Upper Sell Quad” – shows bearish volume above current price (left)
“Upper Buy Quad” – shows bullish volume above current price (right)
“Lower Buy Quad” – shows bullish volume below current price (left)
“Lower Sell Quad” – shows bearish volume below current price (right)
Enable or disable PoC lines for each quad to highlight where volume peaked.
Use the gradient coloring to identify volume imbalances — sharp differences between opposing quads often indicate key zones of rejection or breakout.
Monitor the midline level which splits the four quadrants — it serves as a psychological pivot zone.
🔵 CONCLUSION
The Quadro Volume Profile offers a powerful and visually intuitive way to dissect market activity around price. By splitting volume into four quadrants, traders can better interpret order flow, identify dominant volume zones, and spot potential reversals or continuation setups. Whether you're trading breakouts, liquidity sweeps, or range-bound behavior — this tool adds a structured layer of volume context to your charting workflow.
Indicateurs et stratégies

Multi-Pattern Candlestick Entry IndicatorKey Features:
Bullish Patterns Detected:
Hammer
Inverted Hammer
Bullish Engulfing
Morning Star
Piercing Pattern
Dragonfly Doji
Bearish Patterns Detected:
Hanging Man
Shooting Star
Bearish Engulfing
Evening Star
Dark Cloud Cover
Gravestone Doji
Alert System:
Bullish Entry Alert: Triggers when any bullish pattern is detected
Bearish Entry Alert: Triggers when any bearish pattern is detected
Customizable alert messages with pattern name and price level
Visual Features:
Green triangles below bars for bullish signals
Red triangles above bars for bearish signals
Pattern name labels on chart
Background highlighting for confirmed entries
Status table showing which patterns are enabled
Customization Options:
Enable/disable individual patterns
Toggle visual elements (labels, shapes)
Control alert preferences
Pattern-specific on/off switches

Estimated Manipulation Movement Signal [AlgoPoint]Follow the Footprints of Whale Movements That Drive the Market
Overview
The market is not always driven by natural supply and demand. Large players—often called "whales" or institutions—can create artificial price movements to trigger stop-losses, induce panic or FOMO, and build their large positions at favorable prices. These events are known as "stop hunts" or "liquidity grabs."
The EMMS indicator is a specialized tool designed to detect these specific moments of potential market manipulation. It does not follow trends in a traditional sense; instead, it identifies high-probability reversal points created by the calculated actions of Smart Money trapping other market participants.
How It Works: The 3-Module Logic
The indicator uses a multi-stage confirmation process to identify a potential stop hunt:
1. Anomaly Detection: The engine first scans the chart for "Anomaly Candles." These are candles with unusually high volume and a very long wick relative to their body. This combination signals a sudden, forceful, and potentially unnatural price push.
2. Liquidity Zone Detection: The indicator automatically identifies and tracks recent significant swing highs and lows. These levels are considered "Liquidity Zones" because they are areas where a large number of stop-loss orders are likely clustered. These are the "hunting grounds" for whales.
3. The Stop Hunt Signal: A final signal is generated only when these two events align in a specific sequence:
An Anomaly Candle (high volume, long wick) spikes through a previously identified Liquidity Zone.
The same candle then reverses, closing back inside the previous price range.
This sequence confirms that the move was likely a "trap" designed to engineer liquidity, and a reversal in the opposite direction is now highly probable.
How to Interpret & Use This Indicator
BUY Signal: A BUY signal appears after a sharp price drop that pierces a recent swing low (taking out the stops of long positions) and then aggressively reverses to close higher. This suggests that Smart Money has absorbed the panic selling they just induced. The signal indicates a potential move UP.
SELL Signal: A SELL signal appears after a sharp price spike that pierces a recent swing high (taking out the stops of short positions) and then aggressively reverses to close lower. This suggests that Smart Money has sold into the FOMO buying they just created. The signal indicates a potential move DOWN.
This indicator is best used as a high-probability confirmation tool, ideally in conjunction with your understanding of the overall market trend and structure.

Volume-Weighted RSI & Multi-Normalized MACD### Description for Publishing: Volume-Weighted RSI & Multi-Normalized MACD
**Overview**
The "Volume-Weighted RSI & Multi-Normalized MACD" indicator is a powerful and versatile tool designed for traders seeking enhanced momentum and trend analysis. Combining a volume-weighted Relative Strength Index (VW-RSI) with a customizable Moving Average Convergence Divergence (MACD) featuring multiple normalization methods, this indicator provides deep insights into market dynamics. It supports multi-timeframe (MTF) analysis and includes an optional stepped plotting mode for discrete signal visualization, making it ideal for both trend-following and mean-reversion strategies across various markets (stocks, forex, crypto, etc.).
**Key Features**
1. **Volume-Weighted RSI (VW-RSI)**:
- A modified RSI that incorporates trading volume for greater sensitivity to market activity.
- Normalized to a user-defined range (default: -50 to +50) for consistent analysis.
- Optional smoothing with multiple moving average types (SMA, EMA, WMA, VWMA, SMMA, or SMA with Bollinger Bands) to reduce noise and highlight trends.
- Overbought (+20) and oversold (-20) levels for quick reference.
2. **Multi-Normalized MACD**:
- Offers six normalization methods for MACD, allowing traders to tailor the output to their strategy:
- Normalized Volume Weighted MACD (unbounded).
- Min-Max Normalization (bounded).
- Volatility Normalization (unbounded, volatility-adjusted).
- Volatility Normalization with Min-Max (bounded).
- Hyperbolic Tangent Normalization (bounded).
- Arctangent Normalization (bounded).
- Min-Max with Smoothing (bounded).
- All bounded methods scale to the user-defined range (default: -50 to +50), ensuring comparability with VW-RSI.
- Dynamic color changes for MACD line (lime/red) and histogram (aqua/blue/red/maroon) based on momentum and signal line crosses.
3. **Stepped Plotting Mode**:
- Optional mode to plot RSI and MACD as discrete, stepped lines, reducing noise by only updating when values change significantly (configurable thresholds).
- Ideal for traders focusing on clear, actionable signal changes.
4. **Multi-Timeframe Support**:
- Configurable timeframe input (default: chart timeframe) for analyzing RSI and MACD on higher or lower timeframes, enhancing cross-timeframe strategies.
5. **Customizable Display**:
- Toggle options to show/hide MACD line, signal line, histogram, and cross dots.
- Bollinger Bands for RSI smoothing (optional) with adjustable standard deviation multiplier.
- Clear visual cues with horizontal lines for overbought/oversold levels, midline, and MACD bounds.
**Usage Instructions**
1. **Add to Chart**: Apply the indicator to any symbol (e.g., BTCUSD, SPY) on any timeframe (1H, 1D, etc.).
2. **Configure Settings**:
- **General**: Adjust `Lower Bound` (-50 default) and `Upper Bound` (+50 default) for the output range. Set `Timeframe` for MTF analysis. Enable `Stepped?` for discrete plotting.
- **RSI**: Choose `Price Source` (default: ohlc4), `RSI Length` (default: 9), and smoothing options (e.g., EMA, Bollinger Bands). Adjust `RSI Diff Threshold` for stepped mode.
- **MACD**: Select `Price Source`, `Fast Length` (9), `Slow Length` (21), `Signal Length` (9), and a normalization method (default: Volatility Min-Max). Adjust `MACD Diff Threshold` for stepped mode.
- **Display Options**: Toggle MACD components and histogram colors for clarity.
3. **Interpretation**:
- **VW-RSI**: Watch for crosses above +20 (overbought) or below -20 (oversold) for potential reversals. Use smoothed RSI or Bollinger Bands for trend confirmation.
- **MACD**: Look for MACD/Signal line crosses (dots indicate crossings) and histogram changes for momentum shifts. Bounded normalizations align with RSI for unified analysis.
- **Stepped Mode**: Focus on significant changes in RSI/MACD for clearer signals.
4. **Companion Overlay**: For visualization on the main price chart, use the companion script "VW-RSI & MACD Price Overlay" (available separately, requires this script to be published). It plots RSI and MACD as price-scaled echo lines, with toggles to show/hide and customizable scaling (high/low or ATR).
**Who Is This For?**
- **Trend Traders**: Use MACD normalizations and MTF to identify momentum shifts across timeframes.
- **Mean-Reversion Traders**: Leverage VW-RSI’s overbought/oversold signals for entry/exit points.
- **Technical Analysts**: Customize normalization and smoothing to match specific market conditions.
- **All Markets**: Works on stocks, forex, cryptocurrencies, and more, with any timeframe.
**Notes**
- Unbounded MACD normalizations (`enable_nvw`, `enable_vol`) may produce values outside -50/+50, suitable for volatility-focused strategies.
- For price chart overlay, publish this script and use its ID in the companion script’s `request.security` call.
- Adjust scaling inputs in the companion script for optimal visualization on volatile or stable assets.
**Author’s Note**
Developed by NEPOLIX, this indicator combines volume-weighted precision with flexible normalization for robust technical analysis. Feedback and suggestions are welcome to enhance future versions!

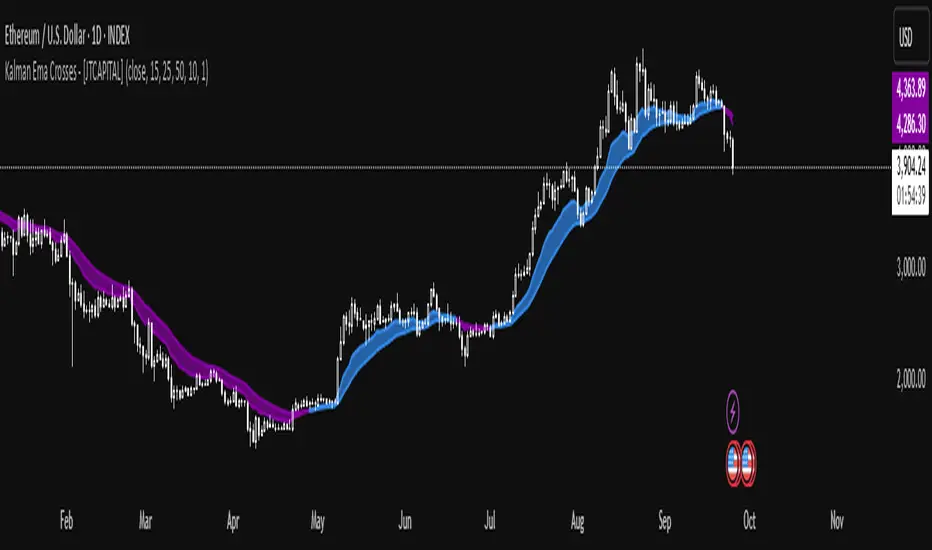
Kalman Ema Crosses - [JTCAPITAL]Kalman EMA Crosses - is a modified way to use Kalman Filters applied on Exponential Moving Averages (EMA Crosses) for Trend-Following.
The Kalman filter is a recursive smoothing algorithm that reduces noise from raw price or indicator data, and in this script it is applied both directly to price and on top of EMA calculations. The goal is to create cleaner, more reliable crossover signals between two EMAs that are less prone to false triggers caused by volatility or market noise.
The indicator works by calculating in the following steps:
Source Selection
The script starts by selecting the price input (default is Close, but can be adjusted). This chosen source is the foundation for all further smoothing and EMA calculations.
Kalman Filtering on Price
Depending on user settings, the selected source is passed through one of two independent Kalman filters. The filter takes into account process noise (representing expected market randomness) and measurement noise (representing uncertainty in the price data). The Kalman filter outputs a smoothed version of price that minimizes noise and preserves underlying trend structure.
EMA Calculation
Two exponential moving averages (EMA 1 and EMA 2) are then computed on the Kalman-smoothed price. The lengths of these EMAs are fully customizable (default 15 and 25).
Kalman Filtering on EMA Values
Instead of directly using raw EMA curves, the script applies a second layer of Kalman filtering to the EMA values themselves. This step significantly reduces whipsaw behavior, creating smoother crossovers that emphasize real momentum shifts rather than temporary volatility spikes.
Trend Detection via EMA Crossovers
-A bullish trend is detected when EMA 1 (fast) crosses above EMA 2 (slow).
-A bearish trend is detected when EMA 1 crosses below EMA 2.
The detected trend state is stored and used to dynamically color the plots.
Visual Representation
Both EMAs are plotted on the chart. Their colors shift to blue during bullish phases and purple during bearish phases. The area between the two EMAs is filled with a shaded region to clearly highlight trending conditions.
Buy and Sell Conditions :
- Buy Condition : When the Kalman-smoothed EMA 1 crosses above the Kalman-smoothed EMA 2, a bullish crossover is confirmed.
- Sell Condition : When EMA 1 crosses below EMA 2, a bearish crossover is confirmed.
Users may enhance the robustness of these signals by adjusting process noise, measurement noise, or EMA lengths. Lower measurement noise values make the filter react faster (but potentially noisier), while higher values make it smoother (but slower).
Features and Parameters :
- Source : Selectable price input (Close, Open, High, Low, etc.).
- EMA 1 Length : Defines the fast EMA period.
- EMA 2 Length : Defines the slow EMA period.
- Process Noise : Controls how much randomness the Kalman filter assumes in price dynamics.
- Measurement Noise : Controls how much uncertainty is assumed in raw input data.
- Kalman Usage : Option to apply Kalman filtering either before EMA calculation (on price) or after (on EMA values).
Specifications :
Kalman Filter
The Kalman filter is an optimal recursive algorithm that estimates the state of a system from noisy measurements. In trading, it is used to smooth prices or indicator values. By balancing process noise (expected volatility) with measurement noise (data uncertainty), it generates a smoothed signal that reacts adaptively to market conditions.
Exponential Moving Average (EMA)
An EMA is a weighted moving average that emphasizes recent data more heavily than older data. This makes it more responsive than a simple moving average (SMA). EMAs are widely used to identify trends and momentum shifts.
EMA Crossovers
The crossing of a fast EMA above a slow EMA suggests bullish momentum, while the opposite suggests bearish momentum. This is a cornerstone technique in trend-following systems.
Dual Kalman Filtering
Applying Kalman both to raw price and to the EMAs themselves reduces whipsaws further. It creates crossover signals that are not only smoothed but also validated across two levels of noise reduction. This significantly enhances signal reliability compared to traditional EMA crossovers.
Process Noise
Represents the filter’s assumption about how much the underlying market can randomly change between steps. Higher values make the filter adapt faster to sudden changes, while lower values make it more stable.
Measurement Noise
Represents uncertainty in price data. A higher measurement noise value means the filter trusts the model more than the observed data, leading to smoother results. A lower value makes the filter more reactive to observed price fluctuations.
Trend Coloring & Fill
The use of dynamic colors and filled regions provides immediate visual recognition of trend states, helping traders act faster and with greater clarity.
Enjoy!
BB Crosses Optimized - [JTCAPITAL]BB Crosses Optimized - is a modified way to use Bollinger Bands combined with volatility filtering (ATR) and flexible smoothing methods for Trend-Following.
The indicator works by calculating in the following steps:
Source Selection & Smoothing
The script begins by letting the user select a preferred price source (default is Close, but options include Open, High, Low, HL2, etc.). This raw input is then passed through a smoothing process.
Multiple smoothing techniques can be chosen: SMA, EMA, HMA, DEMA, TEMA, RMA, and FRAMA. Each method reduces short-term noise differently, ensuring flexibility for traders who prefer faster or slower reaction speeds in trend detection.
Bollinger Band Construction
Once the smoothed source is prepared, Bollinger Bands are calculated. The middle band is a moving average of the smoothed data over the defined BB Period . The upper and lower bands are then generated by adding and subtracting the Standard Deviation × Deviation multiplier . These dynamic bands capture volatility and help define breakout zones.
ATR Volatility Measurement
Parallel to the band calculation, the Average True Range (ATR) is computed over the chosen ATR Period . This measures market volatility. The ATR can optionally act as a filter, refining buy and sell levels so signals adapt to current market conditions rather than being fixed to price alone.
Bollinger Band Signals
-If the smoothed price closes above the upper band, a potential bullish event is marked.
-If the smoothed price closes below the lower band, a potential bearish event is marked.
Trend Line Construction
When a bullish event occurs, the script anchors a trend-following line beneath price. If ATR filtering is enabled, the line is set at Low – ATR , otherwise at the simple Low. Conversely, when a bearish event occurs, the line is anchored above price at High + ATR (or just High without the filter). The line is designed to only move in the direction of the trend—if price action does not exceed the prior value, the previous level is held. This prevents unnecessary whipsaws and keeps the indicator aligned with dominant momentum.
Final Trend Detection
The slope of the trend line defines the trend itself:
-Rising line → bullish trend.
-Falling line → bearish trend.
Visual Output
The indicator plots the trend line with dynamic coloring: Blue for bullish phases, Purple for bearish phases. A subtle filled background area emphasizes the active trend zone for clearer chart interpretation.
Buy and Sell Conditions:
- Buy Signal : Triggered when smoothed price closes above the upper Bollinger Band. Trend line then anchors below price (with or without ATR offset depending on settings).
- Sell Signal : Triggered when smoothed price closes below the lower Bollinger Band. Trend line then anchors above price (with or without ATR offset).
Additional filtering is possible via:
- ATR Toggle : Switch ATR on or off to adapt the strategy to either volatile or steady markets.
- Smoothing Method : Adjust smoothing to speed up or slow down responsiveness.
- Deviation Multiplier : Tight or wide bands adjust the sensitivity of signals.
Features and Parameters:
- Source : Choose between Close, Open, High, Low, HL2, etc.
- Average Type : Options include SMA, EMA, HMA, DEMA, TEMA, RMA, FRAMA.
- ATR Period : Defines how ATR volatility is measured.
- BB Period : Lookback length for Bollinger Band construction.
- Deviation : Multiplier for the standard deviation in Bollinger Bands.
- Smoothing Period : Controls how much the source data is smoothed.
- ATR Filter On/Off : Enables or disables ATR integration in signal calculation.
Specifications:
Smoothing (MA Types)
Smoothing is essential to reduce chart noise. By offering multiple MA choices, traders can balance between lag (SMA, RMA) and responsiveness (EMA, HMA, FRAMA). This flexibility allows the indicator to adapt across asset classes and trading styles.
Bollinger Bands
Bollinger Bands measure price deviation around a moving average. They help identify volatility expansion and contraction. In this script, the bands serve as breakout triggers—price crossing outside suggests momentum strong enough to sustain a trend.
Standard Deviation
Standard Deviation is a statistical measure that quantifies the dispersion of price data around the mean. With a multiplier applied, it creates bands that contain a probabilistic portion of price action. Crossing beyond these suggests a higher likelihood of trend continuation.
ATR (Average True Range)
ATR measures the degree of volatility. Instead of simply reacting to price crossing the bands, ATR ensures the trend line placement adapts to current conditions. In volatile markets, wider buffers prevent premature signals; in calmer markets, tighter placement keeps signals responsive.
Trend Line Logic
The trend line only adjusts in the direction of the trend. If new values do not exceed the prior, the line remains unchanged. This prevents false reversals and makes the line a reliable visual confirmation of trend direction.
Signal Detection
The indicator does not repaint: signals are based on confirmed closes relative to the Bollinger Bands. This makes it more reliable for both live trading and backtesting scenarios.
Visual Enhancements
The use of dual plots and fill shading creates a clearer separation of bullish vs. bearish phases. This helps traders visually align entries and exits without second-guessing.
Enjoy!

X VIBVolume Imbalance Zones
X VIB highlights price-levels where buying or selling pressure overwhelmed the opposing side within a single bar transition, leaving a void that the market often revisits. The script paints those voids as boxes so you can quickly see where liquidity may rest, where price may pause or react, and which imbalances persist across sessions.
What it plots
For each completed calculation bar (your chart’s timeframe or a higher timeframe you choose), the indicator draws a box that spans the prior bar’s close to the current bar’s open—only when that bar-to-bar transition exhibits a valid volume imbalance (VIB) by the selected rules. Boxes are time-anchored from the previous bar’s time to the current bar’s time close, and they are capped to a configurable count so the chart remains readable.
Two ways to define “Volume Imbalance”
X VIB calculates imbalances in two complementary ways. Both techniques isolate bar-to-bar displacement that reflects one-sided pressure, but they differ in strictness and how much confirmation they require.
Continuity VIB (Bar-to-Bar Displacement)
A strict definition that requires aligned progress and overlap between consecutive bars. In practical terms, a bullish continuity VIB demands that the new bar advances beyond the prior bar’s close, opens above it, and maintains upward progress without erasing the displacement; the bearish case mirrors this to the downside.
Use when: you want the cleanest, most structurally reliable voids that reflect decisive initiative flow.
Effect on boxes: typically fewer, higher-quality zones that mark locations of strong one-sided intent.
Gap-Qualified VIB (Displacement with Gap Confirmation)
A confirmatory definition that treats the bar-to-bar displacement as an imbalance only if the transition also observes a protective “gap-like” relationship with surrounding prices. This extra condition filters out many borderline transitions and emphasizes voids that were less likely to be traded through on their formation.
Use when: you want additional confirmation that the void had genuine follow-through pressure at birth.
Effect on boxes: often slightly fewer but “stickier” zones that can attract price on retests.
Both modes are drawn identically on the chart (as boxes spanning the displacement). Their difference is purely in the qualification of what counts as a VIB. You can display either set independently or together to compare how each mode surfaces structure.
Multi-Timeframe (MTF) logic
You can compute imbalances on a higher timeframe (e.g., 15-minute) while viewing a lower timeframe chart. When MTF is active, X VIB:
Samples open, high, low, close, time, and time_close from the selected HTF in a single, synchronized request (no gaps, no lookahead).
Only evaluates and draws boxes once per HTF bar close, ensuring clean, stable zones that don’t repaint intra-bar.
How traders use these zones
Reversion into voids: Price often returns to “fill” part of a void before deciding on continuation or reversal.
Context for entries/exits: VIB boxes provide precise, mechanically derived levels for limit entries, scale-outs, and invalidation points.
Confluence: Combine with session opens, HTF levels, or volatility bands to grade setups. Continuity VIBs can mark impulse anchors; Gap-Qualified VIBs often mark stickier pockets.
Inputs & controls
Calculate on higher timeframe? Toggle MTF computation; choose your Calc timeframe (e.g., 15).
Show VIBs: Master toggle for drawing imbalance boxes.
Color & Opacity: Pick the box fill and border intensity that suits your theme.
# Instances: Cap how many historical boxes remain on the chart to avoid clutter.
Notes & best practices
Signal density: Continuity VIBs tend to be more frequent on fast charts; Gap-Qualified VIBs are more selective. Try both and keep what aligns with your trade plan.
MTF discipline: When using a higher calc timeframe, analyze reactions primarily at that timeframe’s pace to avoid over-fitting to noise.
Lifecycle awareness: Not all voids fill. Track which boxes persist; durable voids often define the map of the session.

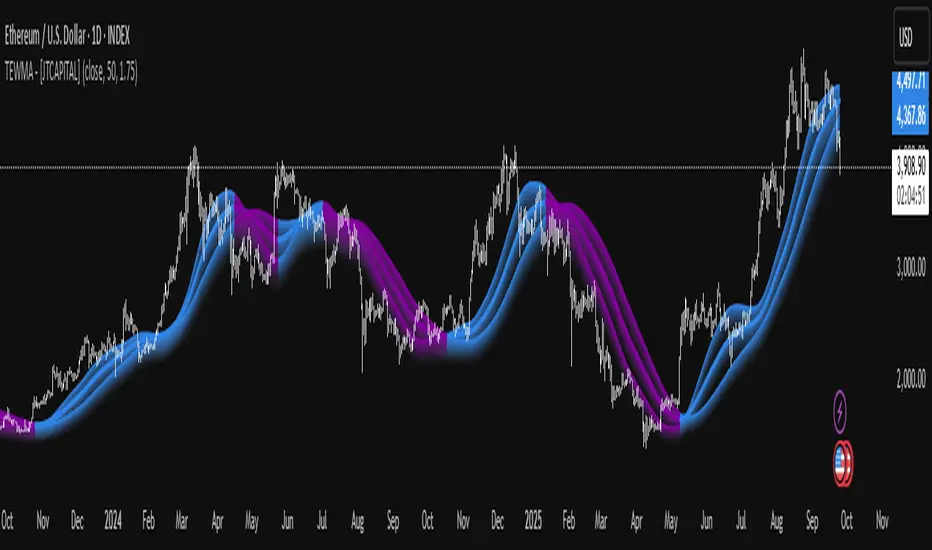
TEWMA - [JTCAPITAL]TEWMA - is a modified way to use Triple Exponential Moving Average (TEMA) combined with Weighted Moving Average (WMA) and adaptive multi-length averaging for Trend-Following.
The indicator blends short- and extended-length smoothed signals into a single adaptive line, then assigns directional bias to highlight bullish or bearish phases more clearly.
The indicator works by calculating in the following steps:
Source Selection
The script begins with a selectable price source (default: Close, but can be changed to Open, High, Low, HL2, etc.). This ensures flexibility depending on the user’s preferred market perspective.
Dual-Length Calculation
A base length ( len ) is chosen, and then multiplied by a factor ( multi , default 1.75). This produces a secondary, longer period ( len2 ) that adapts proportionally to the base.
Weighted + Triple Exponential Smoothing
-First, a WMA (Weighted Moving Average) is applied to the price source.
-Then, the TEMA (Triple Exponential Moving Average) is applied to smooth the WMA even further.
-This process is repeated for both len and len2 , producing TEWMA1 and TEWMA2 .
Adaptive Averaging
The final TEWMA line is calculated as the average of TEWMA1 and TEWMA2, creating a blend between the short-term and extended-term signals. This balances reactivity and stability, reducing lag while avoiding excessive noise.
Trend Direction Detection
-If TEWMA is greater than its previous value → Bullish .
-If TEWMA is lower than its previous value → Bearish .
-A Signal variable is used to store this directional bias, ensuring continuity between bars.
Visual Plotting
-The main TEWMA is plotted with bold coloring (Blue for bullish, Purple for bearish).
-TEWMA1 and TEWMA2 are plotted as thinner supporting lines.
-Each line is given a shadow-fill (between 100% and 90% of its value) for emphasis and visual clarity.
Alerts
Custom alerts are defined:
- TEWMA Long → when bullish.
- TEWMA Short → when bearish.
-These alerts can be integrated into TradingView’s alerting system for automated notifications.
Buy and Sell Conditions :
- Buy : Triggered when TEWMA rises (bullish slope). The indicator colors the line blue and an alert can be fired.
- Sell : Triggered when TEWMA declines (bearish slope). The line turns purple, signaling potential short or exit points.
Features and Parameters :
- Source → Selectable price input (Close, Open, HL2, etc.).
- Length (len) → Base period for the WMA/TEMA calculation.
- Multiplier (multi) → Scales the secondary length to create a longer-term smoothing.
- Color-coded Trend Lines → Blue for bullish, Purple for bearish.
- Shadow Fill Effects → Provides depth and easier visualization of trend direction.
- Alert Conditions → Prebuilt alerts for both Long and Short scenarios.
Specifications :
Weighted Moving Average (WMA)
The WMA assigns more weight to recent price values, making it more responsive than a Simple Moving Average (SMA). This enhances early detection of market turns while reducing lag compared to longer-term averages.
Triple Exponential Moving Average (TEMA)
TEMA is designed to minimize lag by combining multiple EMA layers (EMA of EMA of EMA). It is smoother and more adaptive than traditional EMAs, making it ideal for detecting true market direction without overreacting to small fluctuations.
Multi-Length Averaging
By calculating two versions of WMA → TEMA with different lengths and then averaging them, the indicator balances responsiveness (short-term sensitivity) and reliability (long-term confirmation). This prevents whipsawing while keeping signals timely.
Adaptive Signal Assignment
Instead of simply flipping signals at crossovers, the indicator checks slope direction of TEWMA. This ensures smoother trend-following behavior, reducing false positives in sideways conditions.
Color-Coding & Visual Shading
Visual clarity is achieved by coloring bullish periods differently from bearish ones, with shaded fills beneath each line. This allows traders to instantly identify trend conditions and compare short- vs long-term signals.
Alert Conditions
Trading decisions can be automated by attaching alerts to the TEWMA’s bullish and bearish states. This makes it practical for active trading, swing setups, or algorithmic strategies.
Enjoy!
TEWMA Supertrend - [JTCAPITAL]TEWMA Supertrend - is a modified way to use Triple Exponential Weighted Moving Average (TEWMA) combined with ATR-based Supertrend logic for Trend-Following.
The idea behind this indicator is to merge the smoothness and responsiveness of TEWMA with the robustness of ATR-based Supertrend volatility filtering. This results in a tool that not only reacts quickly to price changes but also adapts to market volatility, providing reliable trend detection with reduced noise.
The indicator works by calculating in the following steps:
Source Selection
The user can select the price source (default is Close). This price series is the foundation of all calculations, and changing the source allows the indicator to adapt to different analytical perspectives, such as Open, High, Low, or HL2.
TEWMA Calculation
The script calculates a Weighted Moving Average (WMA) of the selected source, and then applies a Triple Exponential Moving Average (TEMA) smoothing on top of it. The result is what we call TEWMA. This hybrid method achieves two goals simultaneously:
-WMA adds sensitivity by giving more weight to recent data.
-TEMA reduces lag by combining multiple EMA calculations while keeping smoothness.
ATR Volatility Measurement
In parallel, the Average True Range (ATR) is calculated over the user-defined Supertrend length . ATR measures volatility and dynamically scales the upper and lower bands to adjust to different market conditions.
Upper and Lower Band Construction
The indicator builds two envelopes around the TEWMA:
- Upper Band = TEWMA + (Multiplier × ATR)
- Lower Band = TEWMA – (Multiplier × ATR)
These bands expand and contract depending on volatility, creating a dynamic channel.
Band Adjustment Logic
To prevent false flips, the current upper/lower band values are compared to their previous values. If price has not broken above or below the prior band, the bands “stick” to their previous values, thereby filtering noise and avoiding unnecessary trend changes.
Trend Detection
-If price closes above the adjusted upper band, the direction is bullish.
-If price closes below the adjusted lower band, the direction is bearish.
-Otherwise, the trend direction continues from its prior state.
The Trend line is then set to either the upper band (bearish) or lower band (bullish).
Visual Representation
-The TEWMA line itself is plotted and color-coded (blue for bullish, purple for bearish).
-The active Supertrend line is plotted depending on trend direction.
-Shaded regions are added around the lines for enhanced clarity, visually separating bullish and bearish phases.
Buy and Sell Conditions :
- Buy Signal : Triggered when price closes above the Supertrend line, confirming a bullish shift.
- Sell Signal : Triggered when price closes below the Supertrend line, confirming a bearish shift.
Features and Parameters :
- TEWMA Source – Select the input price (Close, Open, High, Low, etc.).
- TEWMA Length – Defines the lookback for the Weighted MA and subsequent TEMA smoothing.
- Supertrend Length – Defines the ATR period used for volatility measurement.
- Multiplier – Determines how far the Supertrend bands are placed from the TEWMA. Higher values mean wider bands and fewer trend flips, while lower values mean tighter bands and more frequent signals.
Specifications :
Weighted Moving Average (WMA)
The WMA gives more importance to recent price points while still considering past values. This makes it more responsive to recent moves than a Simple Moving Average (SMA).
Triple Exponential Moving Average (TEMA)
TEMA reduces lag by combining multiple layers of EMA calculations. Unlike a simple EMA, which can be slow to react, TEMA anticipates changes faster, while still maintaining smoothness to avoid false signals.
TEWMA (TEMA of WMA)
By applying TEMA on top of WMA, we create a hybrid smoothing technique. This retains the responsiveness of WMA but reduces its lag via TEMA’s structure. The result is a highly adaptive moving average, ideal for fast trend detection.
Average True Range (ATR)
ATR measures the degree of volatility by looking at the full trading range of each candle. It ensures that the Supertrend bands expand in volatile markets and contract in calm markets, keeping signals relevant to current conditions.
Supertrend Bands
The upper and lower envelopes built around TEWMA act as dynamic support and resistance. Their adaptive nature reduces false trend shifts during choppy sideways markets.
Band Adjustment Logic
Instead of recalculating bands every candle, the script uses a memory mechanism (previous values) to prevent unnecessary trend switches. This stabilizes the indicator and avoids excessive noise.
Trend Line
The final output is a line that follows price in trending phases while holding steady during consolidations. Its placement above or below price clearly signals bullish or bearish market structure.
Color Coding and Visuals
The use of shaded fills and line coloring enhances readability. Traders can quickly distinguish trend direction and momentum without deep numerical analysis.
Enjoy!

Initial Balance SMC-V3
Initial Balance SMC-V3 – An Advanced Mean Reversion Indicator for Index Markets
The Initial Balance SMC-V3 indicator is the result of continuous refinement in mean reversion trading, with a specific focus on index markets (such as DAX, NASDAQ, S&P 500, etc.). Designed for high-liquidity environments with controlled volatility, it excels at precisely identifying value zones and statistical reversal points within market structure.
🔁 Mean Reversion at Its Core
At the heart of this indicator lies a robust mean reversion logic: rather than chasing extreme breakouts, it seeks returns toward equilibrium levels after impulsive moves. This makes it especially effective in ranging markets or corrective phases within broader trends—situations where many traders get caught in false breakouts.
🎯 Signals Require Breakout + Confirmation
Signals are never generated impulsively. Instead, they require a clear sequence of confirmations:
Break of a key level (e.g., Initial Balance high/low or an SMC zone);
Price re-entry into the range accompanied by a crossover of customizable moving averages (SMA, EMA, HULL, TEMA, etc.);
RSI filter to avoid entries in overbought/oversold extremes;
Volatility filter (ATR) to skip low-volatility, choppy conditions.
This multi-layered approach drastically reduces false signals and significantly improves trade quality.
📊 Built-in Multi-Timeframe Analysis
The indicator features native multi-timeframe logic:
H1 / 15-minute charts: for structural analysis and identification of Supply & Demand zones (SMC);
M1 / M5 charts: for precise trade execution, with targeted entries and dynamic risk management.
SMC zones are calculated on higher timeframes (e.g., 4H) to ensure structural reliability, while actual trade signals trigger on lower timeframes for maximum precision.
⚙️ Advanced Customization
Full choice of moving average type (SMA, EMA, WMA, RMA, VWMA, HULL, TEMA, ZLEMA, etc.);
Revenge Trading logic: after a stop loss is hit without reaching the 1:1 breakeven level, the indicator automatically prepares for a counter-trade;
Dynamic ATR-based stop loss with customizable multiplier;
Session filters to trade only during optimal liquidity windows (e.g., European session).
🧠 Who Is It For?
This indicator is ideal for traders who:
Primarily trade indices;
Prefer mean reversion strategies over pure trend-following;
Seek a disciplined, rule-based system with multiple confluence filters;
Use a multi-timeframe approach to separate analysis from execution.
In short: Initial Balance SMC-V3 is more than just an indicator—it’s a complete trading framework for mean reversion on index markets, where every signal emerges from a confluence of statistical, structural, and temporal factors.
Happy trading! 📈

Anchored EMA/VWAP### Anchored EMA/VWAP Indicator
**Description:**
The **Anchored EMA/VWAP Indicator** is a powerful and versatile tool designed for traders seeking to analyze price trends and momentum from a user-defined anchor point in time. Built for TradingView using Pine Script v6, this indicator calculates and displays multiple **Exponential Moving Averages (EMAs)**, **Volume-Weighted Exponential Moving Averages (VWEMAs)**, and a **Volume-Weighted Average Price (VWAP)**, all anchored to a specific date and time chosen by the user. By anchoring these calculations, traders can focus on price action relative to significant market events, such as news releases, earnings reports, or key support/resistance levels.
The indicator supports multi-timeframe (MTF) analysis, allowing users to compute EMAs, VWEMAs, and VWAP on a higher or custom timeframe (e.g., 5-minute, 1-hour, daily) while overlaying the results on the current chart. It also includes customizable cross signals for EMA and VWEMA pairs, marked with distinct shapes (circles, diamonds, squares) to highlight potential trend changes or reversals. These features make the indicator ideal for trend-following, momentum trading, and identifying key price levels across various markets, including stocks, forex, cryptocurrencies, and commodities.
**Key Features:**
- **Anchored Calculations**: EMAs, VWEMAs, and VWAP start calculations from a user-specified anchor time, enabling analysis relative to significant market moments.
- **Multi-Timeframe Support**: Compute indicators on any timeframe (e.g., 60-minute, daily) and display them on the chart’s timeframe for flexible analysis.
- **Customizable EMAs and VWEMAs**: Four EMAs and four VWEMAs with adjustable lengths (default: 9, 21, 50, 100) and colors, with options to show or hide each.
- **Volume-Weighted Metrics**: VWAP and VWEMAs incorporate volume data, providing a more robust representation of market activity compared to standard EMAs.
- **Cross Signals**: Visual markers (circles, diamonds, squares) for crossovers between EMA and VWEMA pairs, with customizable visibility to highlight bullish (up) or bearish (down) signals.
- **User-Friendly Interface**: Organized input groups for General, EMA, VWEMA, VWAP, Arrow Settings, and Cross Visibility, with intuitive inline inputs for length and color customization.
- **Visual Clarity**: Overlaid on the price chart with distinct colors and line styles (dotted for EMAs, dashed for VWEMAs, solid for VWAP) to ensure easy interpretation.
**How to Use:**
1. **Set the Anchor Time**: Click a specific bar or enter a date/time (default: June 1, 2025) to start calculations from a significant market event.
2. **Select Timeframe**: Choose a timeframe (e.g., "5" for 5-minute, "D" for daily) to compute the indicators, allowing alignment with your trading strategy.
3. **Customize EMAs and VWEMAs**: Adjust lengths and colors for up to four EMAs and VWEMAs, and toggle their visibility to focus on relevant lines.
4. **Enable VWAP**: Display the anchored VWAP to identify volume-weighted price levels, useful as dynamic support/resistance.
5. **Monitor Cross Signals**: Enable cross visibility for specific EMA or VWEMA pairs to spot potential trend changes. Bullish crosses (e.g., shorter EMA crossing above longer EMA) are marked with green shapes below the bar, while bearish crosses are marked with red shapes above the bar.
6. **Interpret Signals**: Use EMA/VWEMA crossovers for trend confirmation, VWAP as a mean-reversion level, and volume-weighted VWEMAs for momentum analysis in high-volume markets.
**Use Cases:**
- **Trend Trading**: Identify trend direction using EMA and VWEMA crossovers, with shorter lengths (e.g., 9, 21) for faster signals and longer lengths (e.g., 50, 100) for trend confirmation.
- **Mean Reversion**: Use the anchored VWAP as a dynamic support/resistance level to trade pullbacks or breakouts.
- **Event-Based Analysis**: Anchor the indicator to significant events (e.g., earnings, economic data releases) to analyze price behavior post-event.
- **Multi-Timeframe Strategies**: Combine higher timeframe EMAs/VWAPs with lower timeframe price action for high-probability setups.
**Settings:**
- **Anchor Time**: Set the starting point for calculations (default: June 1, 2025).
- **Timeframe**: Choose the timeframe for calculations (default: 5-minute).
- **EMA/VWEMA Lengths**: Default lengths of 9, 21, 50, and 100 for both EMAs and VWEMAs, adjustable per user preference.
- **Colors**: Customizable colors with slight transparency for visual clarity.
- **Cross Visibility**: Toggle specific EMA and VWEMA cross signals (e.g., EMA1/EMA2, VWEMA1/VWEMA3) to reduce chart clutter.
- **Arrow Colors**: Green for bullish crosses, red for bearish crosses.
**Notes:**
- The indicator is overlaid on the price chart, ensuring seamless integration with price action analysis.
- VWEMAs and VWAP are volume-sensitive, making them particularly effective in markets with significant volume fluctuations.
- Ensure the anchor time is set to a valid historical or future bar to avoid calculation errors.
- Cross signals are conditional on non-NA values to prevent false positives during initialization.
**Author**: NEPOLIX
**Version**: 6 (Pine Script v6)
**Published**: For TradingView Community
This indicator is a must-have for traders looking to combine anchored, volume-weighted, and multi-timeframe analysis into a single, customizable tool. Whether you're a day trader, swing trader, or long-term investor, the Anchored EMA/VWAP Indicator provides actionable insights for informed trading decisions.

RSI Signals Multi-Layer RSI System with Classical Divergence**DrFX RSI Signals Fixed** is an advanced RSI-based trading system that combines duration-filtered extreme conditions with classical divergence detection and momentum confirmation. This enhanced version addresses common RSI false signals through multi-layer filtering while adding proper divergence analysis for identifying high-probability reversal points.
**Core Innovation & Originality**
This indicator uniquely integrates five analytical layers:
1. **Duration-Validated Extreme Zones** - Confirms RSI has remained overbought/oversold for minimum bars within lookback period
2. **Classical Divergence Detection** - Proper implementation comparing swing highs/lows in both price and RSI
3. **Momentum Confirmation Signals** - RSI crossing 50-line after extreme conditions for trend confirmation
4. **Multi-Signal Classification** - Four distinct signal types (Buy, Sell, Strong Buy, Strong Sell, Momentum)
5. **Visual Zone Highlighting** - Background coloring for instant extreme zone identification
**Technical Implementation & Improvements**
**Enhanced Duration Filter:**
Unlike the previous version, this system uses a refined approach:
```
for i = 0 to lookback_bars - 1
if rsi > overbought
barsInOverbought := barsInOverbought + 1
```
This counts actual bars within the lookback period (default 20 bars) where RSI was extreme, requiring minimum duration (default 4 bars) for signal validation.
**Classical Divergence Detection:**
The system implements proper divergence analysis, a significant improvement over simple delta comparison:
**Bullish Divergence Logic:**
- Price makes lower low: `low < prevPriceLow`
- RSI makes higher low: `rsi > prevRsiLow`
- Indicates weakening downward momentum despite lower prices
**Bearish Divergence Logic:**
- Price makes higher high: `high > prevPriceHigh`
- RSI makes lower high: `rsi < prevRsiHigh`
- Indicates weakening upward momentum despite higher prices
**Signal Generation Framework:**
**Primary Signals:**
- **Buy Signal**: RSI crosses above oversold (30) after meeting duration requirements
- **Sell Signal**: RSI crosses below overbought (70) after meeting duration requirements
**Strong Signals:**
- **Strong Buy**: Buy signal + bullish divergence confirmation
- **Strong Sell**: Sell signal + bearish divergence confirmation
**Momentum Signals:**
- **Momentum Buy (M+)**: RSI crosses above 50 after recent oversold conditions
- **Momentum Sell (M-)**: RSI crosses below 50 after recent overbought conditions
**What Makes This Version Superior**
**Compared to Standard RSI:**
1. **Duration Requirement**: Prevents signals on brief RSI spikes
2. **Lookback Validation**: Ensures extreme conditions actually occurred recently
3. **Proper Divergence**: Uses swing high/low comparison, not just bar-to-bar deltas
4. **Momentum Layer**: Adds trend confirmation via 50-line crosses
**Compared to Previous Version:**
1. **Pine Script v5**: Modern syntax with improved performance
2. **Configurable Parameters**: All values adjustable via inputs
3. **Better Divergence**: Classical divergence logic replaces simplified delta method
4. **Additional Signals**: Momentum confirmations for trend following
5. **Visual Enhancements**: Background coloring and improved signal differentiation
6. **Alert System**: Built-in alert conditions for all signal types
**Parameter Configuration**
**Customizable Inputs:**
- **Overbought Level** (70): Upper threshold, range 50-90
- **Oversold Level** (30): Lower threshold, range 10-50
- **RSI Period** (14): Calculation period, range 2-50
- **Minimum Duration** (4): Required bars in extreme zone, range 1-20
- **Lookback Bars** (20): Period to check for extreme conditions, range 5-100
- **Divergence Lookback** (5): Period for divergence swing comparison, range 2-20
**Optimization Guidelines:**
- **Shorter Duration** (2-3): More frequent signals, higher noise
- **Longer Duration** (5-7): Fewer signals, better quality
- **Smaller Lookback** (10-15): Faster response, may miss context
- **Larger Lookback** (30-50): More context, potentially delayed signals
**Signal Interpretation Guide**
**Visual Signal Hierarchy:**
**Light Green Triangle (Buy):**
- RSI recovered from oversold
- Duration requirements met
- Entry on reversal from oversold territory
**Light Red Triangle (Sell):**
- RSI declined from overbought
- Duration requirements met
- Entry on reversal from overbought territory
**Blue Triangle (Strong Buy):**
- Buy signal with bullish divergence
- Highest probability long setup
- Price made lower low, RSI made higher low
**Magenta Triangle (Strong Sell):**
- Sell signal with bearish divergence
- Highest probability short setup
- Price made higher high, RSI made lower high
**Tiny Green Circle (M+):**
- RSI crossed above 50 after oversold
- Momentum confirmation for uptrend
- Secondary entry or trend confirmation
**Tiny Red Circle (M-):**
- RSI crossed below 50 after overbought
- Momentum confirmation for downtrend
- Secondary entry or trend confirmation
**Background Coloring:**
- **Light Red Background**: RSI > 70 (overbought zone)
- **Light Green Background**: RSI < 30 (oversold zone)
**Trading Strategy Application**
**Conservative Approach (Strong Signals Only):**
1. Wait for blue/magenta triangles (divergence confirmed)
2. Enter on signal bar close or next bar open
3. Stop loss beyond recent swing high/low
4. Target minimum 2:1 risk/reward ratio
**Aggressive Approach (All Signals):**
1. Take light green/red triangles for earlier entries
2. Use momentum circles as confirmation
3. Tighter stops with partial profit taking
4. Scale positions based on signal strength
**Momentum Trading:**
1. Use momentum signals (M+/M-) as trend filters
2. Take primary signals aligned with momentum direction
3. Avoid counter-momentum signals in strong trends
4. Exit when opposing momentum signal appears
**Multi-Timeframe Strategy:**
1. Check higher timeframe for strong signals
2. Execute on lower timeframe primary signals
3. Use momentum signals for position management
4. Align all timeframe signals for best probability
**Optimal Market Conditions**
**Best Performance:**
- Mean-reverting markets with clear RSI extremes
- Range-bound or consolidating conditions
- Markets respecting support/resistance levels
- Timeframes: 15min to 4H for active trading
**Strong Signal Advantages:**
- Divergence signals often mark major turning points
- Work well at market structure levels
- Effective in both trending and ranging markets
- Higher success rate justifies waiting for setup
**Momentum Signal Benefits:**
- Confirms trend direction after extreme readings
- Useful for adding to positions
- Helps avoid counter-trend trades
- Works well in trending markets where reversals fail
**Technical Advantages**
**Divergence Accuracy:**
The improved divergence detection uses proper swing analysis rather than simple bar-to-bar comparison. This identifies genuine momentum shifts where price action diverges from oscillator movement over a meaningful period.
**Duration Logic:**
The for-loop counting method ensures the system checks actual RSI values within the lookback period, not just whether RSI touched levels. This distinguishes between sustained conditions and brief spikes.
**Momentum Filter:**
The 50-line crosses after extreme conditions provide an additional confirmation layer, helping traders distinguish between failed reversals (no momentum follow-through) and sustained moves (momentum confirmation).
**Risk Management Integration**
**Signal Priority:**
1. **Highest**: Strong signals with divergence (blue/magenta triangles)
2. **Medium**: Primary signals without divergence (light green/red triangles)
3. **Confirmation**: Momentum signals (tiny circles)
**Position Sizing:**
- Larger positions on strong signals (divergence present)
- Standard positions on primary signals
- Smaller positions or adds on momentum signals
**Stop Placement:**
- Beyond recent swing structure
- Below/above divergence swing low/high for strong signals
- Trail stops when momentum signals align with position
**Alert System**
Built-in alert conditions for:
- Buy Signal: RSI buy without divergence
- Sell Signal: RSI sell without divergence
- Strong Buy Alert: Buy with bullish divergence
- Strong Sell Alert: Sell with bearish divergence
Configure alerts via TradingView's alert system to receive notifications for chosen signal types.
**Important Considerations**
**Strengths:**
- Multiple confirmation layers reduce false signals
- Classical divergence improves reversal detection
- Momentum signals add trend-following capability
- Highly customizable for different trading styles
- No repainting - all signals fixed at bar close
**Limitations:**
- Duration requirements may cause missed quick reversals
- Divergence lookback period affects sensitivity
- Not suitable as standalone system
- Requires understanding of RSI principles and divergence concepts
**Best Practices:**
- Combine with price action and support/resistance
- Use higher timeframe context for directional bias
- Respect overall market trend and structure
- Implement proper position sizing based on signal type
- Test parameters on your specific instrument and timeframe
**Comparison Summary**
This enhanced version represents a significant upgrade:
- Upgraded to Pine Script v5 modern standards
- Proper classical divergence detection (not simplified)
- Added momentum confirmation signals
- Fully customizable parameters via inputs
- Visual background zone highlighting
- Comprehensive alert system
- Better signal differentiation through color coding
The system transforms basic RSI analysis into a multi-dimensional trading tool suitable for various market conditions and trading styles.
**Disclaimer**: This indicator is designed for educational and analytical purposes. While the multi-layer filtering and classical divergence detection improve upon standard RSI implementations, no indicator guarantees profitable trades. The duration filtering reduces false signals but may delay entries. Divergence signals, while statistically favorable, can fail in strong trending conditions. Always use proper risk management, position sizing, and stop-loss orders. Consider multiple confirmation methods and market context before making trading decisions. Past performance does not guarantee future results.

Support & resistance gapsThis script will draw support and resistance gaps on the price chart.
It is heavily influenced by Nick Drendel . You can learn more about support and resistance gaps and how he draws them in the following video on youtube: The Secret Weapon Traders Ignore: Mastering Unfilled Gaps
The following settings are available:
Untested gaps background color and border color (default gray)
Support gaps background color and border color (default green)
Resistance gaps background color and border color (default red)
Number of days to look back (default one year)
Option to include the current day during market hours (default true)

Strong Body Close Candle (90%)This indicator highlights Strong Body Close Candles, which are single bars where the real body makes up the vast majority of the total range and the close is positioned very close to the candle’s extreme. By default, the script looks for candles where the body is at least 90% of the full high-low range, and the close falls within the top 10% (for bullish) or bottom 10% (for bearish). These settings ensure that only very strong, conviction-driven candles are marked. The script plots labels above or below qualifying bars, colors the candle accordingly, and provides alert conditions so you can be notified in real time when such a candle forms.
Both percentages are fully adjustable so you can fine-tune the strictness of the definition. For example, if you change the body threshold to 85% and the close-to-extreme threshold to 15%, the script will highlight candles where the body makes up at least 85% of the total range and the close is within 15% of the high or low. This adjustment allows for a slightly looser definition, catching more frequent signals while still maintaining strength criteria. Built-in alerts let you choose between bullish and bearish signals separately (or both), ensuring you won’t miss setups even when you’re away from the chart.
This tool is flexible across timeframes and instruments. On lower timeframes, signals may appear more frequently, highlighting intraday momentum bursts, while on higher timeframes such as daily or weekly charts, these signals often represent periods of strong directional conviction. Traders can combine this indicator with additional filters such as trend direction, volume confirmation, VWAP, or moving averages to improve reliability and fit it into their broader strategy. Because the body and close thresholds are user-defined, you have control over whether the indicator is tuned to rare but powerful candles (stricter settings) or more frequent signals (looser settings).
The indicator is designed to be non-repainting since it only evaluates candles after they close. It can be used purely visually with chart labels and bar coloring or as part of an automated workflow with TradingView alerts. Alerts are triggered on bar close whenever a bullish or bearish strong body close candle is detected, allowing you to integrate them into your trading process via pop-ups, emails, mobile notifications, or webhooks. Whether you’re looking for sharp reversals, momentum continuation signals, or simply want to filter out weaker candles, this tool provides a clear and adjustable framework for identifying high-conviction bars.

Tristan's Star: 15m Shooting Star DetectorThis script is designed to be used on the 1-minute chart , but it analyzes the market as if you were watching the 15-minute candles.
Every cluster of 15 one-minute candles is grouped together and treated as a single 15-minute candle.
When that 15-minute “synthetic” candle looks like a shooting star pattern (small body near the low, long upper wick, short lower wick, bearish bias), the script triggers a signal.
At the close of that 15-minute cluster, the script will:
Plot a single “Sell” label on the last 1-minute bar of the group.
Draw a horizontal line across the 15 bars at the high, showing the level that created the shooting star.
Optionally display a table cell in the corner with the word “SELL.”
This lets you stay on the 1-minute timeframe for precision entries and exits, while still being alerted when the higher-timeframe (15-minute) shows a bearish reversal pattern.

Yasser Multiple Inside Bar Breakout SignalsDescription
Yasser Multiple Inside Bar Breakout Signals (Yasser_MIB) is a powerful TradingView indicator designed to detect high-probability breakout setups based on multiple inside bar (MIB) formations. Inside bar breakouts often precede strong market moves, making this tool ideal for traders who rely on price action, volatility compression, and breakout trading strategies.
🔑 Key Features:
✅ Automatic MIB Detection – Identifies and counts consecutive inside bars.
✅ Breakout Signals – Generates BUY/SELL signals upon valid breakout of the mother bar.
✅ Custom Risk:Reward Settings – Adjustable risk-to-reward ratio with built-in Stop Loss (SL) and Take Profit (TP) levels.
✅ ATR-based Stop Loss (Optional) – Dynamic volatility-based risk management.
✅ Trend Filter – Optional EMA filter to trade only in the trend direction.
✅ Visual Clarity – Mother bar levels, inside bar marks, entry/SL/TP lines, and breakout highlights.
✅ Alerts Ready – Receive instant alerts for MIB setups and breakouts.
This indicator is suitable for Forex, Stocks, Indices, Commodities, and Crypto markets across multiple timeframes. Whether you are a trend trader or a breakout trader, Yasser_MIB provides a structured approach to capture explosive market moves with disciplined risk management.
📂 Categories
Indicators
Technical Analysis
Price Action
Breakout Strategies
Risk Management
🏷 Tags
inside bar
multiple inside bar
MIB breakout
price action
mother bar
breakout strategy
trend filter
EMA filter
ATR stop loss
risk reward
forex trading
crypto trading
stocks
commodities
indices
Yasser indicators

Oscillator Matrix [Alpha Extract]A comprehensive multi-oscillator system that combines volume-weighted money flow analysis with enhanced momentum detection, providing traders with a unified framework for identifying high-probability market opportunities across all timeframes. By integrating two powerful oscillators with advanced confluence analysis, this indicator delivers precise entry and exit signals while filtering out market noise through sophisticated threshold-based regime detection.
🔶 Volume-Weighted Money Flow Analysis
Utilizes an advanced money flow calculation that tracks volume-weighted price movements to identify institutional activity and smart money flow. This approach provides superior signal quality by emphasizing high-volume price movements while filtering out low-volume market noise.
// Volume-weighted flows
up_volume = price_up ? volume : 0
down_volume = price_down ? volume : 0
// Money Flow calculation
up_vol_sum = ta.sma(up_volume, mf_length)
down_vol_sum = ta.sma(down_volume, mf_length)
total_volume = up_vol_sum + down_vol_sum
money_flow_ratio = total_volume > 0 ? (up_vol_sum - down_vol_sum) / total_volume : 0
🔶 Enhanced Hyper Wave Oscillator
Features a sophisticated MACD-based momentum oscillator with advanced normalization techniques that adapt to different price ranges and market volatility. The system uses percentage-based calculations to ensure consistent performance across various instruments and timeframes.
// Enhanced MACD-based oscillator
fast_ma = ta.ema(src, hw_fast)
slow_ma = ta.ema(src, hw_slow)
macd_line = fast_ma - slow_ma
signal_line = ta.ema(macd_line, hw_signal)
// Proper normalization using percentage of price
price_base = ta.sma(close, 50)
macd_normalized = macd_line / price_base
hyper_wave = macd_range > 0 ? macd_normalized / macd_range : 0
🔶 Multi-Factor Confluence System
Implements an intelligent confluence scoring mechanism that combines signals from both oscillators to identify high-probability trading opportunities. The system assigns strength scores based on multiple confirmation factors, significantly reducing false signals.
🔶 Fixed Threshold Levels
Uses predefined threshold levels optimized for standard oscillator ranges to distinguish between normal market fluctuations and significant momentum shifts. The dual-threshold system provides clear visual cues for overbought/oversold conditions while maintaining consistent signal criteria across different market conditions.
🔶 Overflow Detection Technology
Advanced overflow indicators identify extreme market conditions that often precede major reversals or continuation patterns. These signals highlight moments when market momentum reaches critical levels, providing early warning for potential turning points.
🔶 Dual Oscillator Integration
The indicator simultaneously tracks volume-weighted money flow and momentum-based price action through two independent oscillators. This dual approach ensures comprehensive market analysis by capturing both institutional activity and technical momentum patterns.
// Multi-factor confluence scoring
confluence_bull = (mf_bullish ? 1 : 0) + (hw_bullish ? 1 : 0) +
(mf_overflow_bull ? 1 : 0) + (hw_overflow_bull ? 1 : 0)
confluence_bear = (mf_bearish ? 1 : 0) + (hw_bearish ? 1 : 0) +
(mf_overflow_bear ? 1 : 0) + (hw_overflow_bear ? 1 : 0)
confluence_strength = confluence_bull > confluence_bear ? confluence_bull / 4 : -confluence_bear / 4
🔶 Intelligent Signal Generation
The system generates two tiers of reversal signals: strong signals that require multiple confirmations across both oscillators, and weak signals that identify early momentum shifts. This hierarchical approach allows traders to adjust position sizing based on signal strength.
🔶 Visual Confluence Zones
Background coloring dynamically adjusts based on confluence strength, creating visual zones that immediately communicate market sentiment. The intensity of background shading corresponds to the strength of the confluent signals, making pattern recognition effortless.
🔶 Threshold Visualization
Color-coded threshold zones provide instant visual feedback about oscillator positions relative to key levels. The fill areas between thresholds create clear overbought and oversold regions with graduated color intensity.
🔶 Candle Color Integration
Optional candle coloring applies confluence-based color logic directly to price bars, creating a unified visual framework that helps traders correlate indicator signals with actual price movements for enhanced decision-making.
🔶 Overflow Alert System
Specialized circular markers highlight extreme overflow conditions on both oscillators, drawing attention to potential climax moves that often precede significant reversals or accelerated trend continuation.
🔶 Customizable Display Options
Comprehensive display controls allow traders to toggle individual components on or off, enabling focused analysis on specific aspects of the indicator. This modularity ensures the indicator adapts to different trading styles and analytical preferences.
1 Week
1 Day
15 Min
This indicator provides a complete analytical framework by combining volume analysis with momentum detection in a single, coherent system. By offering multiple confirmation layers and clear visual hierarchies, it empowers traders to identify high-probability opportunities while maintaining precise risk management across all market conditions and timeframes. The sophisticated confluence system ensures that signals are both timely and reliable, making it an essential tool for serious technical analysts.

Market Pressure Oscillator█ OVERVIEW
The Market Pressure Oscillator is an advanced technical indicator for TradingView, enabling traders to identify potential trend reversals and momentum shifts through candle-based pressure analysis and divergence detection. It combines a smoothed oscillator with moving average signals, overbought/oversold levels, and divergence visualization, enhanced by customizable gradients, dynamic band colors, and alerts for quick decision-making.
█ CONCEPT
The indicator measures buying or selling pressure based on candle body size (open-to-close difference) and direction, with optional smoothing for clarity and divergence detection between price action and the oscillator. It relies solely on candle data, offering insights into trend strength, overbought/oversold conditions, and potential reversals with a customizable visual presentation.
█ WHY USE IT?
- Divergence Detection: Identifies bullish and bearish divergences to reinforce signals, especially near overbought/oversold zones.
- Candle Pressure Analysis: Measures pressure based on candle body size, normalized to a ±100 scale.
- Signal Generation: Provides buy/sell signals via overbought/oversold crossovers, zero-line crossovers, moving average zero-line crossovers, and dynamic band color changes.
- Visual Clarity: Uses dynamic colors, gradients, and fill layers for intuitive chart analysis.
Flexibility: Extensive settings allow customization to individual trading preferences.
█ HOW IT WORKS?
- Candle Pressure Calculation: Computes candle body size as math.abs(close - open), normalized against the average body size over a lookback period (avgBody = ta.sma(body, len)). - Candle direction (bullish: +1, bearish: -1, neutral: 0) is multiplied by body weight to derive pressure.
- Cumulative Pressure: Sums pressure values over the lookback period (Lookback Length) and normalizes to ±100 relative to the maximum possible value.
- Smoothing: Optionally applies EMA (Smoothing Length) to normalized pressure.
- Moving Average: Calculates SMA (Moving Average Length) for trend confirmation (Moving Average (SMA)).
- Divergence Detection: Identifies bullish/bearish divergences by comparing price and oscillator pivot highs/lows within a specified range (Pivot Length). Divergence signals appear with a delay equal to the Pivot Length.
- Signals: Generates signals for:
Crossing oversold upward (buy) or overbought downward (sell).
Crossing the zero line by the oscillator or moving average (buy/sell).
Bullish/bearish divergences, marked with labels, enhancing signals, especially near overbought/oversold zones.
Dynamic band color changes when the moving average crosses MA overbought/oversold thresholds (green for oversold, red for overbought).
- Visualization: Plots the oscillator and moving average with dynamic colors, gradient fills, transparent bands, and labels, with customizable overbought/oversold levels.
Alerts: Built-in alerts for divergences, overbought/oversold crossovers, and zero-line crossovers (oscillator and moving average).
█ SETTINGS AND CUSTOMIZATION
- Lookback Length: Period for aggregating candle pressure (default: 14).
- Smoothing Length (EMA): EMA length for smoothing the oscillator (default: 1). Higher values smooth the signal but may reduce signal frequency; adjust overbought/oversold levels accordingly.
- Moving Average Length (SMA): SMA length for the moving average (default: 14, minval=1). Higher values make SMA a trend indicator, requiring adjusted MA overbought/oversold levels.
- Pivot Length (Left/Right): Candles for detecting pivot highs/lows in divergence calculations (default: 2, minval=1). Higher values reduce noise but add delay equal to the set value.
- Enable Divergence Detection: Enables divergence detection (default: true).
- Overbought/Oversold Levels: Thresholds for the oscillator (default: 30/-30) and moving average (default: 10/-10). For the moving average, no arrows appear; bands change color from gray to green (oversold) or red (overbought), reinforcing entry signals.
- Signal Type: Select signals to display: "None", "Overbought/Oversold", "Zero Line", "MA Zero Line", "All" (default: "Overbought/Oversold").
- Colors and Gradients: Customize colors for bullish/bearish oscillator, moving average, zero line, overbought/oversold levels, and divergence labels.
- Transparency: Adjust gradient fill transparency (default: 70, minval=0, maxval=100) and band/label transparency (default: 40, minval=0, maxval=100) for consistent visuals.
- Visualizations: Enable/disable moving average, gradients for zero/overbought/oversold levels, and gradient fills.
█ USAGE EXAMPLES
- Momentum Analysis: Observe the MPO Oscillator above 0 for bullish momentum or below 0 for bearish momentum. The SMA, being smoother, reacts slower and can confirm trend direction as a noise filter.
- Reversal Signals: Look for buy triangles when the oscillator crosses oversold upward, especially when the SMA is below the MA oversold threshold and the band turns green. Similarly, seek sell triangles when crossing overbought downward, with the SMA above the MA overbought threshold and the band turning red.
- Using Divergences: Treat bullish (green labels) and bearish (red labels) divergences as reinforcement for other signals, especially near overbought/oversold zones, indicating stronger potential trend reversals.
- Customization: Adjust lookback length, smoothing, and moving average length to specific instruments and timeframes to minimize false signals.
█ USER NOTES
Combine the indicator with tools like Fibonacci levels or pivot points to enhance accuracy.
Test different settings for lookback length, smoothing, and moving average length on your chosen instrument and timeframe to find optimal values.

Moon Phases Prediction🌙 Moon Phases (with Next Event Projection)
Introduction
This indicator plots Moon Phases (New Moon and Full Moon) directly on your chart.
In addition to showing historical phases, it also calculates and projects the upcoming next moon phase using precise astronomical formulas.
Features
Marks New Moons with circles above bars.
Marks Full Moons with circles below bars.
Dynamically adjusts background color based on waxing/waning phase.
Calculates and displays the next upcoming moon event as a label positioned in the future.
Works on all timeframes (except Monthly).
How It Works
Uses astronomical approximations (Julian Day → UNIX time conversion).
Detects the last occurred New Moon or Full Moon.
Projects the next moon event by adding half a synodic month (~14.77 days).
Displays the next event label at its exact future date on the chart.
Customization
Waxing Moon color (default: Blue)
Waning Moon color (default: White)
Use Cases
Astro-finance: lunar cycles and market psychology.
Trading strategies: aligning entries/exits with cyclical behavior.
Visualization: adding an extra dimension of timing to chart analysis.
Notes
- The future moon event is displayed as a circle label on the correct date.
- If you cannot see the label, increase your chart’s right margin (Chart Settings → Scales → Right Margin).
- Calculations are approximate but astronomically accurate enough for trading or visual use.
Conclusion
This indicator is a simple yet powerful tool for traders interested in the influence of lunar cycles.
By combining historical phases with a projected next event, you can always be aware of where the market stands in the moon cycle timeline.
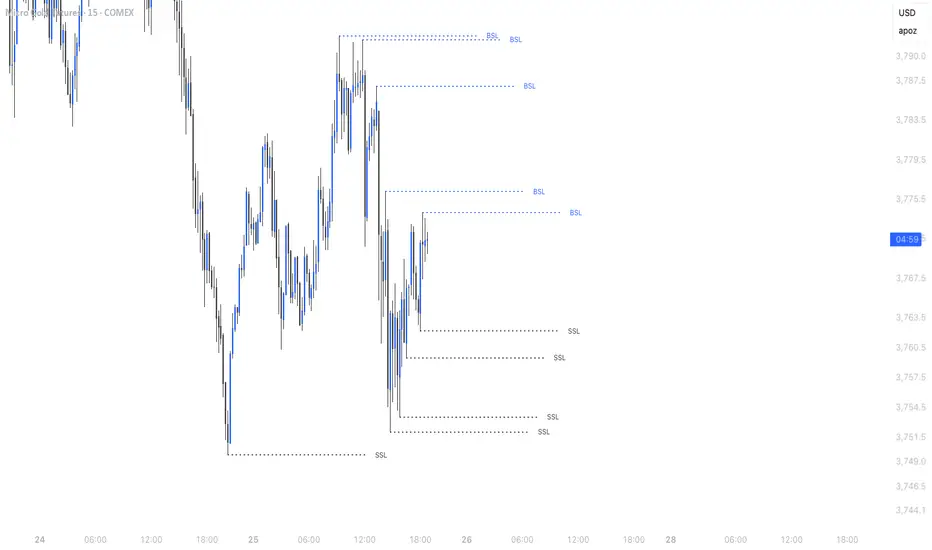
Simple Liquidity Sweep [rare_gold_steak]- Shows when the liquidity was swept.
- Shows BSL and SSL.
- Simple options to change styling.
I use it personally and some people liked it so I thought i'll share it with the public.
CFR - Candle Formation RatioDescription
This indicator is designed to detect candles with small bodies and significant wick-to-body ratios, often useful for identifying doji-like structures and potential accumulation areas.
Features
Filter candles by maximum body size (% of the total candle range).
Require that wicks are at least X times larger than the body.
Define the position of the body within the candle (e.g., body must be between 40% and 60% of the candle height).
Visual output: a single arrow marker when conditions are met.
Fully customizable marker color and size.
⚠️ Note: The settings of this version are currently in Turkish. An English version of the settings will be released in the future.

PongExperience PONG! The classic arcade game, now on your charts!
With this indicator, you can finally achieve your lifelong dream of beating the Markets. . . at PONG!
Pong is jam-packed with features! Such as:
2 Paddles
A moving dot
Floating numbers
The idea of a net
This indicator is solely a visualization, it serves simply as an exercise to depict what is capable through PineScript. It can be used to re-skin other indicators or data, but on its own, is not intended as a market indicator.
With that out of the way...
> PONG
The Pong indicator is a recreation of the classic arcade game Pong developed to pit the markets against the cold hard logic of a CPU player.
Given the lack of interaction that is capable, the game is not played in the typical sense, by a player and computer or 2 players.
This version of Pong uses the chart price movements to control the "Market" Paddle, and it is contrasted by a (not AI) "CPU" Paddle, which is controlled by its own set of logic.
> Market Paddle
The Market Paddle is controlled by a data source which can be input by the user.
By default (Auto Mode), the Market Paddle is controlled through a fixed length Donchian channel range, pinning the range high to 100 and range low to 0. As seen below.
This can be altered to use data from different symbols or indicators, and can optionally be smoothed using multiple types of Moving Averages.
In the chart below, you can see how the RSI indicator is imported and smoothed to control the Market Paddle.
Note: The Market Paddle follows the moving average. If not desired, simply set the "Smoothing" input to "NONE".
> CPU Paddle
In simple terms, the CPU Paddle is a handicapped Aimbot.
Its logic is, more or less, "move directly towards the ball's vertical location".
If it were allowed to have full range of the screen, it would be impossible for it to lose a point. Due to this, we must slow it down to "play fair"... as fair as that may be.
The CPU Paddle is allowed to move at a rate specified by a certain Percent of its vertical width. By default, this is set to 2%.
Each update, the CPU Paddle can advance up or down 2% of its vertical width. The directional movement is determined based on the angle of the ball, and it's current position relative to the CPU Paddle's position. Given that it is not a direct follow, it may at times seem more... "human".
When a point is scored, the CPU paddle maintains its position, similar to the original Pong game, the paddles were controlled solely by the raw output of the controllers and did not reset.
> Ball
At the start of each point, the ball begins at the center of the screen and moves in a randomly determined angle at its base speed.
The direction is determined by the player who scored the last point. The loser of the last point "serves" the ball.
Given the circumstances, serving is a gigantic advantage. So the loser serving is just another place where the Market is given an advantage.
The ball's base speed is 1, it will move 1 (horizontal) bar on each update of the script. This speed can "technically" increase to infinity over time, if given the perfect rally. This is due to the hit logic as described below.
Note: The minimum ball speed is also 1.
> Bonk Math
When the ball hits a paddle, essentially 3 outcomes can occur, each resulting in the ball's direction being changed from positive to negative.
Action A: Its angle is doubled, and its speed is doubled.
Action B: Its angle is reversed, and its speed is decreased if it is going faster than base speed.
Action C: Its angle is preserved, and its speed is preserved. "Basic Bounce"
Each paddle is segmented into 3 zones, with the higher and lower tips (20%) of the paddles producing special actions.
The central 60% of each paddle produces a basic bounce. The special actions are determined by the trajectory of the ball and location on the paddle.
> Custom Mode
As stated above, the script loads in "Auto Mode" by default. While this works fine to simply watch the gameplay, the Custom Mode unlocks the ability to visualize countless possibilities of indicators and analyses playing Pong!
In the chart below, we have set up the game to use the NYSE TICK Index as our Market Player. The NYSE TICK Index shows the number of NYSE stocks trading on an uptick minus those on a downtick. Its values fluctuate throughout the day, typically ranging between +1000 and -1000.
Therefore, we have set up Pong to use Ticker USI:TICK and set the Upper Boundary to 1000 and Lower Boundary to -1000. With this method, the paddle is directly controlled by the overall (NYSE) market behaviors.
As seen in a chart earlier, you can also take advantage of the Custom Mode to overlay Pong onto traditional oscillators for use anywhere!
> Styles
This version of Pong comes stocked with 5 colorways to suit your chart vibes!
> Pro Tips & Additional Information
- This game has sound! For the full experience, set alerts for this indicator and a notification sound will play on each hit!*
*Due to server processing, the notification sounds are not precisely played at each hit. :(
- In auto mode, decreasing the length used will give an advantage to the market, as its actions become more sporadic over this window.
- The CPU logic system actually allows the market to have a "technical" edge, since the Market Paddle is not bound to any speed, and is solely controlled by the raw market movements/data input.
- This type of visualization only works on live charts, charts without updates will not see any movement.
- Indicator sources can only be imported from other indicators on the same chart.
- The base screen resolution is 159 bars wide, with the height determined by the boundaries.
- When using a symbol and an outside source, be mindful that the script is attempting to pull the source from the input symbol. Data can appear wonky when not considering the interactions of these inputs.
There are many small interesting details that can't be seen through the description. For example, the mid-line is made from a box. This is because a line object would not appear on top of the box used for the screen. For those keen eye'd coders, feel free to poke around in the source code to make the game truly custom.
Just remember:
The market may never be fair, but now at least it can play Pong!
Enjoy!

BOCS AdaptiveBOCS Adaptive Strategy - Automated Volatility Breakout System
WHAT THIS STRATEGY DOES:
This is an automated trading strategy that detects consolidation patterns through volatility analysis and executes trades when price breaks out of these channels. Take-profit and stop-loss levels are calculated dynamically using Average True Range (ATR) to adapt to current market volatility. The strategy closes positions partially at the first profit target and exits the remainder at the second target or stop loss.
TECHNICAL METHODOLOGY:
Price Normalization Process:
The strategy begins by normalizing price to create a consistent measurement scale. It calculates the highest high and lowest low over a user-defined lookback period (default 100 bars). The current close price is then normalized using the formula: (close - lowest_low) / (highest_high - lowest_low). This produces values between 0 and 1, allowing volatility analysis to work consistently across different instruments and price levels.
Volatility Detection:
A 14-period standard deviation is applied to the normalized price series. Standard deviation measures how much prices deviate from their average - higher values indicate volatility expansion, lower values indicate consolidation. The strategy uses ta.highestbars() and ta.lowestbars() functions to track when volatility reaches peaks and troughs over the detection length period (default 14 bars).
Channel Formation Logic:
When volatility crosses from a high level to a low level, this signals the beginning of a consolidation phase. The strategy records this moment using ta.crossover(upper, lower) and begins tracking the highest and lowest prices during the consolidation. These become the channel boundaries. The duration between the crossover and current bar must exceed 10 bars minimum to avoid false channels from brief volatility spikes. Channels are drawn using box objects with the recorded high/low boundaries.
Breakout Signal Generation:
Two detection modes are available:
Strong Closes Mode (default): Breakout occurs when the candle body midpoint math.avg(close, open) exceeds the channel boundary. This filters out wick-only breaks.
Any Touch Mode: Breakout occurs when the close price exceeds the boundary.
When price closes above the upper channel boundary, a bullish breakout signal generates. When price closes below the lower boundary, a bearish breakout signal generates. The channel is then removed from the chart.
ATR-Based Risk Management:
The strategy uses request.security() to fetch ATR values from a specified timeframe, which can differ from the chart timeframe. For example, on a 5-minute chart, you can use 1-minute ATR for more responsive calculations. The ATR is calculated using ta.atr(length) with a user-defined period (default 14).
Exit levels are calculated at the moment of breakout:
Long Entry Price = Upper channel boundary
Long TP1 = Entry + (ATR × TP1 Multiplier)
Long TP2 = Entry + (ATR × TP2 Multiplier)
Long SL = Entry - (ATR × SL Multiplier)
For short trades, the calculation inverts:
Short Entry Price = Lower channel boundary
Short TP1 = Entry - (ATR × TP1 Multiplier)
Short TP2 = Entry - (ATR × TP2 Multiplier)
Short SL = Entry + (ATR × SL Multiplier)
Trade Execution Logic:
When a breakout occurs, the strategy checks if trading hours filter is satisfied (if enabled) and if position size equals zero (no existing position). If volume confirmation is enabled, it also verifies that current volume exceeds 1.2 times the 20-period simple moving average.
If all conditions are met:
strategy.entry() opens a position using the user-defined number of contracts
strategy.exit() immediately places a stop loss order
The code monitors price against TP1 and TP2 levels on each bar
When price reaches TP1, strategy.close() closes the specified number of contracts (e.g., if you enter with 3 contracts and set TP1 close to 1, it closes 1 contract). When price reaches TP2, it closes all remaining contracts. If stop loss is hit first, the entire position exits via the strategy.exit() order.
Volume Analysis System:
The strategy uses ta.requestUpAndDownVolume(timeframe) to fetch up volume, down volume, and volume delta from a specified timeframe. Three display modes are available:
Volume Mode: Shows total volume as bars scaled relative to the 20-period average
Comparison Mode: Shows up volume and down volume as separate bars above/below the channel midline
Delta Mode: Shows net volume delta (up volume - down volume) as bars, positive values above midline, negative below
The volume confirmation logic compares breakout bar volume to the 20-period SMA. If volume ÷ average > 1.2, the breakout is classified as "confirmed." When volume confirmation is enabled in settings, only confirmed breakouts generate trades.
INPUT PARAMETERS:
Strategy Settings:
Number of Contracts: Fixed quantity to trade per signal (1-1000)
Require Volume Confirmation: Toggle to only trade signals with volume >120% of average
TP1 Close Contracts: Exact number of contracts to close at first target (1-1000)
Use Trading Hours Filter: Toggle to restrict trading to specified session
Trading Hours: Session input in HHMM-HHMM format (e.g., "0930-1600")
Main Settings:
Normalization Length: Lookback bars for high/low calculation (1-500, default 100)
Box Detection Length: Period for volatility peak/trough detection (1-100, default 14)
Strong Closes Only: Toggle between body midpoint vs close price for breakout detection
Nested Channels: Allow multiple overlapping channels vs single channel at a time
ATR TP/SL Settings:
ATR Timeframe: Source timeframe for ATR calculation (1, 5, 15, 60, etc.)
ATR Length: Smoothing period for ATR (1-100, default 14)
Take Profit 1 Multiplier: Distance from entry as multiple of ATR (0.1-10.0, default 2.0)
Take Profit 2 Multiplier: Distance from entry as multiple of ATR (0.1-10.0, default 3.0)
Stop Loss Multiplier: Distance from entry as multiple of ATR (0.1-10.0, default 1.0)
Enable Take Profit 2: Toggle second profit target on/off
VISUAL INDICATORS:
Channel boxes with semi-transparent fill showing consolidation zones
Green/red colored zones at channel boundaries indicating breakout areas
Volume bars displayed within channels using selected mode
TP/SL lines with labels showing both price level and distance in points
Entry signals marked with up/down triangles at breakout price
Strategy status table showing position, contracts, P&L, ATR values, and volume confirmation status
HOW TO USE:
For 2-Minute Scalping:
Set ATR Timeframe to "1" (1-minute), ATR Length to 12, TP1 Multiplier to 2.0, TP2 Multiplier to 3.0, SL Multiplier to 1.5. Enable volume confirmation and strong closes only. Use trading hours filter to avoid low-volume periods.
For 5-15 Minute Day Trading:
Set ATR Timeframe to match chart or use 5-minute, ATR Length to 14, TP1 Multiplier to 2.0, TP2 Multiplier to 3.5, SL Multiplier to 1.2. Volume confirmation recommended but optional.
For Hourly+ Swing Trading:
Set ATR Timeframe to 15-30 minute, ATR Length to 14-21, TP1 Multiplier to 2.5, TP2 Multiplier to 4.0, SL Multiplier to 1.5. Volume confirmation optional, nested channels can be enabled for multiple setups.
BACKTEST CONSIDERATIONS:
Strategy performs best during trending or volatility expansion phases
Consolidation-heavy or choppy markets produce more false signals
Shorter timeframes require wider stop loss multipliers due to noise
Commission and slippage significantly impact performance on sub-5-minute charts
Volume confirmation generally improves win rate but reduces trade frequency
ATR multipliers should be optimized for specific instrument characteristics
COMPATIBLE MARKETS:
Works on any instrument with price and volume data including forex pairs, stock indices, individual stocks, cryptocurrency, commodities, and futures contracts. Requires TradingView data feed that includes volume for volume confirmation features to function.
KNOWN LIMITATIONS:
Stop losses execute via strategy.exit() and may not fill at exact levels during gaps or extreme volatility
request.security() on lower timeframes requires higher-tier TradingView subscription
False breakouts inherent to breakout strategies cannot be completely eliminated
Performance varies significantly based on market regime (trending vs ranging)
Partial closing logic requires sufficient position size relative to TP1 close contracts setting
RISK DISCLOSURE:
Trading involves substantial risk of loss. Past performance of this or any strategy does not guarantee future results. This strategy is provided for educational purposes and automated backtesting. Thoroughly test on historical data and paper trade before risking real capital. Market conditions change and strategies that worked historically may fail in the future. Use appropriate position sizing and never risk more than you can afford to lose. Consider consulting a licensed financial advisor before making trading decisions.
ACKNOWLEDGMENT & CREDITS:
This strategy is built upon the channel detection methodology created by AlgoAlpha in the "Smart Money Breakout Channels" indicator. Full credit and appreciation to AlgoAlpha for pioneering the normalized volatility approach to identifying consolidation patterns and sharing this innovative technique with the TradingView community. The enhancements added to the original concept include automated trade execution, multi-timeframe ATR-based risk management, partial position closing by contract count, volume confirmation filtering, and real-time position monitoring.
