LONG/SHORT PIFRO que esse indicador faz?
Esse indicador tem o objetivo de plotar o valor de Premium Index e Funding Rate de qualquer token que seja negociado nos futuros da Binance. Basta acessar o token, por exemplo "BTCUSDT" ou "BTCUSDT.P" e o indicador funcionará de forma automática.
A ideia de leitura desse indicador é verificar as maiores oscilações e aliar a analise técnica para tomar uma decisão de compra ou venda.
What does this indicator do?
This indicator aims to plot the Premium Index and Funding Rate value of any token that is traded on Binance futures. Just access the token, for example "BTCUSDT" or "BTCUSDT.P" and the indicator will work automatically.
The idea of reading this indicator is to check the biggest fluctuations and combine technical analysis to make a buy or sell decision.
=============
O que é o Índice Bitcoin Premium?
O índice Bitcoin Premium rastreia o prêmio ou desconto dos contratos perpétuos de Bitcoin em relação ao preço do índice à vista por minuto. O Índice de prêmio é baseado na diferença de preço entre o último preço negociado de um contrato perpétuo e o preço do índice à vista. O preço do índice à vista é um índice à vista ponderado pelo volume, o que significa um preço médio obtido em várias bolsas.
Basicamente, ele mostra para cada criptomoeda se o mercado à vista está negociando acima ou abaixo do contrato perpétuo. O valor pode ser superior, inferior ou igual a 0. Quando o valor está acima de 0, o contrato perpétuo está sendo negociado acima do “preço de referência”, quando o valor está abaixo de 0, o índice à vista está negociando acima do contrato perpétuo .
Como ler o índice premium do Bitcoin?
Existem várias maneiras de visualizar o Índice Bitcoin Premium. Você pode observar o valor (acima ou abaixo de 0) semelhante às taxas de financiamento ou pode observar certos extremos. Esta informação pode ser muito útil na sua estratégia de negociação. O gráfico é exibido como um gráfico de velas com um corpo e o pavio (também conhecido como sombra) da vela. O pavio pode mostrar um certo extremo, enquanto o fechamento da vela mostra o valor.
O valor acima ou abaixo de 0 mostra se o preço dos contratos perpétuos de Bitcoin está sendo negociado acima ou abaixo do índice à vista. Quando o índice à vista está sendo negociado em alta, o prêmio cai abaixo de 0 e fica negativo, geralmente, isso é conhecido como um sinal de alta. Quando o valor está sendo negociado acima de 0 e fica positivo, significa que o contrato perpétuo do Bitcoin está sendo negociado acima do índice à vista, geralmente isso é visto como um sinal de baixa.
Os mercados são um reflexo das emoções humanas e muitas vezes, antes que o preço possa mudar, vemos um certo extremo nas emoções. Esse extremo pode ser identificado no Índice Premium. Quando temos um sinal extremo no Índice Bitcoin Premium as chances de uma reversão aumentam. Esta pode ser uma reversão de curto prazo ou uma reversão maior.
Resumindo, um prêmio de índice à vista é geralmente de alta e um prêmio de derivativos é geralmente um sinal de baixa.
Mas, tal como acontece com as taxas de financiamento, por vezes demora um pouco para que essa pressão de compra ou venda seja expressa no preço e, portanto, é sempre importante combinar esta métrica com outras métricas, como a estrutura de preços.
Por exemplo, aqui na imagem abaixo podemos ver uma leitura extrema no índice premium do Bitcoin. Embora várias horas após o evento ainda vejamos a subida do preço, vemos que está bastante perto de uma reversão e, eventualmente, o preço muda.
Descrição por whaleportal
What is the Bitcoin Premium Index?
The Bitcoin Premium index tracks the premium or discount of Bitcoin perpetual contracts relative to the spot index price per minute. The premium Index is based on the difference in price between the last traded price of a perpetual contract and the spot index price. The spot index price is a volume- weighted spot index, which means an average price taken from multiple exchanges.
Basically, it shows you for each cryptocurrency whether the spot market is trading higher or lower than the perpetual contract. The value can either be above, below, or equal to 0. When the value is above 0, the perpetual contract is trading higher than the “mark price”, when the value is below 0 the spot index is trading higher than the perpetual contract.
How to read the Bitcoin premium index?
There are multiple ways to view the Bitcoin Premium Index. You can either look at the value (above or below 0) similar to the funding rates or you can look at certain extremes. This information can be very helpful in your trading strategy. The chart is displayed as a candlestick chart with a body and the wick (also known as shadow) of the candle. The wick can show a certain extreme, while the close of the candle shows the value.
The value, either above or below 0 shows whether the price of Bitcoin perpetual contracts is trading higher or lower than the spot index. When the spot index is trading higher, the premium will go below 0 and turns negative, usually, this is known to be a bullish sign. When the value is trading higher than 0 and turns positive, it means the Bitcoin perpetual contract is trading higher than the spot index, usually, this is seen as a bearish signal.
The markets are a reflection of human emotions and often before the price can shift we are seeing a certain extreme in emotions. That extreme can be spotted in the Premium Index. When we have an extreme signal in the Bitcoin Premium Index the chances of a reversal increase. This can be either a short-term reversal or a bigger reversal.
In short, a spot index premium is usually bullish and a derivatives premium is usually a bearish signal.
But as with funding rates, it sometimes takes a moment for that buying or selling pressure to be expressed in the price and therefore it is always important to combine this metric with other metrics like the price structure.
For example, here in the image below we can see an extreme reading in the premium index on Bitcoin. Although in several hours after the event we still see the price climb, we do see that it’s rather close to a reversal and eventually the price turns around.
Description by whaleportal
Altcoins

Altcoin ManagerThe Altcoin Manager is a comprehensive script for identifying the current altcoin narrative by tracking and analyzing of a wide array of altcoins across various blockchain layers and categories, such as DeFi, GameFi, AI, and Meme coins. Ideal for traders looking to get a broad yet detailed view of the altcoin market, covering various sectors and chains.
The Key Features:
Versatile Asset Tracking:
Tracks 40 different cryptocurrencies (as of publishing) across different categories, allowing for a diversified and detailed analysis of the altcoin market.
Customizable Assets and Category Analysis:
Select 20 of your own coins across 4 different categories such as DeFi, GameFi, AI, and Meme coins as well as specifying their individual chains.
Dynamic Layer and Chain Analysis:
Includes options to plot and analyze specific blockchain layers and chains such as Ethereum Chain, Solana Chain, BNB Smart Chain, Arbitrum Chain, and Polygon Chain. The script associates various assets with specific blockchains, providing a clearer picture of how different segments of the altcoin market are performing.
Cumulative and Per-Candle Change:
Switch between viewing the total cumulative change since a set start date or the per-candle change, offering flexibility in analyzing price movements over different timeframes.
Denomination Adjustment:
Includes a functionality to denominate asset prices in other currencies or crypto such as BTC, allowing for a more tailored financial analysis according to your preference.
Moving Averages for Categories and Chains:
Calculates and plots moving averages for each category and chain, aiding in the identification of trends over the selected moving average length.
How do I use it?
This script is not used with any particular chart. Instead, assign it it's own tab and layout.
For a clearer analysis, use multiple different panels to track Categories and Chains separately, both Cumulative for a longer term analysis and Per-Candle to find ongoing breakouts and changes in trend.
You can either use the pre-selected altcoins to represent the market, or you can select your own.
The Layer 1 and Layer 2 are not customizable but consists of 15 popular Layer 1 incl Bitcoin, Ethereum, Solana etc. Layer 2 consists of 5 popular Layer 2.

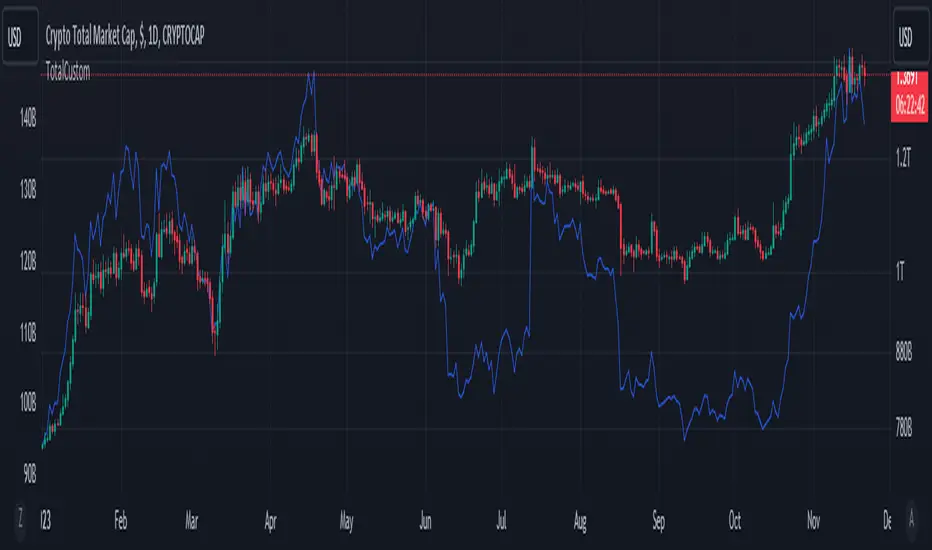
TotalCustomTotalCustom sums our custom altcoin list's market caps together.
Primarily used to compare to the following:
A. price of bitcoin
B. Total 1, Total 2, Total 3
Used in the following way:
When there is a large gap on fixed time frames (i.e. 3 month, 6 month, YTD) between this indicator and the main comparisons, it is generally considered a good time to buy.
TTP Alt HedgeAlt hedge is a pine script that allows you to backtest and live hedge trade alt coin pairs.
Once you have selected 20 alt coins and your preferred take profit and a stop loss settings the script will find pairs: one coin that is very overbought and one that is very oversold. It will then long the one in discount and short the premium one.
The script will show you the PNL of the hedge combined position. If together they reach the TP or SL the position will be closed.
Use the "max profit retracement" to target larger TP levels and lock in profits if they retrace more than the chosen ratio. Example: if the TP retraces more than the golden ratio of 0.618 then close the position.
The indicator offers a table of profits with overall PNL and win rate stats.
It can be hooked up to WickHunter bots using alerts and the UUID of the bot.
Debug alerts shows the messages that will be sent for entry/exit deal messages.
Plot PNL shows the cumulative PNL in percentage in the same chart. This function is particularly useful since it shows the performance of the bot.
Each deal in this bot can consist of any pair of coins provided by the user. For example: long ADA + short ETH when ADA is very expensive and ETH is very cheap.
Consider using alt coins that have either strong or vey low correlation, the closer to 1 or -1 in correlation coefficient the better.
Have fun!

Crypto Performance Index1. The Crypto Performance Index (CPI) estimates the price appreciation of a crypto asset relative to the overall crypto market performance. The indicator is calculated using a Sharpe Ratio principle enhanced with time-domain normalization and cumulative parametrization.
2. The CPI is based on the idea that the performance of an asset should be evaluated not only in terms of its absolute price movement, but also in terms of its risk-adjusted returns compared to the broader market. The Sharpe Ratio, which takes into account both the asset's return and its volatility, is a commonly used measure of risk-adjusted performance.
3. The CPI takes the Sharpe Ratio principle further by incorporating a time-domain normalization technique that adjusts for differences in volatility across different time periods. The cumulative parametrization ensures that the CPI considers the overall performance of the asset over a specified period of time.
4. To use the indicator, select a timeframe and set the standard deviation period (default is 20). The CPI line can be compared against various market benchmarks, including the total crypto market cap (white line), altcoins total market cap (blue line), low-cap altcoins (without ETH), and Bitcoin.
5. An upward slope of the CPI line indicates strong price performance of an asset, with a relatively high chance for the asset to continue growing faster than the market in the future. Conversely, a downward slope of the CPI line indicates weak price performance of an asset, with a relatively high chance for the asset to depreciate in price with respect to the rest of the market in the future.
6. Overall, the CPI provides a comprehensive measure of an asset's price performance, taking into account both its absolute return and its risk-adjusted return relative to the broader market. This makes it a valuable tool for investors looking to evaluate the performance of their crypto holdings and make informed decisions about buying, selling, or holding assets.

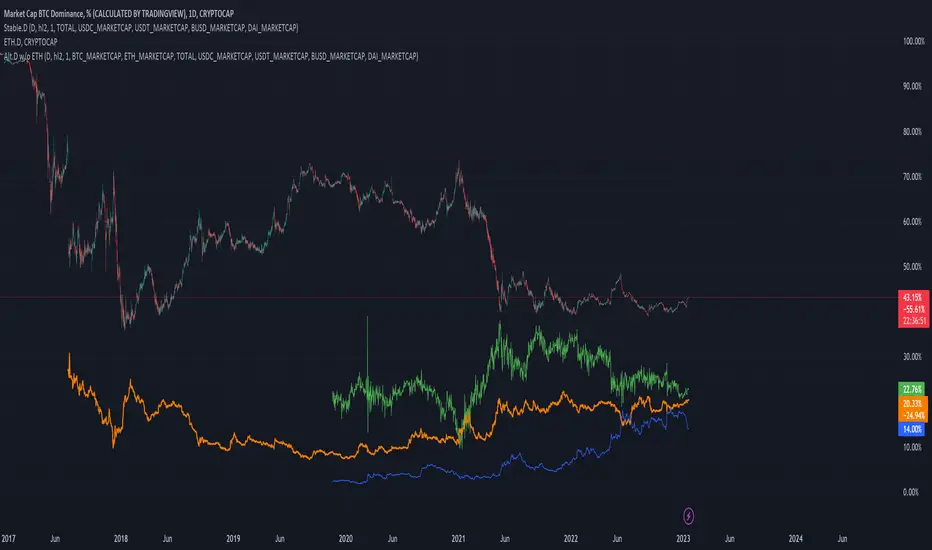
Degen Dominator - (Crypto Dominance Tool) - [mutantdog]A fairly simple one this time. Another crypto dominance tool, consider it a sequel to Dominion if you will. Ready to go out-of-the-box with a selection of presets at hand.
The premise is straightforward, rather than viewing the various marketcap dominance indexes as their standard percentage values, here we have them represented as basic oscillators. This allows for multiple indexes to be viewed in one pane and gives a decent overview of their relative changes and thus the flow of capital within the overall crypto market. As a general rule-of-thumb, when a plot is above zero then the dominance is climbing, thus capital is likely flowing in that direction. The inverse applies when below zero. When the market is quiet, all will be close to zero. Basic overbought/oversold conditions can also be inferred too.
Active as default are:
Bitcoin (0range): CRYPTOCAP:BTC.D
Ethereum (Blue): CRYPTOCAP:ETH.D
Stablecoins (Red): CRYPTOCAP:USDT.D + CRYPTOCAP:USDC.D
Altcoins (Green): 100 - (all of the above)
These are plotted according to the selected oscillator preset and it's length parameter. The default is set to 'EMA Centre'. An optional RMA(3) smoothing filter is also included and active as default. Each index plot has its own colour and opacity settings available on the main page.
Additionally, the following are also available (deactivated as default):
Total DeFi : CRYPTOCAP:TOTALDEFI.D
Current Symbol : Will try to match corresponding dominance index for the chart symbol if available.
Custom Input : Manual text input, will try to match if available.
-------------
The included presets determine the oscillator type used, all are fairly simple and easy to interpret:
EMA Centre
SMA Centre
Median Centre
Midrange Centre
The first 4 are all variations on the same theme, simply calculated as the difference between the actual value and its respective average. EMA is the default and is my personal preference, if you generally favour using an SMA then perhaps that would be your better choice. Like the two MAs, median and midrange are also dependant on the length parameter. Midrange is calculated from the difference between highest and lowest values within the length period, with a little extra smoothing from an RMA(3).
Simple Delta
Weighted Delta
Running Delta
Often referred to as momentum, delta is just change over time. 'Simple' is the most basic of these, the difference between the current value and the value (length) bars prior. A more long-winded way of calculating this would be to take the difference between each bar and its previous then average them with an SMA which results in the same value. 'Weighted' adopts that principle but instead uses a WMA, likewise 'Running' is the same but using an RMA. The latter is actually the basis of RSI calculations before any normalisation is applied, as you can see in the next preset.
RSI
CMO
RSI really should not need explaining, it is however applied a little differently here to the usual, in this case centred around 0. The x100 multiplication factor has been dropped too for the sake of consistency. The same principle applies with CMO, which is basically a 'Simple Delta' version of RSI.
Hard Floor
Soft Floor
These last two are a little different but both can provide useful interpretations. The floor here is simply the lowest value within the chosen length period. 'Hard' plots the difference between the current value and the floor, thus giving a value that is always above 0. In this case, focus should be given to the relative heights of each with a simple interpretation that capital is flowing into those that are climbing and out of those descending. 'Soft' is essentially the same except that the floor is smoothed with an RMA(3), the result being that when new lows are made, the plot will break below 0 before the floor corrects a few bars later. This soft break provides additional information to that given by 'Hard' so is probably the more useful of the two.
------------
To finish it off, a bunch of preset alerts are included for the various 0 crossings.
So that just about covers everything then, all quite straightforward really. Future updates may include some extra stuff, the composition of the stablecoin index may change if necessary too. While this is not really a tweaker's tool like some of my other projects, there's still some room for experimentation here. The 'current' and 'custom' indexes can provide some useful data for compatible altcoins and the possibility to compare inter-related tokens (eg: Doge vs Shib). While i introduced this as a sort of sequel to Dominion, it is not intended as a replacement but more of a companion. This initially started as a feature intended for that one but it quickly grew into its own thing. Both the oscillator view here and the more traditional view have merits, i personally use this one primarily now but frequently refer to Dominion for confirmations etc.
That's it for now anyway. As always, feedback is welcome below. Enjoy!

Bitcoin Correlation MapHello everyone,
This indicator shows the correlation coefficients of altcoins with bitcoin in a table.
What is the correlation coefficient?
The correlation coefficient is a value that takes a value between 0 and 1 when a parity makes similar movements with the reference parity, and takes a value between 0 and -1 when it makes opposite movements.
In order to obtain more meaningful and real-time results in this indicator, the weighted average of the correlation values of the last 200bar was used. You can change the bar length as you wish. With the correlation value, you can see the parities that have similar movements with bitcoin and integrate them into your strategy.
You can change the coin list as you wish, and you can also calculate their correlation with etherium instead of bitcoin .
The indicator shows the correlation value of 36 altcoins at the moment.
The indicator indicates the color of the correlated parities as green and the color of the inversely correlated parities as red.
Cheers

Stablecoins DominanceStablecoins Dominance
The purpose of the script is to show Stablecoin's strength in the crypto markets.
5 Largest Stablecoins divided by Total Market Cap
Altcoin Dominance (without ETH) Excluding Stablecoins UnsymetricAltcoin Dominance (without ETH) Excluding Stablecoins Unsymetric
The purpose of the script is to show Altcoin's strength without Ethereum once we exclude stablecoins.
So we look into all altcoins besides eth and besides stablecoins divided by a value of eth+btc

Altcoin Dominance Excluding EthereumAltcoin Dominance Excluding Ethereum
The purpose of the script is to show Altcoin's strength without Ethereum.
Pretty much shows Altcoin's Dominance in comparison to Market Cap once we exclude Ethereum.

TARVIS Labs - Alts Macro Bottom/Top SignalsSCRIPT DESCRIPTION
PLEASE READ THROUGH THIS CAREFULLY.
This is a script specifically written to help provide indicators from a macro view for ALTS. This script needs to be run on the 1 day. It helps indicate when to accumulate alts, and when its in a bull run when this a bull run top beginning to form with warnings, and a indicator that a top is in. This is described further below.
NOTE - in order to accomodate most alts the script had to be broad enough in its indicators to cover many different scenarios. If you are trading a smaller altcoin I suggest taking a more conservative approach to accumulation.
FAQs:
1. Why is there no accumulation zone showing up before an uptrend?
This could be because the trend has been so strong for this coin that there hasn't been a strong enough signal to accumulate or this could be that the chart doesnt have enough historical data (needs over 2 years) for the indicators to flash green.
2. Why is there no tops shown for a chart Im looking at?
This is either because there isn't enough historical data (needs over 2 years) for the indicators to build or because the altcoin didnt perform as well as the rest of the market. The altcoin has to perform as well as the market over the length of the bull run in order for the signals to show. Typically an altcoin that shows sharp increases and sharp drops shortly after will not have signals show up.
3. The "Potential End of Bull Run Top Indicator" showed up but we weren't near the top yet, why is that?
The alts indicator has to work across many altcoins, and their trends are not all the same. This can lead to the indicator showing but not necessarily being the exact top. The data from the alts macro bottom/top signals should be paired with the "TARVIS Labs bitcoin macro bottom/top signals" indicator for BTC. The reasoning is because if the top is not showing that its in for Bitcoin its likely that the altcoin's top is also not in. You should use the two in tandem to know if the bull run top is very likely in.
ACCUMULATION ZONE INDICATOR - LIGHT GREEN
Description
When we look at the general crypto landscape, the 200d & 300d EMAs are extremely useful. We can use their cross and momentum in order to determine a bottom forming. If the price has fallen over 40% below the 200 day EMA and the 200 day EMA has crossed below the 300d EMA, its a downtrend with a steep fall, which could indicate a good time to accumulate. When we see the 200 day EMA's slope drop drastically (over 5% w/w) it is also a good signal to accumulate.
Strategy for Usage
For alts, the strategy can vary drastically. You need to take into account:
1. the market cap of the altcoin, is it a smaller market cap altcoin or a larger one?
2. historical trend, does it typically trend strongly with a smaller accumulation zone?
Once you've taken these into account you can form a strategy. For example, if the altcoin has had smaller accumulation zones historically you'll want to take advantage of the accumulation zones when they pop up and be more aggressive (say a 30 day accumulation). If the altcoin has historically had longer accumulation zones then you'll want to be more conservative with your strategy and potentially have a 100 day (or even longer) accumulation period. If the altcoin is a smaller market cap alt, you will want to also take that into account. You'll want to likely be more conservative,
STRONG BUY IN ACCUMULATION ZONE INDICATOR - DARK GREEN
Description
We can add to the bottoming signal by looking for strong downtrends inside the bottoming signal. We do this by seeing when the 36 day EMA has a slope decreasing by 2% day/day.
Strategy for Usage
These strong downtrend days can be used to add more to our accumulation strategy. We can add more on these days (ex. double what you were planning to on a typical accumulation day).
LOCAL TOP NEAR BULL RUN TOP INDICATOR - RED
Description
When the 100 week EMA is in a strong uptrend (4% increase w/w) we can look for significant loss of momentum in order to determine if a local top is in near a bull run top. This strategy uses a MACD with 9/36/9 config for the daily chart. We look for the signals momentum loss, when the slope becomes negative.
Strategy for Usage
Ideally the right strategy to use here is to exit the market when this indicator starts. When the indicator ends if the "Potential End of Bull Run Top Indicator" is not showing on the chart you can buy back into the market.
POTENTIAL END OF BULL RUN TOP INDICATOR - DARK RED
Description
When the 100 week EMA is in a strong uptrend (3% increase w/w), and a MACD config of 108/234/9 has a negative signal slope signifying a very large momentum loss, but the 1d 18 EMA is still above the 1d 63 EMA we show this signal.
Strategy for Usage
This is a strong indicator that the top is in, and it potentially being the bull run top. Because alts can vary strongly in their charts, this should be a strong warning but not necessarily a certainty that the bull run is over.

Stochastic Moving AverageHi all,
This Strategy script combines the power of EMAs along with the Stochastic Oscillator in a trend following / continuation manner, along with some cool functionalities.
I designed this script especially for trading altcoins, but it works just as good on Bitcoin itself and on some Forex pairs.
______ SIGNALS ______
The script has 4 mandatory conditions to unlock a trading signal. Find these conditions for a long trade below (works the exact other way round for shorts)
- Fast EMA must be higher than Slow EMA
- Stochastic K% line must be in oversold territory
- Stochastic K% line must cross over Stochastic D% line
- Price as to close between slow EMA and fast EMA
Once all the conditions are true, a trade will start at the opening of the next
______ SETTINGS ______
- Trade Setup:
Here you can choose to trade only longs or shorts and change your Risk:Reward.
You can also decide to adjust your volume per position according to your risk tolerance. With “% of Equity” your stop loss will always be equal to a fixed percentage of your initial capital (will “compound” overtime) and with “$ Amount” your stop loss will always be 'x' amount of the base currency (ex: USD, will not compound)
Stop Loss:
The ATR is used to create a stop loss that matches current volatility. The multiplier corresponds to how many times the ATR stop losses and take profits will be away from closing price.
- Stochastic:
Here you can find the usual K% & D% length and overbought (OB) and oversold (OS) levels.
The “Stochastic OB/OS lookback” increase the tolerance towards OB/OS territories. It allows to look 'x' bars back for a value of the Stochastic K line to be overbought or oversold when detecting an entry signal.
The “All must be OB/OS” refers to the previous “Stochastic OB/OS lookback” parameter. If this option is ticked, instead of needing only 1 OB/OS value within the lookback period to get a valid signal, now, all bars looked back must be OB/OS.
The color gradient drawn between the fast and slow EMAs is a representation of the Stochastic K% line position. With default setting colors, when fast EMA > slow EMA, gradient will become solid blue when Stochastic is oversold and when slow EMA > fast EMA, gradient will become solid blue when Stochastic is overbought
- EMAs:
Just pick your favorite ones
- Reference Market:
An additional filter to be certain to stay aligned with the current a market index trend (in our case: Bitcoin). If selected reference market (and timeframe) is trading above selected EMA, this strategy will only take long trades (vice-versa for shorts) Because, let’s face it… even if this filter isn’t bulletproof, you know for sure that when Bitcoin tanks, there won’t be many Alts going north simultaneously. Once again, this is a trend following strategy.
A few tips for increased performance: fast EMA and D% Line can be real fast… 😉
As always, my scripts evolve greatly with your ideas and suggestions, keep them coming! I will gladly incorporate more functionalities as I go.
All my script are tradable when published but remain work in progress, looking for further improvements.
Hope you like it!

RinarBottombuyRSI, VWMA, MA.
Altcon bottom signals.
buy
White background - bottom point
Yellow - Buy zone
White triangles - a signal to place orders
Sell
Red - sale
RU
RSI , VWMA , MA.
Сигналы дна альтконов.
Buy
Белый фон -точка дна
Желтый - Зона покупки
Белые треугольники - сигнал выставить ордера
Sell
Красный - продажа

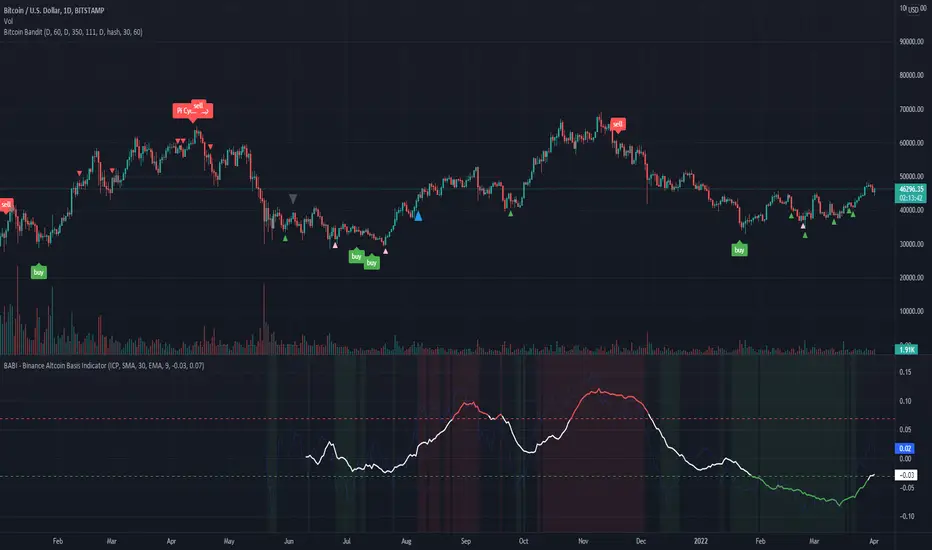
BABI - Binance Altcoin Basis Indicator
This indicator works by taking the basis between various altcoin perpetual futures contracts and spot market indexes on Binance, and then smooths out the data with a basic moving average.
The result is a useful oscillator that shows potential "buy" and "sell" areas.
Simply put, a spot premium is usually bullish and a derivatives premium is usually bearish.
Other versions of this indicator only worked for BTC and ETH, so I have extended its functionality to include popular altcoin trading pairs.
USDT Trading pairs included in this version:
•BTC
•ETH
•LTC
•ICP
•SOL
•LUNA
•GRT
•ATOM
•ADA
•XRP
•ETC
•AVAX
Default setting is BTC. To choose a different oscillator, go to settings and pick your desired crypto.
Thanks for looking. I think you could create a pretty basic trading strategy based on this indicator by simply placing buy and sell orders once the oscillator rises or falls below certain thresholds.
**Credit to @chestbrook on Twitter and Pinnacle_Investor on TradingView
Binance Basis Oscillator ()
[Joy] AladdinDirectly used for entertainment purposes in figuring out the market trend:
Sell/bearish sign: I open a short position on the candle's close. I am bearish on the instrument.
Buy/bullish sign: I open a long position on the candle's close. I am bullish on the instrument.
Red circle: If I run a long position, I take at least 50% unrealized profit into a realized profit on the close candle. I might even convert some portion of the underlying spot into stable coins. I am essentially taking profit along the way as the trend is developing.
Green circle: If I am running a bearish short position, I take at least 50% unrealized profit into a realized profit on the candle's close. I am essentially taking profit along the way as the trend is developing.
Below are used for indications only:
Down Arrows: It is not directly used in opening/closing positions. When the down arrow finishes and the candle close, it sometimes indicates a local top. It does not mean the macro trend has changed.
Up Arrows: It is not directly used in opening/closing positions. When the up arrow finishes and the candle close, it sometimes indicates a local bottom. It does not mean the macro trend has changed.
Red Crosses: It indicates a squeeze may be incoming. When the red crosses finish, the price may move significantly in any one direction. It does not say which direction. It only gives me caution.
Experimental - Below Work in Progress may be from the config only:
>> Jasmine - Tweak of Aladdin
>> Candle color - Logic is different from Aladdin
>> Background color - Logic is different from Aladdin
FAQs
Q: Does it use some EMA /MA/Ichimoku/Parabolic SAR, etc? Does it use any indicator with tweaked settings?
Answer: No.
Q: What does it mostly use?
Answer: Volume and gradual flow of non-interrupted data. The logic depends on the correlation between volume , price bars and the wicks.
Q: Can you make it free or make it open source?
Answer: There is no free lunch in this world. I will never reveal or share the source code or make it free for all!
Q: Do you provide ongoing support for the indicator?
Answer: Yes, I will continue updating the indicator as long as I can. However it depends entirely on me. I may stop updating as well.
Q: Are the bullish /buy & the bearish /sell markers automatic?
Answer: Yes. I do not control it!
Q: Is this financial advice?
Answer: Any views expressed by the indicator are personal entertainment views & shouldn't form a basis for making investment decisions, nor be construed as a recommendation or advice to engage in investment transactions. It is not financial advice. I highly recommend not even think of using this for actual real-life trading with real money. Neither I nor the indicator is responsible for any misuses, including any profit/loss. There is no warranty on this entertainment product

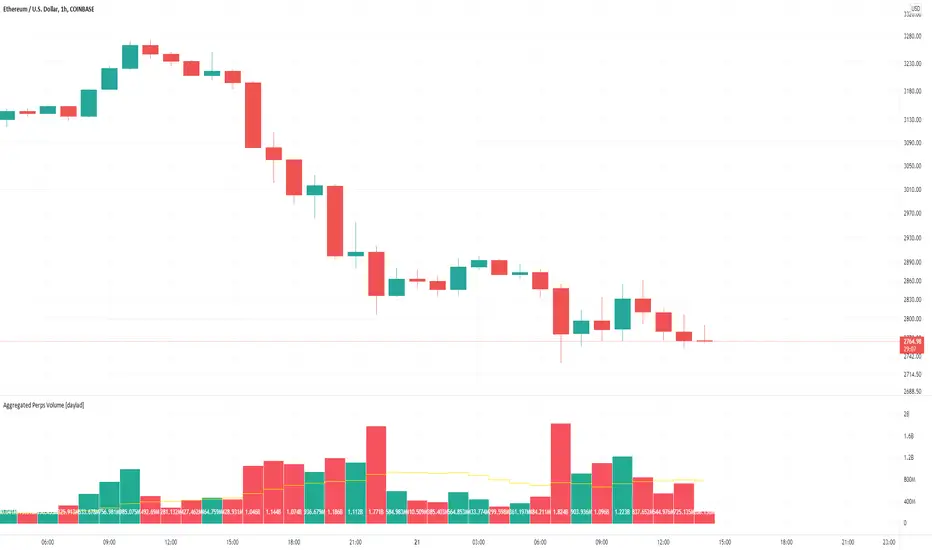
Aggregated Perps Volume [daylad]Same thing as my aggregated spot volume indicator, but for crypto perpetual futures contracts ().
Works with any crypto chart! No need to manually update symbols, this indicator will detect if there is a matching symbol and add it automatically!
The price labels display the total volume per bar in USD.
Pulls data for the following pairs (when available):
BINANCE: + base_symbol + PERP
BINANCE: + base_symbol + BUSDPERP
BINANCE: + base_symbol + USDTPERP
OKEX: + base_symbol + USDTPERP
OKEX: + base_symbol + PERP
FTX: + base_symbol + PERP
PHEMEX: + base_symbol + USD
BYBIT: + base_symbol + USD
BYBIT: + base_symbol + USDT
DERIBIT: + base_symbol + PERP
HUOBI: + base_symbol + PERP
BTSE: + base_symbol + PFC
EXAMPLE -- If you're looking at the COINBASE:SOLUSD chart the indicator will automatically aggregate the volume from BINANCE:SOLPERP, FTX:SOLPERP...etc... BYBIT:SOLUSDT...etc... BTSE:SOLPFC. If an exchange does not have a corresponding pair, then that pair returns 0 and does not add to the total.
If you have any questions feel free to ask. Happy trading!
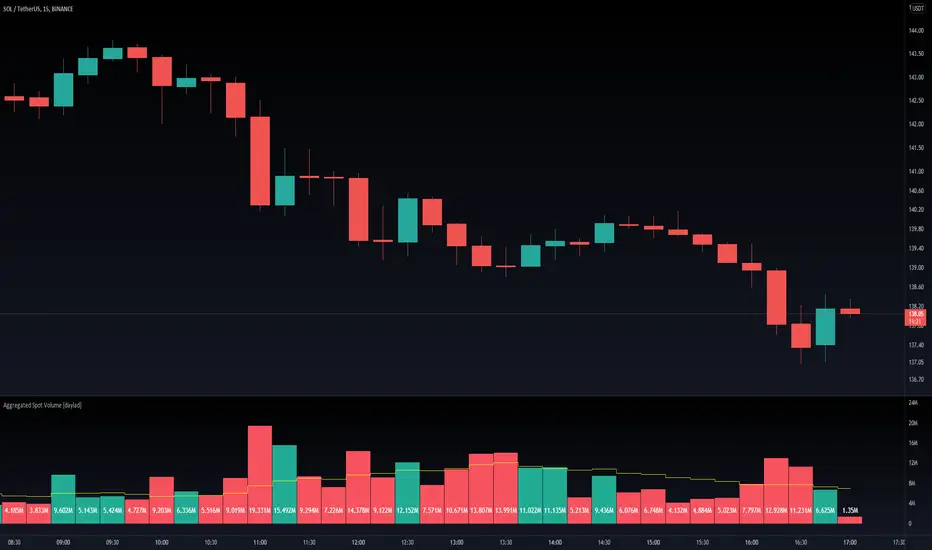
Aggregated Spot Volume [daylad]Works with any crypto chart! Automatically pulls and aggregates trading volume for the top stop pairs.
No need to manually update symbols, this indicator will detect if there is a matching symbol and add it.
Pulls data for the following pairs (when available):
COINBASE: + symbol + USD
COINBASE: + symbol + USDT
COINBASE: + symbol + EUR
BINANCE: + symbol + USDT
BINANCE: + symbol + BUSD
BINANCEUS: + symbol + USD
OKEX: + symbol + USDT
OKEX: + symbol + USDK
FTX: + symbol + USD
HUOBI: + symbol + USDT
BITFINEX: + symbol + USD
KRAKEN: + symbol + USD
KUCOIN: + symbol + USDT
CURRENCYCOM: + symbol + USD
POLONIEX: + symbol + USDT
UPBIT: + symbol + KRW
BITHUMB: + symbol + KRW
EXAMPLE -- If you are looking at the BINANCE:ADAUSDT chart, the indicator will automatically aggregate the volume from COINBASE:ADAUSD, COINBASE:ADAUSDT...etc... BINANCE:ADAUSDT...etc... BITHUMB:ADAKRW. If an exchange does not have a specific pair, then that pair returns 0 (does not add to the total).
If you have any questions feel free to ask. Happy trading!
altcoin strength This indicator measures the relationship between bitcoin and bitcoin dominance and creates a strength index for altcoins. Values above zero add strength to the rise, values below zero add strength to the decline.
bu indikatör bitcoin ve bitcoindominans arasındaki ilişkiyi ölçer ve altcoinler için bir güç endeksi oluşturur sıfırın üstündeki değerler yükselişe güç katar sıfırın altındaki değerler düşüşe güç katar

BTC Dominance TrendThis simple script applies the DMI/ADX (trend) indicator to the Bitcoin Dominance Index (BTC.D) to check whether BTC is increasing its dominance or not on that day. It is meant to be applied to altcoins on medium intervals. I put it together to test the following hypothesis: On days when BTC dominance is on the rise, altcoins are harder to take off, because Bitcoin is draining the lifeblood out of them, so caution is needed when opening trades.
Olive background means BTC dominance is rising on that day, purple that it is decreasing. White background means it is not moving significantly in any direction.
You can change the resolution (i.e. apply the DMI/ADX to a different BTC.D interval), just make sure to lower the threshold as well. I hope you find a good use for it! Beware if you try to incorporate it in your strategy, it uses higher timeframe data and hence is prone to repainting.

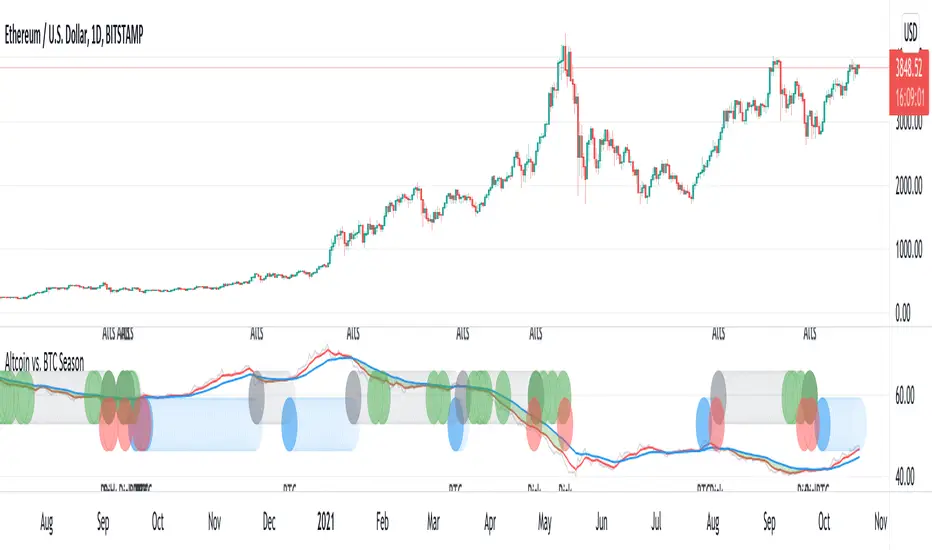
Altcoin vs. BTC SeasonUsing BTC dominance to identify BTC vs. Altcoin season.
Blue: BTC season
Gray: Altcoin season
Green: Altcoin at support - entry with good risk/reward
Red: Potential BTC downside risk
[astropark] Trend Skywalker V2 [alarms]Dear Followers,
today I'm glad to present you Trend Skywalker V2 , the evolution of Trend Skywalker V1 indicator that you can see here below:
This indicator works on every timeframe and market, it's quite responsive to market movements, so it's especially good on volatile markets.
In this new version you have 3 trend clouds available :
a short-term one (yellow)
a mid-term one (green)
a long-term one (blue)
You can also enable an option to show all trend clouds as one, the result will be similar to a special bollinger bands tool.
Of course you can edit trend clouds analysis period and color, also you can turn on or off the cloud that you prefer.
The indicator can run 4 different kinds of strategy : one for each trend cloud individually or a mixed one.
Also the indicator tracks for you a peak profit from entry: this tracker is a suggestion for you to take profits while price goes up!
All red-green circles you see in the chart is a reminder that a peak profit label was there in the past: what does this tell you?
if price starts losing the short-term trend and you had a lot of TP suggestions, maybe trend ended and you should start consider closing your trade before you give back all your profit.
This indicator will let you set alerts on each buy/sell/close/tp label.
For backtesting, you can use the indicator here below:
This is a premium indicator , so send me a private message in order to get access to this script.

[astropark] Trend Skywalker V2 [strategy]Dear Followers,
today I'm glad to present you Trend Skywalker V2 , the evolution of Trend Skywalker V1 indicator that you can see here below:
This indicator works on every timeframe and market, it's quite responsive to market movements, so it's especially good on volatile markets.
In this new version you have 3 trend clouds available :
a short-term one (yellow)
a mid-term one (green)
a long-term one (blue)
You can also enable an option to show all trend clouds as one, the result will be similar to a special bollinger bands tool.
Of course you can edit trend clouds analysis period and color, also you can turn on or off the cloud that you prefer.
The indicator can run 4 different kinds of strategy : one for each trend cloud individually or a mixed one.
Also the indicator tracks for you a peak profit from entry: this tracker is a suggestion for you to take profits while price goes up!
All red-green circles you see in the chart is a reminder that a peak profit label was there in the past: what does this tell you?
if price starts losing the short-term trend and you had a lot of TP suggestions, maybe trend ended and you should start consider closing your trade before you give back all your profit.
On backtesting you can you test long and short setups individually or both, as well as performance in a specific time window.
This is a premium indicator , so send me a private message in order to get access to this script.

Current to BTC [Morty]This indicator helps you find strong bull altcoin, it shows the ratio of the current symbol to BTC.
Donchian Channels help to identify trends.
Alts Bull coins:
When BTC goes sideway, they pump first.
Alts Bear coins:
When BTC goes sideway, they move sideway.
When BTC goes down, they go down harder.
