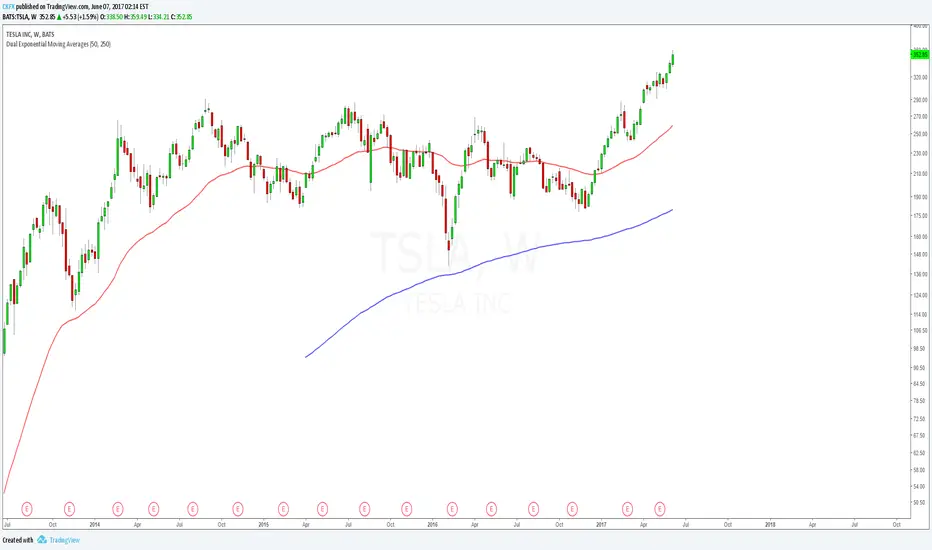
Dual Exponential Moving AveragesJust like the regular "Moving Average Exponential" indicator except this allows you to show 2 with custom time intervals, saving non-subscribers to Trading View an indicator slot. Enjoy.
Average
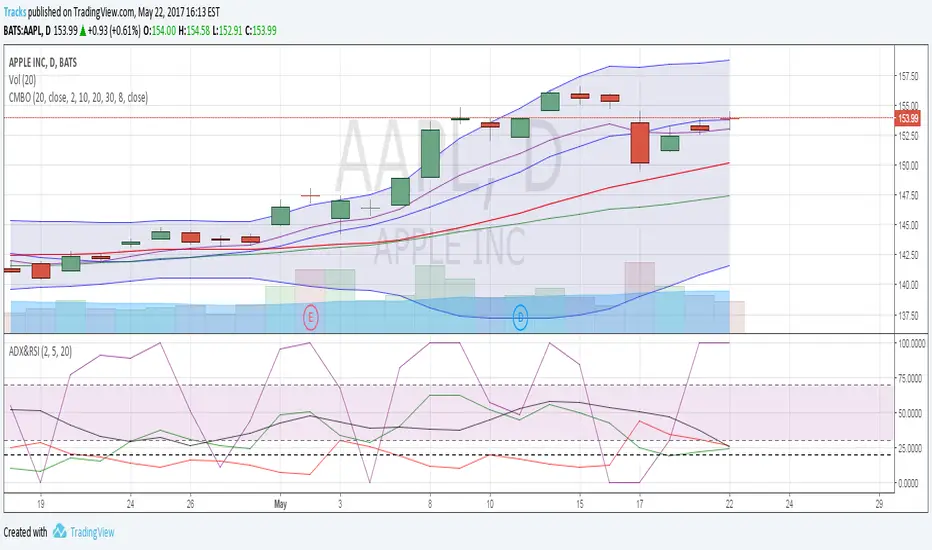
Combo IndicatorFor easier setup, this script combines 5 indicators. 3 simple moving averages, 1 EMA and Bollinger Bands. These are common indicators that are that often used and discussed on OptionsPlayers.com
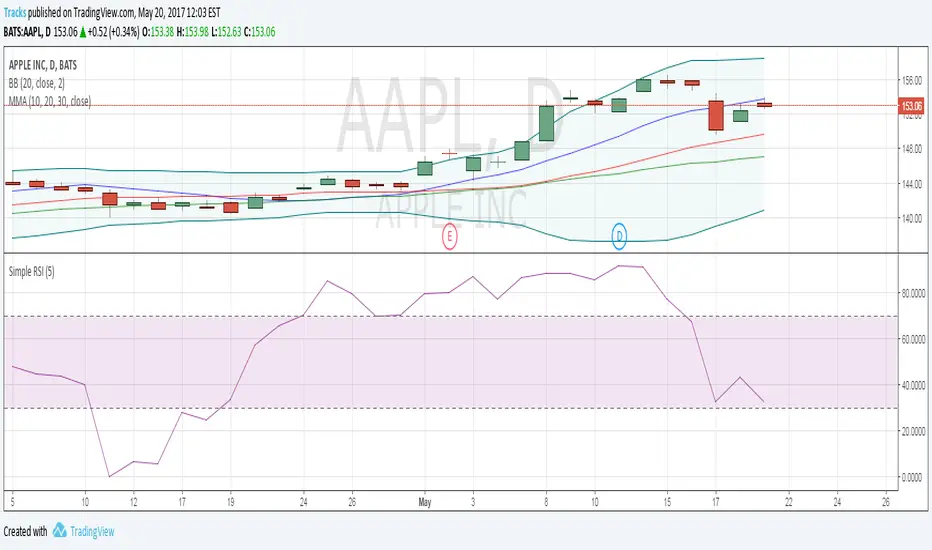
Multiple Moving AverageCombines 3 moving average plot lines into one indicator for easy configuration
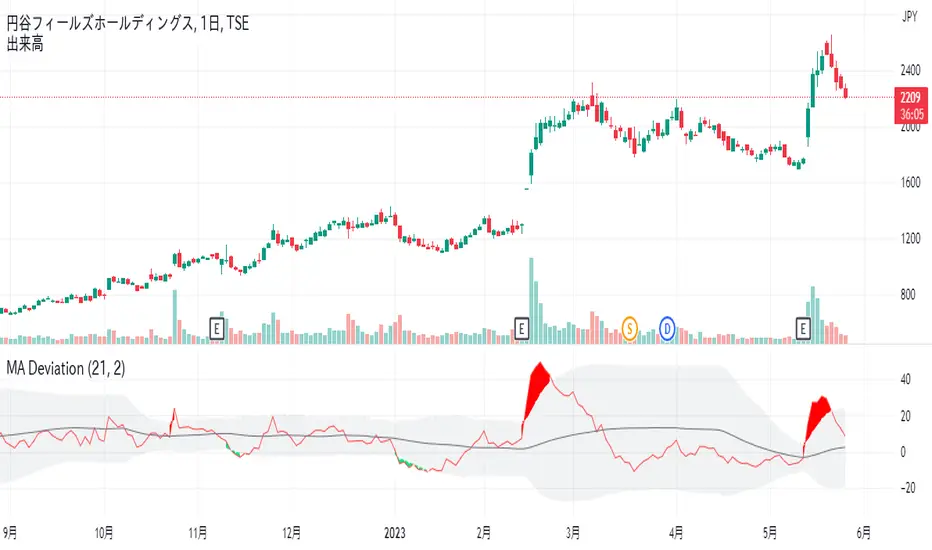
Moving average deviation rateMoving average deviation rate
Simple moving average deviation rate and standard deviation.
The bollinger band is momentum value standard devition.
Bat the bollinger band is not normal distribution to close price.
Moving average deviation rate is normal distribution.
This indicator is draw Moving average deviation rate and fill area 2σ standard devition.
If it exceeds 2σ, it is a trading opportunity.
移動平均かい離率と、2σのバンドです。
ボリンジャーバンドは移動量の標準偏差を描画しますが、終値はボリンジャーバンドに対して正規分布を描きません。
移動平均かい離率は、標準偏差に対して正規分布を示します。
かい離率2σを超えた場合、トレードチャンスです。
Multiple Moving Averages using only 1 Indicator!Multiple moving averages in one indicator, so those of you without a pro membership can add multiple moving averages to your chart while only taking up 1 of the 3 indicators.

Prime Fib AvgsHey all,
Just thought some might find it useful to have a script of the first 7 numbers that are both fibonacci and that are prime numbers as simple moving averages and as exponential averages.
If anyone wants any other average type added to this script I can put out another version
Happy trading,
Snoop

EMA Time-FrameThis EMA allows you to specify a time-frame for the price used to calculate the moving average. For example, you can create 1 hour EMAs on your 5 minute chart.
NOTE: This indicator only works on intraday charts. The time-frame specified for the indicator must be greater than or equal to the time-frame of the chart.

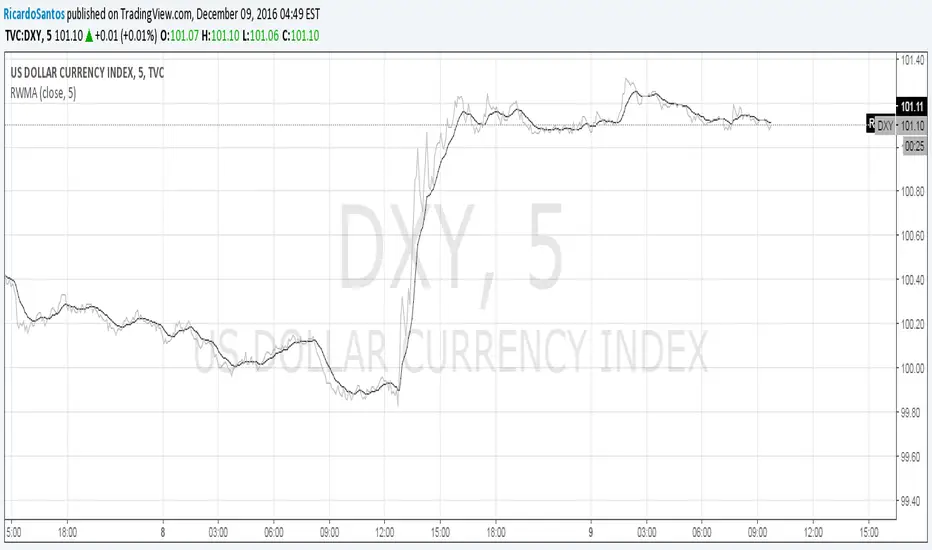
Function - Regressively Weighted Moving AverageEXPERIMENTAL:
Weights its self value by X against 1 time the current price.


Chaos 2.0This is pure chaos!
I just wanted 1 thing I can put on a chart to try to get a clearer picture of what is going on (and not take up all the indicator spaces a free user is allowed haha)
Many things going on from so many different users
honestly I'm sorry I cant shout out everyone whose code I have ever read and used in another project just for the sake of learning more about pinescript!
As a way of shouting everyone out! (and giving out my most useful and configurable system)
I give you... CHAOS
I originally got an Alligator, AO, and Fractal script from a user ChaosTrader, then realized I love using averages!
I added the MESA (lazybear?) and the McGinley Dynamic Range (sry idk) and a simple 233 SMA.
I also found about something called the www.prorealcode.com another user had created for Pinescript.
I really liked that script so I adapted it to do the same kind of signal printing for circles and squares (crosses and series)
Check it out tell me what you think and how I can make it better for everyone!
thanks all!
Snoop

FRAMA (Ehlers true modified calculation)Credit goes to Shizaru for the original calculation. I made just a few fixes, so that the calculation is really that of Ehlers.
Fixed H2 and L2 period, fixed w natural logarithm
Kaufman Adaptive Moving Average (day)The KAMA will not change when the interval changes from day to something like 5 minutes or 30 minutes. Allows for more precise trading with the same indicator on a different interval.
Kaufman Adaptive Moving AverageFrom Stockcharts.com:
"Developed by Perry Kaufman, Kaufman's Adaptive Moving Average (KAMA) is a moving average designed to account for market noise or volatility. KAMA will closely follow prices when the price swings are relatively small and the noise is low. KAMA will adjust when the price swings widen and follow prices from a greater distance. This trend-following indicator can be used to identify the overall trend, time turning points and filter price movements."
This is different from other users' KAMA's because it allows the user to adjust more parameters that can adjust the indicator in more precise ways without needing to change the source code.

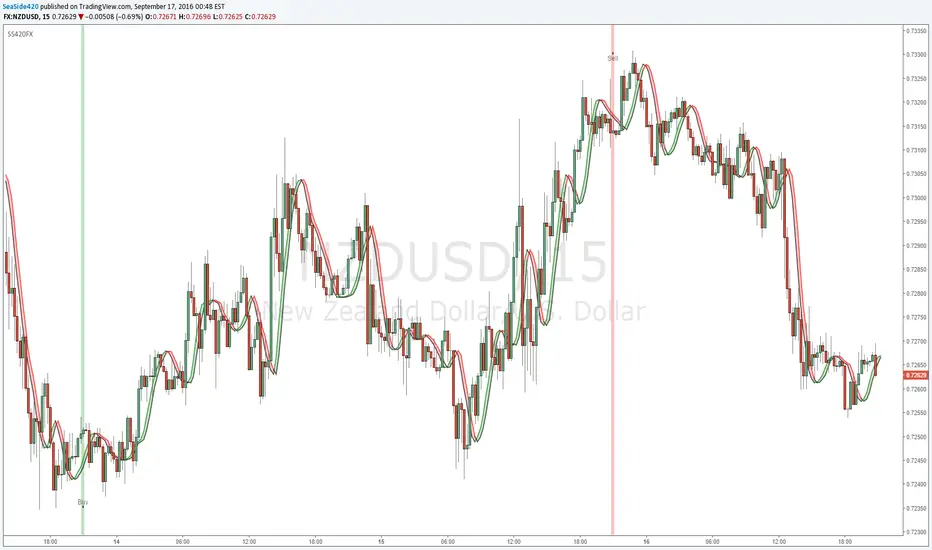
SS420FXTwo Moving_Average cross's & Daily_Candle cross
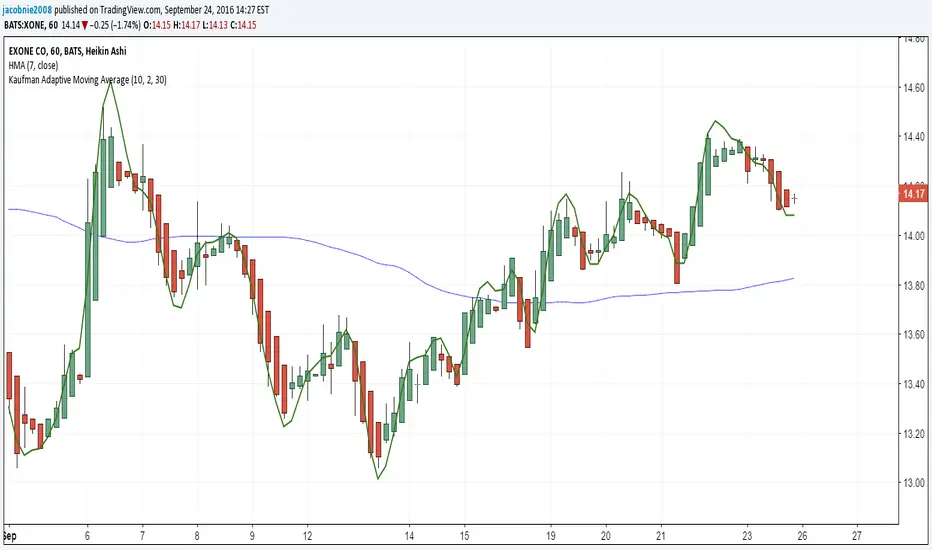
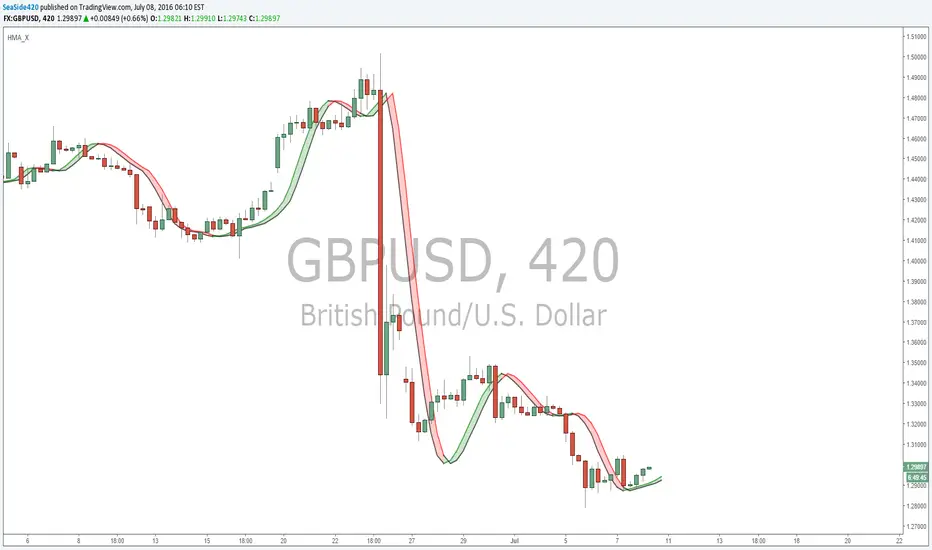
Based on Hull_MA
Developed by Alan Hull, it is an indicator, that solves the problem with making a moving average more reactive to current price activity. The Hull Moving Average almost eliminates lag and manages to improve smoothing.
The HMA manages to stick to rapid changes in price activity, as it has superior smoothing over a Simple Moving Average of the same period. The HMA employs Weighted Moving Averages (WMA) and dampens the smoothing effect. It can be calculated as follows:
HMA(n) = WMA(2*WMA(n/2) – WMA(n)), sqrt(n))
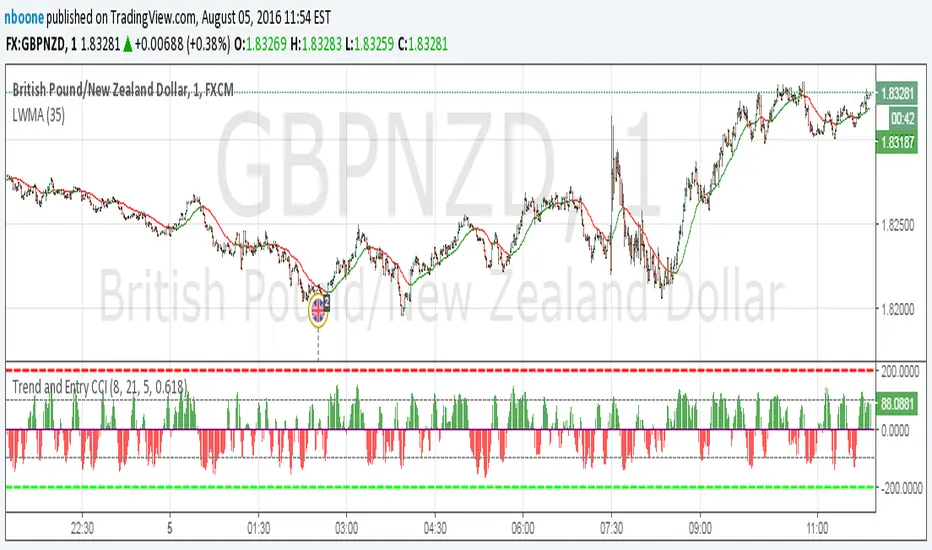
LWMA w/ Color ChangeLinear Weighted MA that changes colors based on slope.
Green = slope up from last bar
Yellow = slope is 0 from last bar
Red = slope down from last bar
This time with the ability to change the period.
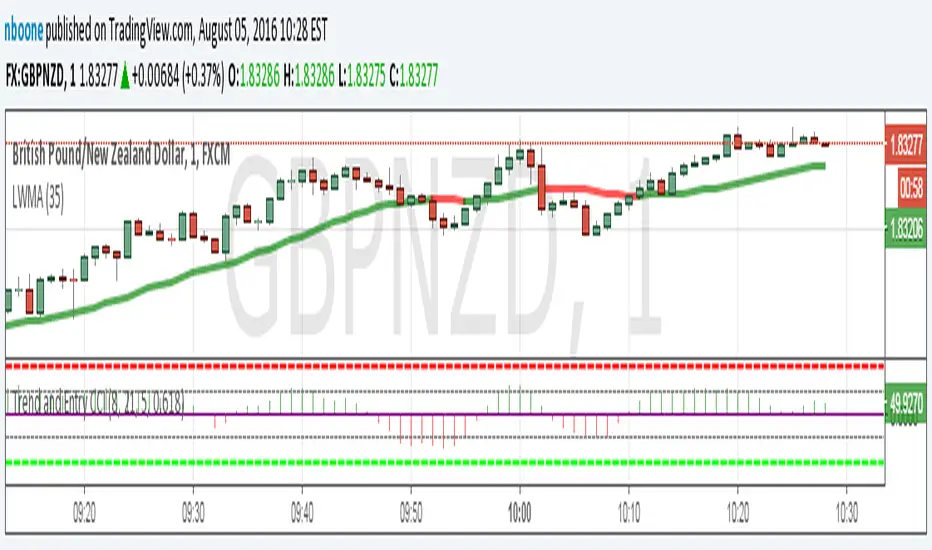
LWMA w/ Color ChangeLinear Weighted MA that changes colors based on slope.
Green = slope up from last bar
Yellow = slope is 0 from last bar
Red = slope down from last bar
Triple Guppy CrossGUPPY MULTIPLE ESTIMATED MOVING AVERAGE (EMA) is for Trend Trading. This script uses three sets of crosses to give us an indicator of possible trend reversal. Red cross is the first alert, followed by blue and black. Black cross being the strongest, red cross weakest.
More information about Guppy Trading can be found in the link below

Trend MA 20Simple to use for anyone trading a 20 length moving average.
Crossover is signaled once 20 MA crosses 1 MA at close of selected time interval.

WJA double EMASimple indicator with two exponential moving averages and crossover alert.
Why didn't this exist already?

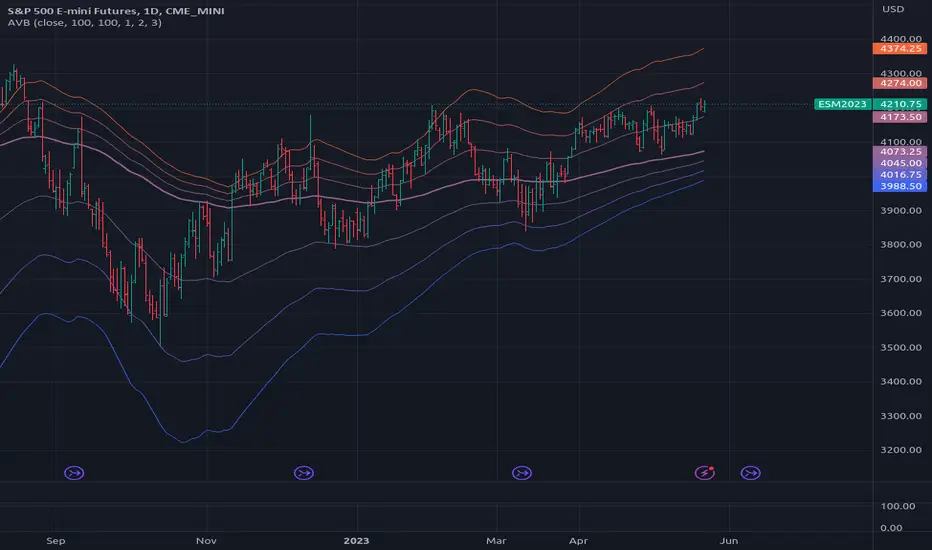
[RS]Average Variation Bands V1optional method for cumulative averaging of the range variation.
optional length for averaging range variation.