Pocket Pivot IndicatorFrom Gil Morales and Chris Kacher (O'Neil's disciples). Designed to find buy points in bases and continuation buy points in an uptrend. The volume today must be greater then the maximum down volume of the past 10 trading days. Recommended to use in conjunction with the 10 day and/or 50 day moving average.
Typical use :
Scan for pocket pivots.
Is stock strong fundamentally? i.e- leader in it's sector
Has the stock developed a base ?(see O'Neil's work for base discussion)
Is the stock breaking through or bouncing off the 10 period sma? (can use 50 sma too)
If so.. a possible buy.
Cheers
David
BASE

Support the Resistance BacktestHello Fellow Traders!
-------------------------------------------
This is the newest addition to Gnome Alerts PRO!
This Bot Script works on all Crypto, Leverage, Forex, & Traditional Exchanges.
Trade of Support & Resistance Levels in Realtime!
FEATURES
------------------------
*Autoview Ready*
- Easy to Use
- Backtesting Included
- Stop Loss
More info on how gain access in my profile!


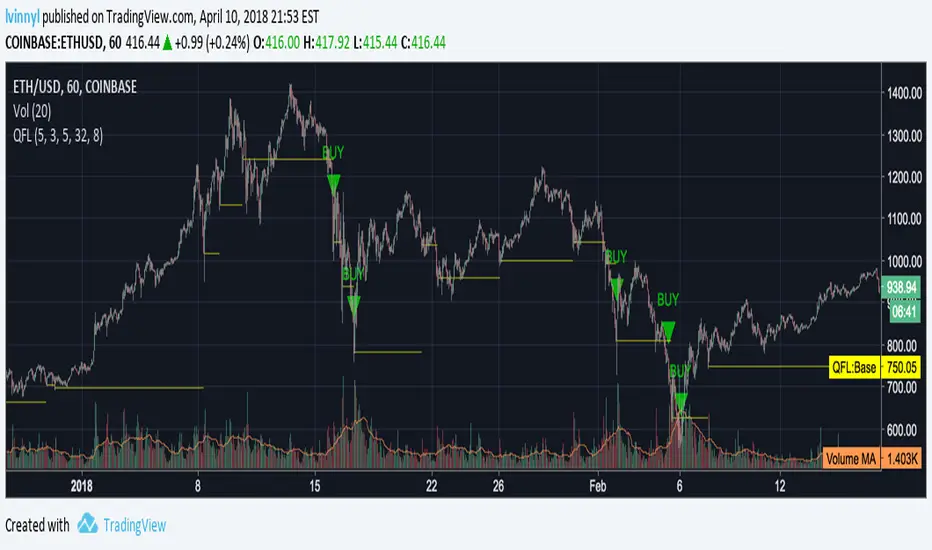
Quickfingers Luc's Base Breaking Indicator v2Overview of Features
This indicator attempts to implement Quickfingers Luc’s (QFL) Base Breaking trading methodology(1). It will monitor the chart price action and identify bases as they form and provide alert notifications for when bases and/or layers are cracked and respected.
This indicator is designed to locate pivot patterns and validate them to ensure they qualify as valid bases according to QFL’s trading principles by analyzing the percent price drop/bounce, volume and other settings to help you customize it to your chart. It will switch to new bases as they are identified and validated, thus there's the potential for bases to not be respected because it has switched to a new base.
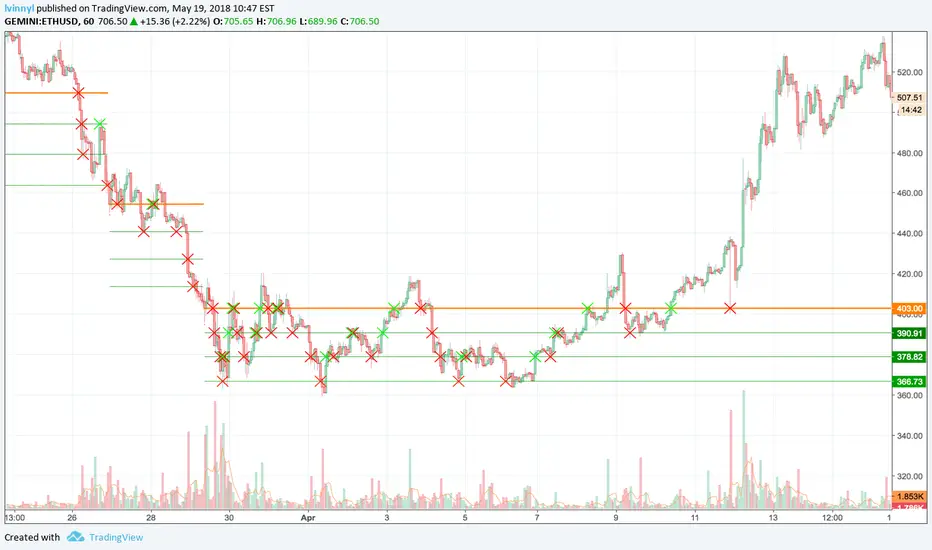
It supports up to nine (9) layers with crack and respected alerts with chart X-Cross shapes to help you visualize the events.
Lastly, the indicator creates additional data points that are viewable in the data window panel, displaying the following metrics:
Bases Created
Bases Cracked
Bases Respected
Success Rate %
Median Drop %
Median Bounces %
Usage Information
The indicator can be applied to any chart at any time frame, but QFL principles advise to use at least 1 hour resolution for best results.
Direct message me to start the process of obtaining access.
Version/Release Information
This indicator is version 2 and is a re-write of the previous release
New features in the next release will include:
Defect fixes as they are identified
Multiple bases at the same-time, in order to improve respected base detection when switching to new bases
Any new features proposed by the user community
References
1. Luc, Quickfingers. (2016, July). “Quickfingers Luc, Some people love gardening, not me, I grow money (trading)” . Retrieved from steemit.com
Quickfingers Luc's Base Breaking Indicator v1This script is an attempt to implement Quickfingers Luc's Base Breaking Strategy (steemit.com) where it will detect bases using pivot low detection, panic selling detection (price momentum), RSI and percent below base thresholds to trigger an alert condition.