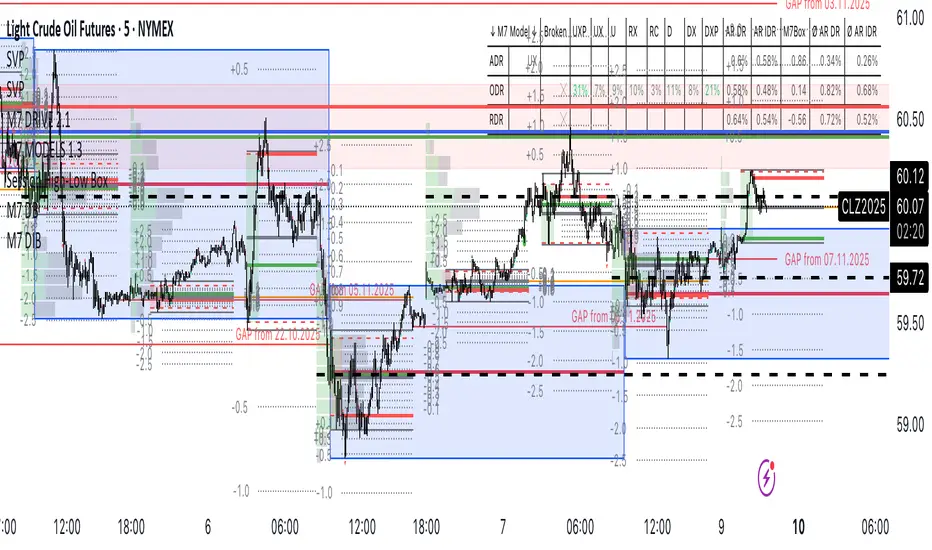
Session High-Low Box,
Session High-Low Box Session High-Low Box indicatorSession High-Low BoxSession High-Low BoxSession High-Low BoxSession High-Low BoxSession High-Low BoxSession High-Low BoxSession High-Low BoxSession High-Low BoxSession High-Low BoxSession High-Low BoxSession High-Low BoxSession High-Low BoxSession High-Low BoxSession High-Low BoxSession High-Low BoxSession High-Low BoxSession High-Low BoxSession High-Low BoxSession High-Low BoxSession High-Low BoxSession High-Low BoxSession High-Low Boxwrtvtrvwrtv4v2tr2Session High-Low Box24v2v2Session High-Low Box
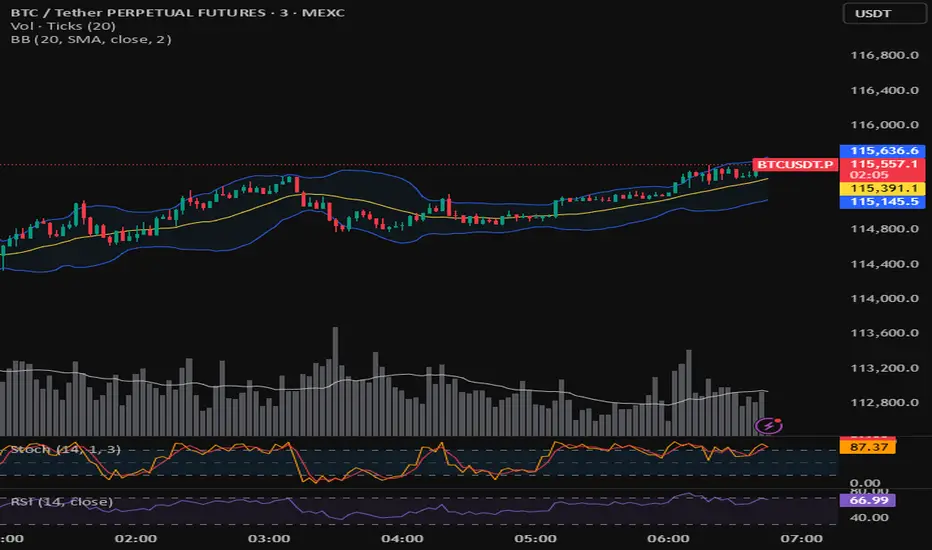
BB
BB SPY Mean Reversion Investment StrategySummary
Mean reversion first, continuation second. This strategy targets equities and ETFs on daily timeframes. It waits for price to revert from a Bollinger location with candle and EMA agreement, then manages risk with ATR based exits. Uniqueness comes from two elements working together. One, an adaptive band multiplier driven by volatility of volatility that expands or contracts the envelope as conditions change. Two, a bias memory that re arms the same direction after any stop, target, or time exit until a true opposite signal appears. Add it to a clean chart, use the markers and levels, and select on bar close for conservative alerts. Shapes can move while the bar is open and settle on close.
Scope and intent
• Markets. Currently adapted for SPY, needs to be optimized for other assets
• Timeframes. Daily primary. Other frames are possible but not the default
• Default demo. SPY on daily
• Purpose. Trade mean reversion entries that can chain into a longer swing by splitting holds into ATR or time segments
Originality and usefulness
• Novelty. Adaptive band width from volatility of volatility plus a persistent bias array that keeps the original direction alive across sequential entries until an opposite setup is confirmed
• Failure modes mitigated. False starts in chop are reduced by candle color and EMA location. Missed continuation after a take profit or stop is addressed by the re arm engine. Oversized envelopes during quiet regimes are avoided by the adaptive multiplier
• Testability. Every module has Inputs and visible levels so users can see why a suggestion appears
• Portable yardstick. All risk and targets are expressed in ATR units
Method overview in plain language
The engine measures where price sits relative to Bollinger bands, confirms with candle color and EMA location, requires ADX for shorts(in our case long close since we use it currently as long only), and optionally requires a trend or mean reversion regime using band width percent rank and basis slope. Risk uses ATR for stop, target, and optional breakeven. A small array stores the last confirmed direction. While flat, the engine keeps a pending order in that direction. The array flips only when a true opposite setup appears.
Base measures
• Range basis. True Range smoothed over a user defined ATR Length
• Return basis. Not required
Components
• Bollinger envelope. SMA length and standard deviation multiplier. Entry is based on cross of close through the band with location bias
• Candle and EMA filter. Close relative to open and close relative to EMA align direction
• ADX gate for shorts. Requires minimum trend strength for short trades
• Adaptive multiplier. Band width scales using volatility of volatility so envelopes breathe with conditions
• Regime gate optional. Band width percent rank and basis slope identify trend or mean reversion regimes
• Risk manager. ATR stop, ATR target, optional breakeven, optional time exit
• Bias memory. Array stores last confirmed direction and re arms entries while flat
Fusion rule
Minimum satisfied gates count style. All required gates must be true. Optional gates are controlled in Inputs. Bias memory never overrides an opposite confirmed setup.
Signal rule
• Long setup when close crosses up through the lower band, the bar closes green, and close is above the long EMA
• Short setup when close crosses down through the upper band, the bar closes red, close is below the short EMA, and ADX is above the minimum
• While flat the model keeps a pending order in the stored direction until a true opposite setup appears
• IN LONG or IN SHORT describes states between entry and exit
What you will see on the chart
• Markers for Long and Short setups
• Exit markers from ATR or time rules
• Reference levels for entry, stop, and target
• Bollinger bands and optional adaptive bands
Inputs with guidance
Setup
• Signal timeframe. Uses the chart timeframe
• Invert direction optional. Flips long and short
Logic
• BB Length. Typical 10 to 50. Higher smooths more
• BB Mult. Typical 1.0 to 2.5. Higher widens entries
• EMA Length long. Typical 10 to 50
• EMA Length short. Typical 5 to 30
• ADX Minimum for short. Typical 15 to 35
Filters
• Regime Type. none or trend or mean reversion
• Rank Lookback. Typical 100 to 300
• Basis Slope Length and Threshold. Larger values reduce false trends
Risk
• ATR Length. Typical 10 to 21
• ATR Stop Mult. Typical 1.0 to 3.0
• ATR Take Profit Mult. Typical 2.0 to 5.0
• Breakeven Trigger R. Move stop to entry after the chosen multiple
• Time Exit. Minimum bars and extension when profit exceeds a fraction of ATR
Bias and rearm
• Bias flips kept. Array depth
• Keep rearm when flat. Maintain a pending order while flat
UI
• Show markers and levels. Clean defaults
Usage recipes
Alerts update in real time and can change while the bar forms. Select on bar close for conservative workflows.
Properties visible in this publication
• Initial capital 25000
• Base currency USD
• If any higher timeframe calls are enabled, request.security uses lookahead off
• Commission 0.03 percent
• Slippage 3 ticks
• Default order size method Percent of equity with value 5
• Pyramiding 0
• Process orders on close On
• Bar magnifier Off
• Recalculate after order is filled Off
• Calc on every tick Off
Realism and responsible publication
No performance claims. Costs and fills vary by venue. Shapes can move intrabar and settle on close. Strategies use standard candles only.
Honest limitations and failure modes
High impact releases and thin liquidity can break assumptions. Gap heavy symbols may require larger ATR. Very quiet regimes can reduce contrast in the mean reversion signal. If stop and target can both be touched inside one bar, outcome follows the TradingView order model for that bar path.
Regimes with extreme one sided trend and very low volatility can reduce mean reversion edges. Results vary by symbol and venue. Past results never guarantee future outcomes.
Open source reuse and credits
None.
Backtest realism
Costs are realistic for liquid equities. Sizing does not exceed five percent per trade by default. Any departure should be justified by the user.
If you got any questions please le me know

Corpus Bollinger BandsThis is a copy of the build-in indicator, but as addition, it shows the distance between upper and lower band in percentage.
Bollinger Band Screener [Pineify]Multi-Symbol Bollinger Band Screener Pineify – Advanced Multi-Timeframe Market Analysis
Unlock the power of rapid, multi-asset scanning with this original TradingView Pine Script. Expose trends, volatility, and reversals across your favorite tickers—all in a single, customizable dashboard.
Key Features
Screens up to 8 symbols simultaneously with individual controls.
Covers 4 distinct timeframes per symbol for robust, multi-timeframe analysis.
Integrates advanced Bollinger Band logic, adaptable with 11+ moving average types (SMA, EMA, RMA, HMA, WMA, VWMA, TMA, VAR, WWMA, ZLEMA, and TSF).
Visualizes precise state changes: Open/Parallel Uptrends & Downtrends, Consolidation, Breakouts, and more.
Highly interactive table view for instant signal interpretation and actionable alerts.
Flexible to any market: crypto, stocks, forex, indices, and commodities.
How It Works
For each chosen symbol and timeframe, the script calculates Bollinger Bands using your specified source, length, standard deviation, and moving average method.
Real-time state recognition assigns one of several states (Open Rising, Open Falling, Parallel Rising, Parallel Falling), painting the table with unique color codes.
State detection is rigorously defined: e.g., “Open Rising” is set when both bands and the basis rise, indicating strong up momentum.
All bands, signals, and strategies dynamically update as new bars print or user inputs change.
Trading Ideas and Insights
Identify volatility expansions and compressions instantly, spotting breakouts and breakdowns before they play out.
Spot multi-timeframe confluences—when trends align across several TFs, conviction increases for potential trades.
Trade reversals or continuations based on unique Bollinger Band patterns, such as squeeze-break or persistent parallel moves.
Harness this tool for scalping, swing trading, or systematic portfolio screens—your logic, your edge!
How Multiple Indicators Work Together
This screener’s core strength is its integration of multiple moving average types into Bollinger Band construction, not just standard SMA. Each average adapts the bands’ responsiveness to trend and noise, so traders can select the underlying logic that matches their market environment (e.g., HMA for fast moves or ZLEMA for smoothed lag). Overlaying 4 timeframes per symbol ensures trends, reversals, and volatility shifts never slip past your radar. When all MAs and bands synchronize across symbols and TFs, it becomes easy to separate real opportunity from market noise.
Unique Aspects
Perhaps the most flexible Bollinger Band screener for TradingView—choose from over 10 moving average methods.
Powerful multi-timeframe and multi-asset design, rare among Pine scripts.
Immediate visual clarity with color-coded table cells indicating band state—no need for guesswork or chart clutter.
Custom configuration for each asset and time slice to suit any trading style.
How to Use
Add the script to your TradingView chart.
Use the user-friendly input settings to specify up to 8 symbols and 4 timeframes each.
Customize the Bollinger Band parameters: source (price type), band length, standard deviation, and type of moving average.
Interpret the dashboard: Color codes and “state” abbreviations show you instantly which symbols and timeframes are trending, consolidating, or breaking out.
Take trades according to your strategy, using the screener as a confirmation or primary scan tool.
Customization
Fully customize: symbols, timeframes, source, band length, standard deviation multiplier, and moving average type.
Supports intricate watchlists—anything TradingView allows, this script tracks.
Adapt for cryptos, equities, forex, or derivatives by changing symbol inputs.
Conclusion
The Multi-Symbol Bollinger Band Screener “Pineify” is a comprehensive, SEO-optimized Pine Script tool to supercharge your market scanning, trend spotting, and decision-making on TradingView. Whether you trade crypto, stocks, or forex—its fast, intuitive, multi-timeframe dashboard gives you the informational edge to stay ahead of the market.
Try it now to streamline your trading workflow and see all the bands, all the trends, all the time!

RSI Bollinger Bands [DCAUT]█ RSI Bollinger Bands
📊 ORIGINALITY & INNOVATION
The RSI Bollinger Bands indicator represents a meaningful advancement in momentum analysis by combining two proven technical tools: the Relative Strength Index (RSI) and Bollinger Bands. This combination addresses a significant limitation in traditional RSI analysis - the use of fixed overbought/oversold thresholds (typically 70/30) that fail to adapt to changing market volatility conditions.
Core Innovation:
Rather than relying on static threshold levels, this indicator applies Bollinger Bands statistical analysis directly to RSI values, creating dynamic zones that automatically adjust based on recent momentum volatility. This approach helps reduce false signals during low volatility periods while remaining sensitive to genuine extremes during high volatility conditions.
Key Enhancements Over Traditional RSI:
Dynamic Thresholds: Overbought/oversold zones adapt to market conditions automatically, eliminating the need for manual threshold adjustments across different instruments and timeframes
Volatility Context: Band width provides immediate visual feedback about momentum volatility, helping traders distinguish between stable trends and erratic movements
Reduced False Signals: During ranging markets, narrower bands filter out minor RSI fluctuations that would trigger traditional fixed-threshold signals
Breakout Preparation: Band squeeze patterns (similar to price-based BB) signal potential momentum regime changes before they occur
Self-Referencing Analysis: By measuring RSI against its own statistical behavior rather than arbitrary levels, the indicator provides more relevant context
📐 MATHEMATICAL FOUNDATION
Two-Stage Calculation Process:
Stage 1: RSI Calculation
RSI = 100 - (100 / (1 + RS))
where RS = Average Gain / Average Loss over specified period
The RSI normalizes price momentum into a bounded 0-100 scale, making it ideal for statistical band analysis.
Stage 2: Bollinger Bands on RSI
Basis = MA(RSI, BB Length)
Upper Band = Basis + (StdDev(RSI, BB Length) × Multiplier)
Lower Band = Basis - (StdDev(RSI, BB Length) × Multiplier)
Band Width = Upper Band - Lower Band
The Bollinger Bands measure RSI's standard deviation from its own moving average, creating statistically-derived dynamic zones.
Statistical Interpretation:
Under normal distribution assumptions with default 2.0 multiplier, approximately 95% of RSI values should fall within the bands
Band touches represent statistically significant momentum extremes relative to recent behavior
Band width expansion indicates increasing momentum volatility (strengthening trend or increasing uncertainty)
Band width contraction signals momentum consolidation and potential regime change preparation
📊 COMPREHENSIVE SIGNAL ANALYSIS
Visual Color Signals:
This indicator features dynamic color fills that highlight extreme momentum conditions:
Green Fill (Above Upper Band):
Appears when RSI breaks above the upper band, indicating exceptionally strong bullish momentum
Represents dynamic overbought zone - not necessarily a reversal signal but a warning of extreme conditions
In strong uptrends, green fills can persist as RSI "rides the band" - this indicates sustained momentum strength
Exit of green zone (RSI falling back below upper band) often signals initial momentum weakening
Red Fill (Below Lower Band):
Appears when RSI breaks below the lower band, indicating exceptionally weak bearish momentum
Represents dynamic oversold zone - potential reversal or continuation signal depending on trend context
In strong downtrends, red fills can persist as RSI "rides the band" - this indicates sustained selling pressure
Exit of red zone (RSI rising back above lower band) often signals initial momentum recovery
Position-Based Signals:
Upper Band Interactions:
RSI Touching Upper Band: Dynamic overbought condition - momentum is extremely strong relative to recent volatility, potential exhaustion or continuation depending on trend context
RSI Riding Upper Band: Sustained strong momentum, often seen in powerful trends, not necessarily an immediate reversal signal but warrants monitoring for exhaustion
RSI Crossing Below Upper Band: Initial momentum weakening signal, particularly significant if accompanied by price divergence
Lower Band Interactions:
RSI Touching Lower Band: Dynamic oversold condition - momentum is extremely weak relative to recent volatility, potential reversal or continuation of downtrend
RSI Riding Lower Band: Sustained weak momentum, common in strong downtrends, monitor for potential exhaustion
RSI Crossing Above Lower Band: Initial momentum strengthening signal, early indication of potential reversal or consolidation
Basis Line Signals:
RSI Above Basis: Bullish momentum regime - upward pressure dominant
RSI Below Basis: Bearish momentum regime - downward pressure dominant
Basis Crossovers: Momentum regime shifts, more significant when accompanied by band width changes
RSI Oscillating Around Basis: Balanced momentum, often indicates ranging market conditions
Volatility-Based Signals:
Band Width Patterns:
Narrow Bands (Squeeze): Momentum volatility compression, often precedes significant directional moves, similar to price coiling patterns
Expanding Bands: Increasing momentum volatility, indicates trend acceleration or growing uncertainty
Narrowest Band in 100 Bars: Extreme compression alert, high probability of upcoming volatility expansion
Advanced Pattern Recognition:
Divergence Analysis:
Bullish Divergence: Price makes lower lows while RSI touches or stays above previous lower band touch, suggests downward momentum weakening
Bearish Divergence: Price makes higher highs while RSI touches or stays below previous upper band touch, suggests upward momentum weakening
Hidden Bullish: Price makes higher lows while RSI makes lower lows at the lower band, indicates strong underlying bullish momentum
Hidden Bearish: Price makes lower highs while RSI makes higher highs at the upper band, indicates strong underlying bearish momentum
Band Walk Patterns:
Upper Band Walk: RSI consistently touching or staying near upper band indicates exceptionally strong trend, wait for clear break below basis before considering reversal
Lower Band Walk: RSI consistently at lower band signals very weak momentum, requires break above basis for reversal confirmation
🎯 STRATEGIC APPLICATIONS
Strategy 1: Mean Reversion Trading
Setup Conditions:
Market Type: Ranging or choppy markets with no clear directional trend
Timeframe: Works best on lower timeframes (5m-1H) or during consolidation phases
Band Characteristic: Normal to narrow band width
Entry Rules:
Long Entry: RSI touches or crosses below lower band, wait for RSI to start rising back toward basis before entry
Short Entry: RSI touches or crosses above upper band, wait for RSI to start falling back toward basis before entry
Confirmation: Use price action confirmation (candlestick reversal patterns) at band touches
Exit Rules:
Target: RSI returns to basis line or opposite band
Stop Loss: Fixed percentage or below recent swing low/high
Time Stop: Exit if position not profitable within expected timeframe
Strategy 2: Trend Continuation Trading
Setup Conditions:
Market Type: Clear trending market with higher highs/lower lows
Timeframe: Medium to higher timeframes (1H-Daily)
Band Characteristic: Expanding or wide bands indicating strong momentum
Entry Rules:
Long Entry in Uptrend: Wait for RSI to pull back to basis line or slightly below, enter when RSI starts rising again
Short Entry in Downtrend: Wait for RSI to rally to basis line or slightly above, enter when RSI starts falling again
Avoid Counter-Trend: Do not fade RSI at bands during strong trends (band walk patterns)
Exit Rules:
Trailing Stop: Move stop to break-even when RSI reaches opposite band
Trend Break: Exit when RSI crosses basis against trend direction with conviction
Band Squeeze: Reduce position size when bands start narrowing significantly
Strategy 3: Breakout Preparation
Setup Conditions:
Market Type: Consolidating market after significant move or at key technical levels
Timeframe: Any timeframe, but longer timeframes provide more reliable breakouts
Band Characteristic: Narrowest band width in recent 100 bars (squeeze alert)
Preparation Phase:
Identify band squeeze condition (bands at multi-period narrowest point)
Monitor price action for consolidation patterns (triangles, rectangles, flags)
Prepare bracket orders for both directions
Wait for band expansion to begin
Entry Execution:
Breakout Confirmation: Enter in direction of RSI band breakout (RSI breaks above upper band or below lower band)
Price Confirmation: Ensure price also breaks corresponding technical level
Volume Confirmation: Look for volume expansion supporting the breakout
Risk Management:
Stop Loss: Place beyond consolidation pattern opposite extreme
Position Sizing: Use smaller size due to false breakout risk
Quick Exit: Exit immediately if RSI returns inside bands within 1-3 bars
Strategy 4: Multi-Timeframe Analysis
Timeframe Selection:
Higher Timeframe: Daily or 4H for trend context
Trading Timeframe: 1H or 15m for entry signals
Confirmation Timeframe: 5m or 1m for precise entry timing
Analysis Process:
Trend Identification: Check higher timeframe RSI position relative to bands, trade only in direction of higher timeframe momentum
Setup Formation: Wait for trading timeframe RSI to show pullback to basis in trending direction
Entry Timing: Use confirmation timeframe RSI band touch or crossover for precise entry
Alignment Confirmation: All timeframes should show RSI moving in same direction for highest probability setups
📋 DETAILED PARAMETER CONFIGURATION
RSI Source:
Close (Default): Standard price point, balances responsiveness and reliability
HL2: Reduces noise from intrabar volatility, provides smoother RSI values
HLC3 or OHLC4: Further smoothing for very choppy markets, slower to respond but more stable
Volume-Weighted: Consider using VWAP or volume-weighted prices for additional liquidity context
RSI Length Parameter:
Shorter Periods (5-10): More responsive but generates more signals, suitable for scalping or very active trading, higher noise level
Standard (14): Default and most widely used setting, proven balance between responsiveness and reliability, recommended starting point
Longer Periods (21-30): Smoother momentum measurement, fewer but potentially more reliable signals, better for swing trading or position trading
Optimization Note: Test across different market regimes, optimal length often varies by instrument volatility characteristics
RSI MA Type Parameter:
RMA (Default): Wilder's original smoothing method, provides traditional RSI behavior with balanced lag, most widely recognized and tested, recommended for standard technical analysis
EMA: Exponential smoothing gives more weight to recent values, faster response to momentum changes, suitable for active trading and trending markets, reduces lag compared to RMA
SMA: Simple average treats all periods equally, smoothest output with highest lag, best for filtering noise in choppy markets, useful for long-term position analysis
WMA: Weighted average emphasizes recent data less aggressively than EMA, middle ground between SMA and EMA characteristics, balanced responsiveness for swing trading
Advanced Options: Full access to 25+ moving average types including HMA (reduced lag), DEMA/TEMA (enhanced responsiveness), KAMA/FRAMA (adaptive behavior), T3 (smoothness), Kalman Filter (optimal estimation)
Selection Guide: RMA for traditional analysis and backtesting consistency, EMA for faster signals in trending markets, SMA for stability in ranging markets, adaptive types (KAMA/FRAMA) for varying volatility regimes
BB Length Parameter:
Short Length (10-15): Tighter bands that react quickly to RSI changes, more frequent band touches, suitable for active trading styles
Standard (20): Balanced approach providing meaningful statistical context without excessive lag
Long Length (30-50): Smoother bands that filter minor RSI fluctuations, captures only significant momentum extremes, fewer but higher quality signals
Relationship to RSI Length: Consider BB Length greater than RSI Length for cleaner signals
BB MA Type Parameter:
SMA (Default): Standard Bollinger Bands calculation using simple moving average for basis line, treats all periods equally, widely recognized and tested approach
EMA: Exponential smoothing for basis line gives more weight to recent RSI values, creates more responsive bands that adapt faster to momentum changes, suitable for trending markets
RMA: Wilder's smoothing provides consistent behavior aligned with traditional RSI when using RMA for both RSI and BB calculations
WMA: Weighted average for basis line balances recent emphasis with historical context, middle ground between SMA and EMA responsiveness
Advanced Options: Full access to 25+ moving average types for basis calculation, including HMA (reduced lag), DEMA/TEMA (enhanced responsiveness), KAMA/FRAMA (adaptive to volatility changes)
Selection Guide: SMA for standard Bollinger Bands behavior and backtesting consistency, EMA for faster band adaptation in dynamic markets, matching RSI MA type creates unified smoothing behavior
BB Multiplier Parameter:
Conservative (1.5-1.8): Tighter bands resulting in more frequent touches, useful in low volatility environments, higher signal frequency but potentially more false signals
Standard (2.0): Default setting representing approximately 95% confidence interval under normal distribution, widely accepted statistical threshold
Aggressive (2.5-3.0): Wider bands capturing only extreme momentum conditions, fewer but potentially more significant signals, reduces false signals in high volatility
Adaptive Approach: Consider adjusting multiplier based on instrument characteristics, lower multiplier for stable instruments, higher for volatile instruments
Parameter Optimization Workflow:
Start with default parameters (RSI:14, BB:20, Mult:2.0)
Test across representative sample period including different market regimes
Adjust RSI length based on desired responsiveness vs stability tradeoff
Tune BB length to match your typical holding period
Modify multiplier to achieve desired signal frequency
Validate on out-of-sample data to avoid overfitting
Document optimal parameters for different instruments and timeframes
Reference Levels Display:
Enabled (Default): Shows traditional 30/50/70 levels for comparison with dynamic bands, helps visualize the adaptive advantage
Disabled: Cleaner chart focusing purely on dynamic zones, reduces visual clutter for experienced users
Educational Value: Keeping reference levels visible helps understand how dynamic bands differ from fixed thresholds across varying market conditions
📈 PERFORMANCE ANALYSIS & COMPETITIVE ADVANTAGES
Comparison with Traditional RSI:
Fixed Threshold RSI Limitations:
In ranging low-volatility markets: RSI rarely reaches 70/30, missing tradable extremes
In trending high-volatility markets: RSI frequently breaks through 70/30, generating excessive false reversal signals
Across different instruments: Same thresholds applied to volatile crypto and stable forex pairs produce inconsistent results
Threshold Adjustment Problem: Manually changing thresholds for different conditions is subjective and lagging
RSI Bollinger Bands Advantages:
Automatic Adaptation: Bands adjust to current volatility regime without manual intervention
Consistent Logic: Same statistical approach works across different instruments and timeframes
Reduced False Signals: Band width filtering helps distinguish meaningful extremes from noise
Additional Information: Band width provides volatility context missing in standard RSI
Objective Extremes: Statistical basis (standard deviations) provides objective extreme definition
Comparison with Price-Based Bollinger Bands:
Price BB Characteristics:
Measures absolute price volatility
Affected by large price gaps and outliers
Band position relative to price not normalized
Difficult to compare across different price scales
RSI BB Advantages:
Normalized Scale: RSI's 0-100 bounds make band interpretation consistent across all instruments
Momentum Focus: Directly measures momentum extremes rather than price extremes
Reduced Gap Impact: RSI calculation smooths price gaps impact on band calculations
Comparable Analysis: Same RSI BB appearance across stocks, forex, crypto enables consistent strategy application
Performance Characteristics:
Signal Quality:
Higher Signal-to-Noise Ratio: Dynamic bands help filter RSI oscillations that don't represent meaningful extremes
Context-Aware Alerts: Band width provides volatility context helping traders adjust position sizing and stop placement
Reduced Whipsaws: During consolidations, narrower bands prevent premature signals from minor RSI movements
Responsiveness:
Adaptive Lag: Band calculation introduces some lag, but this lag is adaptive to current conditions rather than fixed
Faster Than Manual Adjustment: Automatic band adjustment is faster than trader's ability to manually modify thresholds
Balanced Approach: Combines RSI's inherent momentum lag with BB's statistical smoothing for stable yet responsive signals
Versatility:
Multi-Strategy Application: Supports both mean reversion (ranging markets) and trend continuation (trending markets) approaches
Universal Instrument Coverage: Works effectively across equities, forex, commodities, cryptocurrencies without parameter changes
Timeframe Agnostic: Same interpretation applies from 1-minute charts to monthly charts
Limitations and Considerations:
Known Limitations:
Dual Lag Effect: Combines RSI's momentum lag with BB's statistical lag, making it less suitable for very short-term scalping
Requires Volatility History: Needs sufficient bars for BB calculation, less effective immediately after major regime changes
Statistical Assumptions: Assumes RSI values are somewhat normally distributed, extreme trending conditions may violate this
Not a Standalone System: Like all indicators, should be combined with price action analysis and risk management
Optimal Use Cases:
Best for swing trading and position trading timeframes
Most effective in markets with alternating volatility regimes
Ideal for traders who use multiple instruments and timeframes
Suitable for systematic trading approaches requiring consistent logic
Suboptimal Conditions:
Very low timeframes (< 5 minutes) where lag becomes problematic
Instruments with extreme volatility spikes (gap-prone markets)
Markets in strong persistent trends where mean reversion rarely occurs
Periods immediately following major structural changes (new trading regime)
USAGE NOTES
This indicator is designed for technical analysis and educational purposes to help traders understand the interaction between momentum measurement and statistical volatility bands. The RSI Bollinger Bands has limitations and should not be used as the sole basis for trading decisions.
Important Considerations:
No Predictive Guarantee: Past band touches and patterns do not guarantee future price behavior
Market Regime Dependency: Indicator performance varies significantly between trending and ranging market conditions
Complementary Analysis Required: Should be used alongside price action, support/resistance levels, and fundamental analysis
Risk Management Essential: Always use proper position sizing, stop losses, and risk controls regardless of signal quality
Parameter Sensitivity: Different instruments and timeframes may require parameter optimization for optimal results
Continuous Monitoring: Band characteristics change with market conditions, requiring ongoing assessment
Recommended Supporting Analysis:
Price structure analysis (support/resistance, trend lines)
Volume confirmation for breakout signals
Multiple timeframe alignment
Market context awareness (news events, session times)
Correlation analysis with related instruments
The indicator aims to provide adaptive momentum analysis that adjusts to changing market volatility, but traders must apply sound judgment, proper risk management, and comprehensive market analysis in their decision-making process.

BBMA OA - AI GPT-5This indicator is an AI-assisted implementation of the BBMA OA (Bollinger Bands + Moving Average) trading strategy, originally introduced by Malaysian trader Oma Ally. The code was generated and optimized using the GPT-5 AI model to ensure clean Pine Script v6 structure and compatibility.
The system combines Bollinger Bands (20, 2) with EMA50, EMA200, and MA5/10 High-Low to identify the four main BBMA OA patterns:
Extreme
Market Hilang Volume (MHV)
Candle Arah Kukuh (CSAK)
Re-entry (RRE, REE, REM)
Features:
Multi Time Frame confirmation for higher accuracy
Automatic signal detection with visual markers
Trend ribbon and candle coloring
Optimized Pine Script v6, free from errors/warnings
⚠ This is an adaptation of Oma Ally’s concept for educational purposes, not an official version. Past performance does not guarantee future results.
Bollinger Bands - Multi Symbol Alert (Miu)This script extends the classic Bollinger Bands indicator with support for up to 8 user-defined symbols and a unique alert system.
Unlike traditional Bollinger Band indicators, it allows traders to configure alerts across multiple assets without keeping the indicator visible on the chart, making it ideal for passive multi-asset monitoring.
What it does:
This script calculates Bollinger Bands using a 100-period simple moving average and a standard deviation multiplier of 3 (or any input you set in the settings panel).
For each selected symbol, the upper and lower bands are retrieved using request.security() and monitored for breakouts.
Alerts are triggered when the closing price of the selected symbol breaks above the upper band (Overbought) or below the lower band (Oversold) — at the bar close.
How to use it:
1) Add the indicator to your chart.
2) Open the settings panel.
3) Select up to 8 symbols to monitor.
4) After setting parameters, click the three dots next to the indicator title and choose "Add Alert on...".
5) Name your alert and confirm.
6) If you don’t wish to keep the indicator visible, you can remove it from the chart — alerts will still function as expected.
Alert message includes:
- Symbol name (e.g., BTC, ETH, LTC)
- (OB) for overbought or (OS) for oversold
- Symbol’s price at the alert moment
Technical note:
This script uses request.security() to fetch Bollinger Band levels and closing prices from up to 8 selected symbols in real time.
Feel free to leave your feedback or suggestions in the comments section below.
Enjoy!
Waldo Momentum Cloud Bollinger Bands (WMCBB)
Title: Waldo Momentum Cloud Bollinger Bands (WMCBB)
Description:
Introducing the "Waldo Momentum Cloud Bollinger Bands (WMCBB)," an innovative trading tool crafted for those who aim to deepen their market analysis by merging two dynamic technical indicators: Dynamic RSI Bollinger Bands and the Waldo Cloud.
What is this Indicator?
WMCBB integrates the volatility-based traditional Bollinger Bands with a momentum-sensitive approach through the Relative Strength Index (RSI). Here’s how it works:
Dynamic RSI Bollinger Bands: These bands dynamically adjust according to the RSI, which tracks the momentum of price movements. By scaling the RSI to align with price levels, we generate bands that not only reflect market volatility but also the underlying momentum, offering a refined view of overbought and oversold conditions.
Waldo Cloud: This feature adds a layer of traditional Bollinger Bands, visualized as a 'cloud' on your chart. It employs standard Bollinger Band methodology but enhances it with additional moving average layers to better define market trends.
The cloud's color changes dynamically based on various market conditions, providing visual signals for trend direction and potential trend reversals.
Why Combine These Indicators?
Combining Dynamic RSI Bollinger Bands with the Waldo Cloud in WMCBB aims to:
Enhance Trend Identification: The Waldo Cloud's color-coded system aids in recognizing the overarching market trend, while the Dynamic RSI Bands give insights into momentum changes within that trend, offering a comprehensive view.
Improve Volatility and Momentum Analysis: While traditional Bollinger Bands measure market volatility, integrating RSI adds a layer of momentum analysis, potentially leading to more accurate trading signals.
Visual Clarity: The unified color scheme for both sets of bands, which changes according to RSI levels, moving average crossovers, and price positioning, simplifies the process of gauging market sentiment at a glance.
Customization: Users have the option to toggle the visibility of moving averages (MA) through the settings, allowing for tailored analysis based on individual trading strategies.
Usage:
Utilize WMCBB to identify potential trend shifts by observing price interactions with the dynamic bands or changes in the Waldo Cloud's color.
Watch for divergences between price movements and RSI to forecast potential market reversals or continuations.
This combination shines in sideways markets where traditional indicators might fall short, as it provides additional context through RSI momentum analysis.
Settings:
Customize parameters for both the Dynamic RSI and Waldo Cloud Bollinger Bands, including the calculation source, standard deviation factors, and moving average lengths.
WMCBB is perfect for traders seeking to enhance their market analysis through the synergy of momentum and volatility, all while maintaining visual simplicity. Trade with greater insight using the Waldo Momentum Cloud Bollinger Bands!

Dynamic RSI Bollinger Bands with Waldo Cloud
TradingView Indicator Description: Dynamic RSI Bollinger Bands with Waldo Cloud
Title: Dynamic RSI Bollinger Bands with Waldo Cloud
Short Title: Dynamic RSI BB Waldo
Overview:
Introducing an experimental indicator, the Dynamic RSI Bollinger Bands with Waldo Cloud, designed for adventurous traders looking to explore new dimensions in technical analysis. This indicator overlays on your chart, providing a unique perspective by integrating the Relative Strength Index (RSI) with Bollinger Bands, creating a dynamic trading tool that adapts to market conditions through the lens of momentum and volatility.
What is it?
This innovative indicator combines the traditional Bollinger Bands with the RSI in a way that hasn't been commonly explored. Here's a breakdown:
RSI Integration: The RSI is calculated with customizable length settings, and its values are used not just for momentum analysis but as the basis for the Bollinger Bands. This means the position and width of the bands are directly influenced by the RSI, offering a visual representation of momentum within the context of price volatility.
Dynamic Bollinger Bands: Instead of using price directly, the Bollinger Bands are calculated using a scaled version of the RSI. This scaling is done to fit the RSI values into the price range, ensuring the bands are relevant to the actual price movement. The standard deviation for these bands is also scaled accordingly, providing a unique volatility measure that's momentum-driven.
Waldo Cloud: Named after a visual representation concept, the 'Waldo Cloud' refers to the colored area between the Bollinger Bands, which changes based on various conditions:
Purple when RSI is overbought.
Blue when RSI is oversold.
Green for bullish conditions, defined by the fast-moving average crossing above the slow one, RSI is bullish, and the price is above the slow MA.
Red for bearish conditions, when the fast MA crosses below the slow MA, the RSI is bearish, and the price is below the slow MA.
Gray for neutral market conditions.
Moving Averages: Two simple moving averages (Fast MA and Slow MA) are included, which can be toggled on or off, offering additional trend analysis through crossovers.
How to Use It:
Given its experimental nature, this indicator should be used with caution and in conjunction with other analysis methods:
Identifying Market Conditions: Use the color of the Waldo Cloud to gauge market sentiment. A green cloud might suggest a good time to consider long positions, while a red cloud could indicate potential shorting opportunities. Purple and blue clouds highlight extreme conditions that might precede reversals.
Volatility and Momentum: The dynamic nature of the Bollinger Bands based on RSI provides insight into how momentum is affecting price volatility. When the bands are wide, it might indicate high momentum and potential trend continuation or reversal, depending on the RSI's position relative to its overbought/oversold levels.
Trend Confirmation: The moving average crossovers can act as confirmation signals. For instance, a bullish crossover (fast MA over slow MA) within a green cloud might strengthen a buy signal, whereas a bearish crossover in a red cloud might reinforce a sell decision.
Customization: Adjust the RSI length, overbought/oversold levels, and moving average lengths to suit different trading styles or market conditions. Experiment with these settings to find what works best for your strategy.
Combining with Other Indicators: Since this is an experimental tool, it's advisable to use it alongside established indicators like traditional Bollinger Bands, MACD, or trend lines to validate signals.
Conclusion:
The Dynamic RSI Bollinger Bands with Waldo Cloud is an experimental venture into combining momentum with volatility visually and interactively. It's designed for traders who are open to exploring new methods of market analysis.
Remember, due to its experimental status, this indicator should be part of a broader trading strategy, and backtesting or paper trading is recommended before applying it in live trading scenarios. Keep an eye on how the market reacts to the signals provided by this indicator and always consider risk management practices.

Waldo Cloud Bollinger Bands
Waldo Cloud Bollinger Bands Indicator Description for TradingView
Title: Waldo Cloud Bollinger Bands
Short Title: Waldo Cloud BB
Overview:
The Waldo Cloud Bollinger Bands indicator is a sophisticated tool designed for traders looking to combine the volatility analysis of Bollinger Bands with the momentum insights of the Relative Strength Index (RSI) and moving average crossovers. This indicator overlays on your chart, providing a visual representation that helps in identifying potential trading opportunities based on price action, momentum, and trend direction.
Concept:
This indicator merges three key technical analysis concepts:
Bollinger Bands: These are used to measure market volatility. The bands consist of a central moving average (basis) with an upper and lower band that are standard deviations away from this average. In this indicator, you can customize the type of moving average used for the basis (SMA, EMA, SMMA, WMA, VWMA), the length of the period, the source price, and the standard deviation multiplier, offering flexibility to adapt to different market conditions.
Relative Strength Index (RSI): The RSI is incorporated to provide insight into the momentum of price movements. Users can adjust the RSI length and overbought/oversold levels and even choose the price source for RSI calculation, allowing for tailored momentum analysis. The RSI values influence the cloud color between the Bollinger Bands, signaling market conditions.
Moving Average Crossovers: Two moving averages with customizable lengths and types are used to identify trend direction through crossovers. A fast MA (default 20 periods) and a slow MA (default 50 periods) are plotted when enabled, helping to signal potential bullish or bearish market conditions when they cross over each other.
Functionality:
Bollinger Bands Calculation: The basis of the Bollinger Bands is calculated using a user-defined moving average type, with a customizable length, source, and standard deviation multiplier. The upper and lower bands are then plotted around this basis.
RSI Calculation: The RSI is computed using a user-specified source, length, and overbought/oversold levels. This RSI value is used to determine the color of the cloud between the Bollinger Bands, which visually represents market sentiment:
Purple when RSI is overbought.
Blue when RSI is oversold.
Green for bullish conditions (when the fast MA crosses above the slow MA, RSI is bullish, and the price is above the slow MA).
Red for bearish conditions (when the fast MA crosses below the slow MA, RSI is bearish, and the price is below the slow MA).
Gray for neutral conditions.
Trend Analysis: The indicator uses two moving averages to help determine the trend direction.
When the fast MA crosses over the slow MA, it suggests a potential change in trend direction, which, combined with RSI conditions, provides a more comprehensive trading signal.
Customization:
Users can select the type of moving average for all calculations through the "Global MA Type" setting, ensuring consistency in how trends and volatility are interpreted.
The Bollinger Bands settings allow for adjustments in length, source, standard deviation, and offset, giving traders control over how volatility is measured.
RSI settings include the ability to change the RSI source, length, and overbought/oversold thresholds, which can be fine-tuned to match trading strategies.
The option to show or hide moving averages provides clarity on the chart, focusing on either the Bollinger Bands or including the MA crossovers for trend analysis.
Usage:
This indicator is ideal for traders who incorporate both volatility and momentum in their trading decisions.
By observing the color changes in the cloud, along with the position of the price relative to the moving averages, traders can gauge potential entry and exit points.
For instance, a green cloud with a price above the slow MA might suggest a strong buying opportunity, while a red cloud with a price below might indicate selling pressure.
Conclusion:
The Waldo Cloud Bollinger Bands indicator offers a unique blend of volatility, momentum, and trend analysis, providing traders with a multi-faceted view of market conditions. Its customization options make it adaptable to various trading styles and market environments, making it a valuable addition to any trader's toolkit on Trading View.

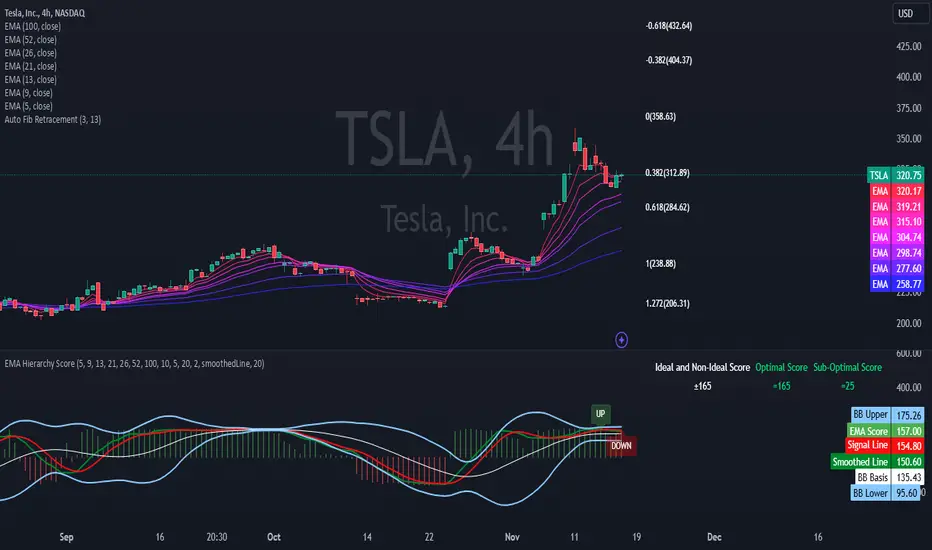
EMA Hierarchy Score V.1.0
EMA Hierarchy Score V.1.0
Purpose
The EMA Hierarchy Score indicator assesses the relative positioning of multiple Exponential Moving Averages (EMAs) for a financial asset. This tool provides insights into trend strength by calculating ideal and non-ideal configurations of EMAs, allowing for effective interpretation when used alongside standard EMA charts.
Variables and Inputs
The indicator organizes a set of EMAs and other metrics into a hierarchy for scoring:
* Primary Variables (A–J):
A: Close price
B: Open price
C: Previous close price
D to J: EMAs of configurable periods (5, 9, 13, 21, 26, 52, 100).
* User Inputs:
* Customizable periods for each EMA, allowing users to adjust the indicator’s sensitivity.
* Customizable period and standard deviation multiplier for Bollinger Bands, enabling further control over the indicator’s analysis.
Mathematical Method
The EMA Hierarchy Score calculates how closely the current EMA structure aligns with an “ideal” configuration through a structured scoring system:
1- Hierarchy Scoring:
* Ideal Order: Defined as A > B > C > D > E > F > G > H > I > J, representing a strong upward trend where each EMA progressively increases.
* Non-Ideal Order: Defined as J > I > H > G > F > E > D > C > B > A, indicating a weak or downward trend where each EMA progressively decreases.
* Optimal Order: Calculated based on achieving maximum alignment with the ideal configuration for each EMA across the chosen period.
* Sub-Optimal Order: The least-aligned structure across the same period.
2- Score Calculation:
* The indicator calculates a score by comparing all EMA pairs in values. For each comparison, a score increment of +1 (ideal) or -1 (non-ideal) is applied.
* The final score reflects the EMA configuration’s deviation from the ideal order:
- Positive Score: Indicates closer alignment with the ideal structure.
- Negative Score: Indicates deviation toward a non-ideal structure.
3- Smoothed and Signal Lines:
* A smoothed score is created using a Simple Moving Average (SMA) of the raw hierarchy score.
* A signal line (an SMA of the smoothed score) further aids in tracking directional shifts in the score.
4- Trend Labels and Bollinger Bands:
* Trend Labels: Display "UP" or "DOWN" based on the smoothed score’s relationship to the signal line.
* Bollinger Bands: Plotted around a selected source (smoothedLine, signalLine, or score) to analyze score volatility and deviations from the mean. The period and standard deviation multiplier for Bollinger Bands are user-configurable.
Result Definition
The Ideal and Non-Ideal Scores represent the upper and lower bounds of achievable configurations, ensuring the score does not exceed these values.
1- Ideal and Non-Ideal Result:
* Calculated based on how closely the current EMA configuration follows the “ideal” ascending or descending order.
* Ideal Score: Defined as +165, representing perfect alignment with the ideal configuration.
* Non-Ideal Score: Defined as -165, indicating full alignment with the descending, non-ideal structure.
* The score is bounded by these values and will not go above or below this range.
2- Optimal and Sub-Optimal Scores:
* Optimal Score: The highest score over the selected scoring period, calculated with the same period as the Bollinger Bands. Using consistent periods reinforces the reliability of the score by aligning with the period already used to gauge volatility.
* Sub-Optimal Score: The lowest score over the same period, capturing points of minimal alignment with the ideal order.
Interpretation and Analysis
1- Use with EMA Charts:
* This indicator is designed to be used alongside EMA charts, as its results provide insights into the relative order of EMAs and their alignment with trend strength.
* The EMA Hierarchy Score interprets the underlying EMA structure, offering additional context on whether current trends are aligned with optimal or non-optimal EMA configurations.
2- Ideal and Non-Ideal Analysis:
* A positive EMA Hierarchy Score indicates an orderly, ideal upward trend, suggesting stronger alignment with the ideal structure.
* A negative score signals a potential downward trend or deviation from the ideal structure.
3 - Trend Indicators and Bands:
* Trend Labels: The "UP" and "DOWN" labels offer real-time feedback on trend direction shifts, based on the smoothed score and signal line relationship.
* Bollinger Bands: Visualize the range of score fluctuations, helping to identify breakout or breakdown points.
4 - Optimal and Sub-Optimal Scores:
* Use the Optimal Score to understand peak trend alignment and Sub-Optimal Score to spot potential reversal or correction zones.
* A consistently high score over time indicates trend stability, while variations may suggest instability.
Quick Reference Table
The table displayed at the top right provides an at-a-glance view of key metrics:
* Ideal and Non-Ideal Score: Fixed at ±165 to represent the calculated ideal and non-ideal configuration.
* Optimal and Sub-Optimal Scores: Show maximum and minimum scores over the scoring period, color-coded green for positive and red for negative values.
This concise table helps users quickly assess indicator values, reducing the need to interpret multiple chart lines and making it easier to understand overall trend strength.
Disclaimer
The EMA Hierarchy Score V.1.0 is a technical analysis tool designed to assist in understanding the alignment and strength of trends as defined by EMA configurations. This indicator does not constitute investment advice, nor does it make specific recommendations for buying or selling assets. Users should consult with a financial advisor before making any trading decisions, as past performance or technical signals do not guarantee future results. The developers of this indicator disclaim all liability for potential financial losses arising from reliance on this tool. Users assume full responsibility for interpreting and applying the indicator’s outputs in their investment decisions.
TP RSITP RSI - Integrated Trend, Momentum, and Volatility Analyzer
The TP RSI indicator is an innovative 3-in-1 technical analysis tool that combines RSI, Bollinger Bands, and an EMA ribbon to provide traders with a comprehensive view of trend, momentum, and volatility in a single, easy-to-interpret visual display.
Why This Combination? This mashup addresses three critical aspects of market analysis simultaneously:
Trend identification and strength (EMA ribbon)
Momentum measurement (RSI)
Volatility assessment (Bollinger Bands)
By integrating these components, traders can make more informed decisions based on multiple factors without switching between different indicators.
How Components Work Together:
1. EMA Ribbon (Trend):
10 EMAs form 5 color-coded bands
Blue: Uptrend, Red: Downtrend
Provides a nuanced view of trend strength and potential reversals
2. RSI (Momentum):
Color-coded for quick interpretation
Blue: Upward momentum, Red: Downward momentum, White: Neutral
Position relative to the ribbon offers additional insight
3. Bollinger Bands (Volatility):
Applied to RSI for dynamic overbought/oversold levels
Narrow bands indicate low volatility, suggesting potential breakouts
Unique Aspects and Originality:
Synergistic visual cues: Color coordination between ribbon and RSI
Multi-factor confirmation: Requires alignment of trend, momentum, and volatility for strong signals
Volatility-adjusted momentum: RSI interpreted within the context of Bollinger Bands
How these components work together:
Buy Signal: Blue ribbon with blue RSI outside the ribbon.
Sell Signal: Red ribbon with red RSI outside the ribbon.
Neutral: White RSI or RSI inside the ribbon (not recommended for trading)
Increasing Momentum: RSI crossing above upper Bollinger Band (upward) or below lower Band (downward).
Trend Strength: RSI rejection by the ribbon, while all bands are colored along with the trend direction, identifies a strong trend.

Supertrend + BB + Consecutive Candles + QQE + EMA [Pineify]Overview
This indicator, developed by Pineify, is a comprehensive tool designed to assist traders in making informed decisions by combining multiple technical analysis methods. It integrates Supertrend, Bollinger Bands (BB), Consecutive Candles, Quantitative Qualitative Estimation (QQE), and Exponential Moving Averages (EMA) into a single, cohesive script. This multi-faceted approach allows traders to analyze market trends, volatility, and potential buy/sell signals with greater accuracy.
Key Features
1. Supertrend: Utilizes the Supertrend indicator to identify the prevailing market trend. It provides clear buy and sell signals based on the direction of the trend.
2. Bollinger Bands (BB): Measures market volatility and identifies overbought or oversold conditions. The script calculates the middle, upper, and lower bands, along with the Bollinger Band Width (BBW) and Bollinger Band %B (BBR).
3. Consecutive Candles: Detects sequences of consecutive bullish or bearish candles, providing signals when a specified number of consecutive candles are detected.
4. Quantitative Qualitative Estimation (QQE): Combines the Relative Strength Index (RSI) with a smoothing factor to generate buy and sell signals based on the QQE methodology.
5. Exponential Moving Averages (EMA): Includes both fast and slow EMAs to identify potential crossovers, which are used as buy and sell signals.
How It Works
- Supertrend: The Supertrend indicator is calculated using a factor and ATR length. It plots the trend direction and generates buy/sell signals when the trend changes.
- Bollinger Bands: The BB indicator calculates the middle band as a Simple Moving Average (SMA) of the closing prices. The upper and lower bands are derived by adding and subtracting a multiple of the standard deviation from the middle band.
- Consecutive Candles: This feature counts the number of consecutive candles that close higher or lower than the previous candle. When the count reaches a specified threshold, it generates a buy or sell signal.
- QQE: The QQE indicator smooths the RSI values and calculates the QQE Fast and QQE Slow lines. Buy and sell signals are generated based on the crossover of these lines.
- EMA: The script calculates fast and slow EMAs and generates buy/sell signals based on their crossovers.
How to Use
1. Inputs: Customize the indicator settings through the input parameters:
- Supertrend Factor and ATR Length
- BB Length
- Consecutive Candles Counting
- QQE RSI Length
- Fast and Slow EMA Lengths
- Enable/Disable Alerts for various signals
2. Alerts: Set up alerts for Supertrend, Consecutive Candles, and EMA crossovers. Alerts can be enabled or disabled based on user preference.
3. Visualization: The indicator plots the Supertrend, Bollinger Bands, and EMA lines on the chart. It also marks buy and sell signals with arrows and labels for easy identification.
Concepts Underlying Calculations
- Supertrend: Based on the Average True Range (ATR) to determine the trend direction and potential reversal points.
- Bollinger Bands: Utilizes standard deviation to measure market volatility and identify overbought/oversold conditions.
- Consecutive Candles: A method to detect momentum by counting consecutive bullish or bearish candles.
- QQE: Enhances the traditional RSI by smoothing it and using a dynamic threshold to generate signals.
- EMA: A widely used moving average that gives more weight to recent prices, making it responsive to market changes.
This indicator is a powerful tool for traders looking to combine multiple technical analysis methods into a single, easy-to-use script. By integrating these diverse techniques, it provides a comprehensive view of market conditions and potential trading opportunities.

Bollinger Bands Heatmap (BBH)The Bollinger Bands Heatmap (BBH) Indicator provides a unique visualization of Bollinger Bands by displaying the full distribution of prices as a heatmap overlaying your price chart. Unlike traditional Bollinger Bands, which plot the mean and standard deviation as lines, BBH illustrates the entire statistical distribution of prices based on a normal distribution model.
This heatmap indicator offers traders a visually appealing way to understand the probabilities associated with different price levels. The lower the weight of a certain level, the more transparent it appears on the heatmap, making it easier to identify key areas of interest at a glance.
Key Features
Dynamic Heatmap: Changes in real-time as new price data comes in.
Fully Customizable: Adjust the scale, offset, alpha, and other parameters to suit your trading style.
Visually Engaging: Uses gradients of colors to distinguish between high and low probabilities.
Settings
Scale
Tooltip: Scale the size of the heatmap.
Purpose: The 'Scale' setting allows you to adjust the dimensions of each heatmap box. A higher value will result in larger boxes and a more generalized view, while a lower value will make the boxes smaller, offering a more detailed look at price distributions.
Values: You can set this from a minimum of 0.125, stepping up by increments of 0.125.
Scale ATR Length
Tooltip: The ATR used to scale the heatmap boxes.
Purpose: This setting is designed to adapt the heatmap to the instrument's volatility. It determines the length of the Average True Range (ATR) used to size the heatmap boxes.
Values: Minimum allowable value is 5. You can increase this to capture more bars in the ATR calculation for greater smoothing.
Offset
Tooltip: Offset mean by ATR.
Purpose: The 'Offset' setting allows you to shift the mean value by a specified ATR. This could be useful for strategies that aim to capitalize on extreme price movements.
Values: The value can be any floating-point number. Positive values shift the mean upward, while negative values shift it downward.
Multiplier
Tooltip: Bollinger Bands Multiplier.
Purpose: The 'Multiplier' setting determines how wide the Bollinger Bands are around the mean. A higher value will result in a wider heatmap, capturing more extreme price movements. A lower value will tighten the heatmap around the mean price.
Values: The minimum is 0, and you can increase this in steps of 0.2.
Length
Tooltip: Length of Simple Moving Average (SMA).
Purpose: This setting specifies the period for the Simple Moving Average that serves as the basis for the Bollinger Bands. A higher value will produce a smoother average, while a lower value will make it more responsive to price changes.
Values: Can be set to any integer value.
Heat Map Alpha
Tooltip: Opacity level of the heatmap.
Purpose: This controls the transparency of the heatmap. A lower value will make the heatmap more transparent, allowing you to see the price action more clearly. A higher value will make the heatmap more opaque, emphasizing the bands.
Values: Ranges from 0 (completely transparent) to 100 (completely opaque).
Color Settings
High Color & Low Color: These settings allow you to customize the gradient colors of the heatmap.
Purpose: Use contrasting colors for better visibility or colors that you prefer. The 'High Color' is used for areas with high density (high probability), while the 'Low Color' is for low-density areas (low probability).
Usage Scenarios for Settings
For Volatile Markets: Increase 'Scale ATR Length' for better smoothing and set a higher 'Multiplier' to capture wider price movements.
For Trend Following: You might want to set a larger 'Length' for the SMA and adjust 'Scale' and 'Offset' to focus on more probable price zones.
These are just recommendations; feel free to experiment with these settings to suit your specific trading requirements.
How To Interpret
The heatmap gives a visual representation of the range within which prices are likely to move. Areas with high density (brighter color) indicate a higher probability of the price being in that range, whereas areas with low density (more transparent) indicate a lower probability.
Bright Areas: Considered high-probability zones where the price is more likely to be.
Transparent Areas: Considered low-probability zones where the price is less likely to be.
Tips For Use
Trend Confirmation: Use the heatmap along with other trend indicators to confirm the strength and direction of a trend.
Volatility: Use the density and spread of the heatmap as an indication of market volatility.
Entry and Exit: High-density areas could be potential support and resistance levels, aiding in entry and exit decisions.
Caution
The Bollinger Bands Heatmap assumes a normal distribution of prices. While this is a standard assumption in statistics, it is crucial to understand that real-world price movements may not always adhere to a normal distribution.
Conclusion
The Bollinger Bands Heatmap Indicator offers traders a fresh perspective on Bollinger Bands by transforming them into a visual, real-time heatmap. With its customizable settings and visually engaging display, BBH can be a useful tool for traders looking to understand price probabilities in a dynamic way.
Feel free to explore its features and adjust the settings to suit your trading strategy. Happy trading!

Buying Selling Volume StrategyFirst I would like to give the original credit and thanks to @ceyhun for his amazing volume script.
The way I decided to convert it into a strategy is divided into multiple types.
First, I decided in order to smooth out the values and make it more accurate to adapt the values to multiple timeframes.
After that I took the initial values from the buyers and sellers , and made a rest operation between them to have a flat difference between the power of both sides.
WIth that later on I decided to to apply a volatility filter,in this case bollinger bands, in order to find out potential leading trends.
At the same time in order to filter even more, I decided to make use as well for weekly VWAP values of the asset used.
Lastly I added a dynamic risk management into it , based on the ATR Daily values of the asset values.
As for the rules used, for example for long, I am looking that the price of the asset is above the weekly VWAP, after that I am checking that the MTF volume rest operation is both bullish and above the upper side of the bollinger.
For short we would want the asset to be below the weekly VWAP, and the volume to be bearish and above the upper side of bollinger.
The exit is either based on daily ATR values multipliers, or if we have a reverse condition.
If you have any questions, please let me know !

[Rygel] Dual time frame Bollinger Bands with signals and alertsThis indicator displays two Bollinger Bands coming from two different time frames, chart's current one and a higher one.
It analyzes these two Bollinger Bands data and combines them with RSI, MFI and MACD divergences and SuperTrend to identify areas of opportunity where price is the most likely to be at a local top or bottom.
It uses probabilistic data, the Bollinger Bands, to identify convergence areas where the price is statistically overbought or oversold simultaneously at two different time frames, it then looks for signs of a trend exhaustion, using RSI, MFI and MACD divergences, and finally it looks for an early confirmation of a trend reversal, using SuperTrend data with aggressive settings.
This indicator does not produce buy and sell signals. You won't get a buy for every sell or a sell for every buy. In a bearish trend, you may get multiple consecutive bullish signals and in a bullish trend multiple bearish signals.
It is meant to help you to identify and to alert you about areas of opportunity where you could, for instance, consider taking some profits or opening a trade.
It is meant to support your investment or trading decisions, not to induce them.
SIGNALS
This indicator generated multiple types of signals. Diamonds are better than squares. Colored ones are better than grey ones.
Green square: a bullish signal confirmed by a regular divergence
Red square: a bearish signal confirmed by a regular divergence
Blue square: a bullish signal confirmed by a hidden divergence (disabled by default as these signals are less reliable)
Orange square: a bearish signal confirmed by a hidden divergence (disabled by default as these signals are less reliable)
Diamonds: same as the square signals but the signal is forming a divergence with a previous one. Diamond signals are always stronger (i.e. more reliable) than square signals.
Grey signals: same as the previous ones but for weaker signals. These signals appear when price in the current time frame is overbought or oversold but only close to be at the higher timeframe. (disabled by default as these signals are less reliable)
When a weak signal follows a strong one and creates a MACD divergence with it, it will be considered as a strong signal and displayed as a colored signal, even when weak signals are disabled.
When a strong signal follows a weak one, forming a MACD divergence, it will be shown as a diamond signal, even when weak signals are disabled.
Most reliable signals are green and red diamonds.
SETTINGS
Bollinger Bands
Source: the source used to calculate the Bollinger Bands ("close" by default)
Length: the moving-average length of the Bollinger Bands (20 by default)
You will most likely have no need to change these settings. If you're wondering what they actually do, you should most likely not touch them.
Main channel standard deviation: the standard deviation used to calculate the classical Bollinger Bands channel. (2.0 by default)
Outer bands standard deviation: additional channels outside the main one, using a larger standard deviation. (3.0 by default)
Theoretically, with a 1.0 standard deviation, around 68% of the price action should be contained within the Bollinger Bands.
With a 2.0 standard deviation, around 95%.
With a 3.0 standard deviation, around 99.7%.
With a 4.0 standard deviation, around 99.99%.
But as security prices returns have no actual statistical distribution, these probabilities don't strictly apply to Bollinger Bands. According to Wikipedia, studies have found that with a 2.0 standard deviation, only about 88% (85–90%) of the price data remain with the Bollinger Bands, instead of the theoretical 95%.
The higher you set the values, the less signals you'll get.
You should most likely keep the main channel standard deviation between 2 and 3 and add between +0.5 and +1 for the outer bands.
Most commonly used value for Bollinger Bands is 2.0.
Current time frame
Show current time frame Bollinger Bands: these are the Bollinger Bands you're used to. (enabled by default)
Show current time frame outer bands: add two additional bands outside the main channel using a larger standard deviation. (enabled by default)
Higher time frame
Show higher time frame Bollinger Bands: display secondary Bollinger Bands from a higher time frame. Time frames are configured in the below "Time frames" section. (enabled by default)
Show higher time frame outer bands: add two additional bands outside the main channel using a larger standard deviation (enabled by default)
Overbought and oversold
Show oversold and overbought background: add a background to the higher time Bollinger Bands whose color depends on the dual time frame Bollinger Bands oversold / overbought status. (enabled by default)
Asset is considered overbought/oversold when its price is outside of the Bollinger Bands' main channel.
Asset is considered strongly overbought/oversold when its price is outside of the Bollinger Bands' outer bands.
Dark red: both time frame are overbought (outside the main channel)
Red: one time frame is strongly overbought (outside the outer bands) and the other one is overbought (outside the main channel)
Bright red: both time frame are strongly overbought (outside the outer bands)
Dark green: both time frame are oversold (outside the main channel)
Green: one time frame is strongly oversold (outside the outer bands) and the other one is oversold (outside the main channel)
Bright green: both time frame are strongly oversold (outside the outer bands)
Signals
Show signals: display signals when an area of opportunity is detected. Read the introduction and the Signals section for more information. (enabled by default)
Show weak signals: display signals although at the higher time frame price is not yet overbought or oversold but close to be (disabled by default)
Divergences
Use MACD for divergences (enabled by default)
Use MFI for divergences (enabled by default)
Use RSI for divergences (enabled by default)
At least one source of divergences must be enabled for signals to work.
Enable hidden divergences: signals don't use hidden divergences by default as they generate more false positives than regular divergences. You can enable them to get more signals, it can be especially useful at high time frames (like weekly, monthly, etc.) where signals are rarer. (disabled by default)
Show divergences: draw MACD, MFI and RSI divergences on the chart. (disabled by default)
Green: regular bullish divergence
Red: regular bearish divergence
Blue: hidden bullish divergence
Orange: hidden bearish divergence
Confirmation
Confirmation speed: a faster confirmation speed will generate more false positive signals, a slower one will produce delayed but more reliable signals.
Fastest: don't wait for a SuperTrend confirmation, only wait for a divergence confirmation. Lot of false positives.
Fast: wait for a fast SuperTrend confirmation (SuperTrend factor = 1).
Medium: wait for a slower but more reliable SuperTrend confirmation (SuperTrend factor = 2). Fewer false positives but more lagging signals.
Slow: wait for an even slower but very reliable SuperTrend confirmation (SuperTrend factor = 3). Very few false positives but very late signals.
Time frames
You can define the higher time frames you wish to use here.
Default values try to adhere to a x6 to x8 ratio, x4 to x12 at maximum.
Some pairs are more significant than others, like 4 hour + daily, daily + weekly and weekly + monthly.
1 second: 10 seconds
5 seconds: 30 seconds
10 seconds: 1 minute
15 seconds: 2 minutes
30 seconds: 3 minutes
1 minute: 10 minutes
2 minutes: 15 minutes
3-4 minutes: 30 minutes
5-9 minutes: 45 minutes
10-11 minutes: 1 hour
12-14 minutes: 1 hour
15-29 minutes: 2 hours
30-44 minutes: 4 hours
45-59 minutes: 6 hours
1 hour: 8 hours
2 hours: 12 hours
3 hours: 1 day
4-5 hours: 1 day
6-7 hours: 2 days
8-11 hours: 3 days
12-23 hours: 4 days
1 day: 1 week
2 days: 2 weeks
3 days: 3 weeks
4 days: 1 month
5 days: 1 month
6 days: 1 month
1 week: 1 month
2 weeks: 2 months
3 weeks: 3 months
1 month: 6 months
2 months: 9 months
3 months: 12 months
4 months: 15 months
5 months: 21 months
6 months: 24 months
Time frames use the TradingView units:
s = seconds
h = hours
D = days
W = weeks
M = months
no unit = minutes
Time frame strings follow these rules:
They are composed of the multiplier and the time frame unit, e.g., “1S”, “30” (30 minutes), “1D” (one day), “3M” (three months).
The unit is represented by a single letter, with no letter used for minutes: “S” for seconds, “D” for days, “W” for weeks and “M” for months.
When no multiplier is used, 1 is assumed: “S” is equivalent to “1S”, “D” to “1D, etc. If only “1” is used, it is interpreted as “1min”, since no unit letter identifier is used for minutes.
There is no “hour” unit; “1H” is not valid. The correct format for one hour is “60” (remember no unit letter is specified for minutes).
The valid multipliers vary for each time frame unit:
- For seconds, only the discrete 1, 5, 10, 15 and 30 multipliers are valid.
- For minutes, 1 to 1440.
- For days, 1 to 365.
- For weeks, 1 to 52.
- For months, 1 to 12.
Styles
You can configure the appearance of the Bollinger Bands, the overbought / oversold background, the divergences and the signals here.
Advanced - MACD
Settings used for the MACD divergences. You most likely won't need to change these values, especially if you need them to be explained.
Advanced - MFI
Settings used for the MACD divergences. You most likely won't need to change these values, especially if you need them to be explained.
Advanced - RSI
Settings used for the MACD divergences. You most likely won't need to change these values, especially if you need them to be explained.
Advanced - SuperTrend
Settings used for the MACD divergences. You most likely won't need to change these values, especially if you need them to be explained.
ALERTS
Any signal: a bullish or bearish signal has been detected.
Bullish signal: a bullish signal has been detected.
Bullish signal with divergence: a bullish signal forming a divergence with a previous bullish signal has been detected.
Bearish signal: a bearish signal has been detected.
Bearish signal with divergence: a bearish signal forming a divergence with a previous bearish signal has been detected.
Overbought/oversold = asset price is outside of the Bollinger Bands' main channel.
Strongly overbought/oversold = asset price is outside of the Bollinger Bands' outer bands.
Current time frame - Entering overbought: asset is now overbought at the current time frame.
Current time frame - Exiting overbought: asset is not overbought anymore at the current time frame.
Current time frame - Entering strongly overbought: asset is now strongly overbought at the current time frame.
Current time frame - Exiting strongly overbought: asset is not strongly overbought anymore at the current time frame.
Current time frame - Entering oversold: asset is now oversold at the current time frame.
Current time frame - Exiting oversold: asset is not oversold anymore at the current time frame.
Current time frame - Entering strongly oversold: asset is now strongly oversold at the current time frame.
Current time frame - Exiting strongly oversold: asset is not strongly oversold anymore at the current time frame.
Higher time frame - Entering overbought: asset is now overbought at the higher time frame.
Higher time frame - Exiting overbought: asset is not overbought anymore at the higher time frame.
Higher time frame - Entering strongly overbought: asset is now strongly overbought at the higher time frame.
Higher time frame - Exiting strongly overbought: asset is not strongly overbought anymore at the higher time frame.
Higher time frame - Entering oversold: asset is now oversold at the higher time frame.
Higher time frame - Exiting oversold: asset is not oversold anymore at the higher time frame.
Higher time frame - Entering strongly oversold: asset is now strongly oversold at the higher time frame.
Higher time frame - Exiting strongly oversold: asset is not strongly oversold anymore at the higher time frame.
Dual time frame - Entering overbought: asset is now overbought at current and higher time frames.
Dual time frame - Exiting overbought: asset is not overbought anymore at current and higher time frames.
Dual time frame - Entering oversold: asset is now oversold at current and higher time frames.
Dual time frame - Exiting oversold: asset is not oversold anymore at current and higher time frames.
Dual time frame - Entering strongly overbought: asset is now strongly overbought at current and higher time frames.
Dual time frame - Exiting strongly overbought: asset is not strongly overbought anymore at current and higher time frames.
Dual time frame - Entering strongly oversold: asset is now strongly oversold at current and higher time frames.
Dual time frame - Exiting strongly oversold: asset is not strongly oversold anymore at current and higher time frames.
ABOUT THE HIGHER TIME FRAME BOLLINGER BANDS
Using a classical higher time frame Bollinger Bands would produce lagging data. For instance, if we are using a weekly BB at the daily time frame, we'll have to wait up to 7 days for the weekly bar to close to get the actual final weekly BB values. Instead, this indicator generates real time higher time frame Bollinger Bands by multiplying the moving average length of the Bollinger Bands by the higher time frame / current time frame ratio. For instance, a weekly BB in the daily time frame will use a x7 ratio (i.e. a 20 * 7 = 140 days MA BB).
It produces slightly different but very similar bands that are as meaningful and can be used in real time at lower time frames.
Alternatives would have been to wait up to seven days for signals to be finalized, which would have render them meaningless. Or to use previous week data, which would have made the signal inaccurrate.
To sum up, weekly Bollinger Bands use a 20 weeks moving average updated one time a week. In the daily time frame, this indicator also use a 20 weeks (140 days) moving average but updated daily instead of weekly.
A comparison between a traditional higher time frame Bollinger Bands vs the ones used by this indicator:
Blue and orange lines are the actual weekly BBs, grey ones are the daily updated ones.
ABOUT THE DIVERGENCES
This indicator uses the same divergences algorithm as my other indicators:
- RSI with divergences
- MACD with divergences
- Trend Reversal Indicator
You'll find more information about this algorithm on my RSI page.
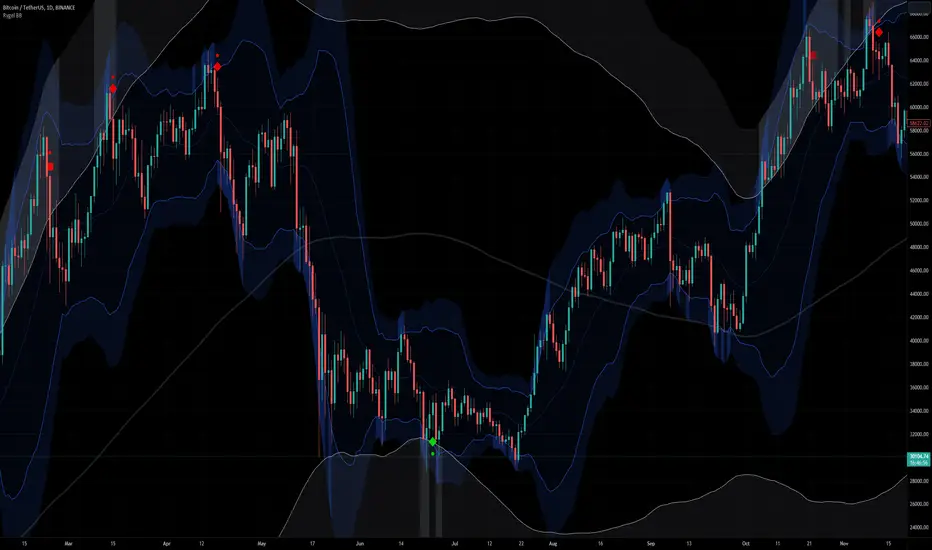
Filtered Momentum Indicator (FMI)The Filtered Momentum Indicator (FMI) is a tool created to assist traders in identifying changes in momentum and gaining insights into potential shifts in price trends. By combining the concepts of momentum and Bollinger Bands, the FMI offers a unique perspective on momentum values and their relationship to price movements, helping traders make informed trading decisions. The FMI is calculated using two main components:
-- Momentum Calculation : Momentum measures the strength and velocity of price changes. It is calculated by comparing the current price to the price 14 (default) periods ago and expressing it as a percentage.
-- Bollinger Bands Calculation : Bollinger Bands are based on the momentum values and provide a range within which the momentum is expected to fluctuate. The upper and lower bands are determined using a specified period (default of 20) and deviations (default of 2.0).
The FMI consists of two lines : F+ (Filtered Plus) and F- (Filtered Minus). These lines help gauge the strength of bullish and bearish momentum:
-- F+ represents the difference between the upper Bollinger Band and the momentum values. It indicates the strength of bullish momentum. F+ is colored aqua.
-- F- represents the difference between the momentum values and the lower Bollinger Band. It indicates the strength of bearish momentum. F- is colored yellow.
When analyzing the FMI, pay attention to the relationship between F+ and F-:
-- If F- is greater than F+ , it suggests potential bullish momentum, indicating that prices may have room to rise.
-- If F+ is greater than F- , it suggests potential bearish momentum, indicating that prices may have room to decline.
Coloration of the FMI enhances its interpretability - when F- is greater than F+, the indicator color is set to lime (green), signaling potential bullish momentum; when F+ is greater than F-, the indicator color is set to fuchsia (purple), signaling potential bearish momentum.
The FMI can be applied in various ways for trading strategies:
-- Identifying Potential Reversals : Watch for crossovers between the F- and F+ lines, as they may indicate a potential shift in momentum and offer opportunities to enter or exit trades.
-- Confirmation Tool : Combine the FMI with other technical indicators or price patterns to validate potential trend reversals or continuations. By aligning signals from different indicators, you can strengthen your trading decisions.
-- Trade Timing : Consider taking trades in the direction of the dominant FMI color. When the indicator shows strong bullish momentum (F- > F+), consider going long. Conversely, when it shows strong bearish momentum (F+ > F-), consider going short.
It is essential to be aware of the limitations of the FMI:
-- False Signals : The FMI, like any indicator, may generate false signals, especially during low volatility or choppy market conditions. Always use the FMI in conjunction with other analysis techniques for confirmation.
-- Lagging Nature : The FMI relies on historical price data, causing it to lag behind sudden market moves. Keep in mind that the FMI provides insights based on past momentum and may not capture immediate changes in market conditions.
By combining momentum and Bollinger Bands, this indicator provides a unique perspective for making informed trading decisions. Utilize the FMI in conjunction with other analysis techniques, considering its limitations, to enhance your trading strategy and improve decision-making.

Volatility Compression Breakout - LeafAlgo Pro StrategyThe Volatility Compression Breakout strategy is designed to identify periods of low volatility followed by potential breakout opportunities in the market. It aims to capture moments when the price consolidates within a narrow range, indicating a decrease in volatility, and anticipates a subsequent expansion in price movement. This strategy is based on our indicator of the same name (), but differs by offering many more options for the band/channel type and trend filters in addition to implementing the ability to use this strategy with algorithmic plug-ins (see details at the bottom).
This strategy features six types of bands/channels and five types of trend filters, for a total of 30 combinations. The six band/channel types are the Adaptive Gaussian MA channel (based on the Adaptive Gaussian MA that we previously published ()), standard Bollinger Bands, smoothed Bollinger Bands (basis is an EMA of the typical Bollinger Basis), Keltner Channels, a Quadratic Regression Channel (based on the channel that we previously published in the LeafAlgo Pro indicator ()), and Volatility-Based Mean Reversion Bands (). The five trend filters include an EMA, SMA, Weighted MA, McGinley Dynamic, and the Adaptive Gaussian MA itself.
Examples of the different band/channel types (all with EMA as the trend filter):
Adaptive Gaussian MA Channel:
Bollinger Bands:
Smoothed Bollinger Bands:
Keltner Channels:
Quadratic Regression Channel:
Volatility-Based Mean Reversion Bands:
Examples of the different trend filters (all with Keltner Channels):
EMA:
SMA:
WMA:
McGinley Dynamic:
Adaptive Gaussian MA:
How the Long/Short Entry Signals are Calculated:
A breakout signal upwards, accompanied by a long entry, is created when the high is greater than the secondary upper band (the upper band plus a standard deviation or with a multiplier, depending on which band/channel type is selected), the latest close is above the trend filter line, and the previous close was below the trend filter line. A break downwards, accompanied by a short entry, is created when the low is below the secondary lower band, the close is below the trend filter line, and the previous close was above the trend filter line. These conditions, along with a confirmed barstate, make up the strategy entry signals.
Coloration:
When the close price is above both the middle/basis and the trend filter, the bars are colored lime green, indicating a potential bullish market sentiment. When the close price is positioned above the basis but below the trend filter, or below the basis but above the trend filter, the bars are colored yellow, signifying a neutral or indecisive market condition. Conversely, when the close price falls below both the basis and the trend filter, the bars are colored fuchsia, suggesting a potential bearish market sentiment. Additionally, the coloration of the middle/basis line and the trend filter provides further visual cues for assessing the trend. When the close price is above the basis, the line is colored lime green, indicating a bullish trend. Conversely, when the close price is below the basis, the line is colored fuchsia, highlighting a bearish trend. Similarly, the trend line is colored lime green when the close price is above it, representing a bullish trend, and fuchsia when the close price is below it, indicating a bearish trend. The fill between the primary and secondary upper bands is colored lime and the fill between the primary and secondary lower bands is colored fuchsia. These colorations can be toggled on/off in the strategy settings menu.
How Changing Parameters Can Be Beneficial:
Modifying the parameters allows you to adapt the indicator to different market conditions and trading styles. For example, with Keltner Channels, increasing the compression period can help identify broader volatility patterns and major market shifts. On the other hand, decreasing the compression period provides more precise and timely signals for short-term traders. Adjusting the compression multiplier affects the width of the Keltner Channels. Higher multipliers increase the breakout threshold, filtering out smaller price movements and providing more reliable signals during significant market shifts. Lower multipliers make the indicator more sensitive to smaller price ranges, generating more frequent but potentially less reliable signals.
Changing the type of trend filter can drastically change your results. Test out each trend filter type and determine which one will work best for your purposes. Further, the MA periods in the trend filter settings can help you align your trades with the prevailing market direction. Increasing the period smoothes out the trend, filtering out shorter-term fluctuations and focusing on more sustained moves. Decreasing the period allows for quicker responses to changes in trend, capturing shorter-term price swings.
By adjusting the parameters and incorporating additional analysis techniques, you can customize the strategy to suit your trading style and preferences. However, it is crucial to exercise caution, conduct thorough analysis, and practice proper risk management to increase the likelihood of successful trades. Remember that no strategy can guarantee profits, and continuous learning and adaptation are key to long-term trading success.
Take Profit/Stop Loss Settings:
Take profit, stop loss, and trailing percentages are also included, found at the bottom of the Input tab under “TT and TTP” as well as “Stop Loss”. The take profit and stop loss levels will be reflected as green and red lines respectively on the chart as they occur. Make sure to understand the TP/SL ratio that you desire before use, as the desired hit rate/profitability percentage will be affected accordingly. The option for adding in a trailing stop has also been included, with options to choose between an ATR-based trail or a percentage-based trail. This strategy does NOT guarantee future returns. Apply caution in trading regardless of discretionary or algorithmic. Understand the concepts of risk/reward and the intricacies of each strategy choice before utilizing them in your personal trading.
Profitview/Pineconnector Settings:
If you wish to utilize Profitview’s automation system, find the included “Profitview Settings” under the Input tab of the strategy settings menu. If not, skip this section entirely as it can be left blank. Options will be “OPEN LONG TITLE”, “OPEN SHORT TITLE”, “CLOSE LONG TITLE”, and “CLOSE SHORT TITLE”. If you wished to trade SOL, for example, you would put “SOL LONG”, “SOL SHORT”, “SOL CLOSE LONG”, and “SOL CLOSE SHORT” in these areas. Within your Profitview extension, ensure that your Alerts all match these titles. To set an alert for use with Profitview, go to the “Alerts” tab in TradingView, then create an alert. Make sure that your desired asset and timeframe are currently displayed on your screen when creating the alert. Under the “Condition” option of the alert, select the strategy, then select the expiration time. If using TradingView Premium, this can be open-ended. Otherwise, select your desired expiration time and date. This can be updated whenever desired to ensure the strategy does not expire. Under “Alert actions”, nothing necessarily needs to be selected unless so desired. Leave the “Alert name” option empty. For the “Message”, delete the generated message and replace it with {{strategy.order.alert_message}} and nothing else. If using Pineconnector, follow the same directions for setting up an alert, but use the ",buy,,risk=" syntax as noted in the tooltips.
Additional Sample Settings (for ETHUSDT-Binance 45M):
Band/Channel Type - Keltner Channels (Compression Period of 20, Multiplier of 1.8x)
Trend Filter - WMA (50 length, no offset, close as the source)
TP/SL - 3.0% TP / 2.0% SL, 0.005 trailed TP, no trailed SL

Bollinger Bands Lab - by InFinitoVariation of the Moving Average Lab that includes Bollinger Bands functionality for any manually created Moving Average. It includes:
- Standard Deviations for any MA
- Fixed Symmetrical Deviations for any MA that remain at a constant % away from the MA
- The same Moving Average creation settings from the Moving Average Lab
"The Moving Average Lab allows to create any possible combination of up to 3 given MAs. It is meant to help you find the perfect MA that fits your style, strategy and market type.
This script allows to average, weight, double and triple multiple types and lengths of Moving Averages
Currently supported MA types are:
SMA
EMA
VWMA
WMA
SMMA (RMA)
HMA
LSMA
DEMA
TEMA
Features:
- Double or Triple any type of Moving Average using the same logic used for calculating DEMAs and TEMAs
- Average 2 or 3 different types and lengths of Moving Average
- Weight each MA manually
- Average up to 3 personalized MAs
- Average different Moving Averages with different length each "
The preview screenshot shows:
- The combination of:
- 200 LSMA - Weight: 1
- 200 HMA - Weight: 2
- 200 VWMA - Weight: 1 - Double
- The regular Bollinger Band setting, 2 standard deviations
- Two fixed symmetrical deviations at 15% and 20% away from the XMA
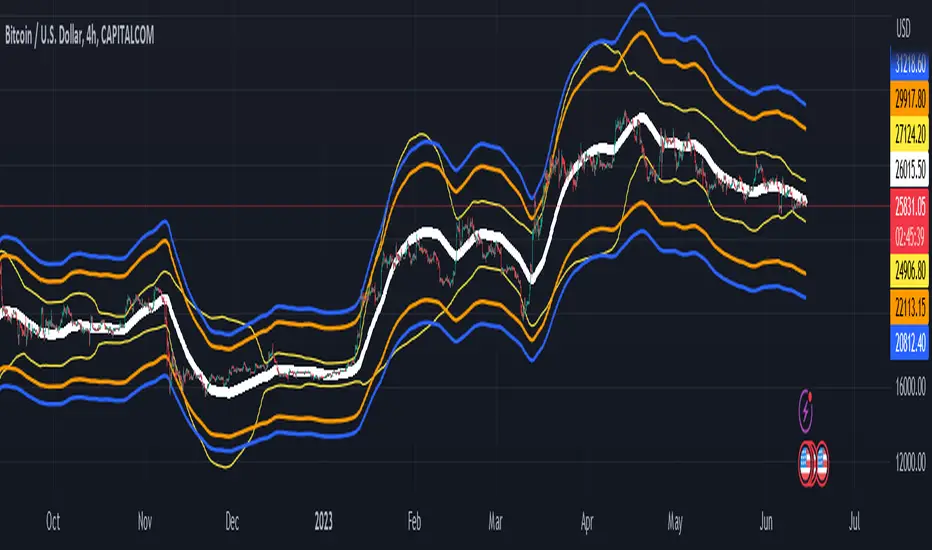
BB Squeeze + SuperTrend + Keltner ChannelBollinger Bands and Keltner Channel are two of my favorite channels. When you use them correctly, they can bring great help to your trading.
I like to use Bollinger Bands and Keltner Channels to identify when you can trade and when you can not trade, which is also known as the "squeeze".
When the opening of the Bollinger Bands is very small, it is a range that you can enter a trade, the range is called "Squeeze Zone" or "Trade zone".
When the opening of the Bollinger Bands is very large, it is a range that you cannot enter a trade, because the market fluctuates big when BB's opening is large.
I use two ways to identify when the Bollinger Bands's opening is very small or large, one is the Bollinger Bands entering Keltner Bands and one is using specific ATR ranges,. The first one allows you to identify when the market is squeezing and the second one allows you to identify when the market has entered Squeeze zone, that is, the market is already in a trading range suitable for entering a trade.(see chart.)
When the market is squeezed and you enter the trade, you can also use ATR as the stop loss price of the trade, I recommend using 2 ATR as your stop loss, and I also display them on the chart (see chart).
In addition, I also added SuperTrend to this indicator. SuperTrend is a very suitable for identifying trends. You can use SuperTrend to help you identify whether to go long or short.
This is how I use this indicator(See chart):
1.Only trade when market is in Squeeze Zone. (Thick yellow line in chart)
2.When entry a trade, use 2 ATR as stop loss. (Label in Chart)
3.Use Super trend to know to go long or short.
4.Keltner Channel helps to know when the market is squeezing. (Thin yellow line in chart.)
======== 中文說明 (Chinese Explanation) ========
Bollinger Bands(布林帶)跟 Keltner Channel(肯特納通道)是我最喜歡的兩個通道,當你正確使用它們時,它們可以替你的交易帶來非常大的幫助。
我喜歡用 Bollinger Bands 跟 Keltner Channel 來識別何時可以交易,何時不能交易,這個又稱做“擠壓操作”。當布林帶的開口很小時,便是可以交易的區間,而當布林帶的開口很大時,對我來說此時就是不可以交易的區間,因為此時市場的波動很大。
我使用兩種方式來識別當布林帶開口很小的時候,一種是布林帶進入肯特納通道,一種則使用特定的ATR範圍,前者可以讓你識別市場正在擠壓,後者則可以識別市場已經進入擠壓區間,也就是市場已經處於適合進入交易的交易區間。
當市場進入擠壓之後,而你也進入了交易,你還可以使用ATR來作為交易的止損價格,我建議使用2個ATR 來當作你的止損,而我也將他們顯示在圖表上了(見圖表)。
另外,我還在這個指標中加入了 SuperTrend(超級趨勢),SuperTrend 是一個非常適合用來辨別趨勢的指標,你可以使用 SuperTrend 來幫助你識別要做多還是做空。
這是我使用該指標的方式(見圖表):
1.僅在市場處於交易區間時進行交易。 (圖中黃色粗線)
2.入場時,使用2個ATR作為止損。 (圖表中的標籤)
3.使用超級趨勢知道做多或做空。
4.Keltner Channel 有助於了解市場何時擠壓。 (圖表中的黃色細線。)
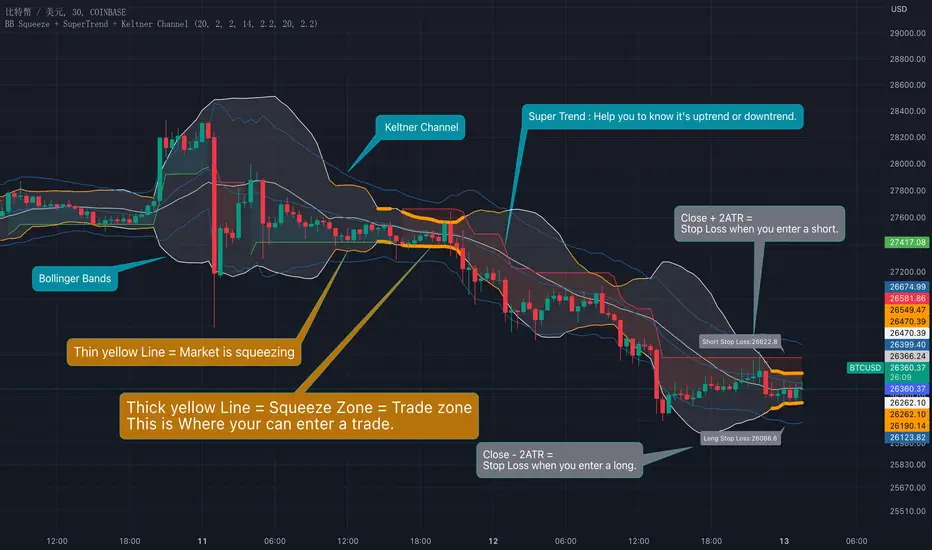
FibonRSI / ErkOziHello,
This software is a technical analysis script written in the TradingView Pine language. The script creates a trading indicator based on Fibonacci retracement levels and the RSI indicator, providing information about price movements and asset volatility by using Bollinger Bands.
There are many different scripts in the market that draw RSI and Fibonacci retracement levels. However, this script was originally designed by me and shared publicly on TradingView.
***The indicator uses RSI (Relative Strength Index) and Bollinger Bands (BB) as the basis for the FibonRSI strategy. RSI measures the strength of a price movement, and BB measures the volatility of an asset. The FibonRSI strategy is based on the idea that the Fibonacci ratios and RSI can be used to predict a asset's price retracement levels.
***The script allows for various parameters to be adjusted. Users can specify the price source type and adjust the periods for RSI and Bollinger Bands. The standard deviation number for Bollinger Bands can also be customized.
***The script calculates the current RSI indicator position and the basic, upper, and lower levels of Bollinger Bands. It then calculates and draws the Fibonacci retracement levels. The color of the RSI line is determined by the upper and lower distribution levels of Bollinger Bands. Additionally, the color of the Fibonacci retracement levels can also be customized by the user.
***This script can be used to determine potential buy and sell signals using Fibonacci retracement levels and RSI. For example, when the RSI is oversold and the price is close to a Fibonacci retracement level, it can be interpreted as a buying opportunity. Similarly, when the RSI is overbought and the price is close to a Fibonacci retracement level, it can be interpreted as a selling opportunity.
***The script takes input parameters such as the price source used for calculation, the period for the RSI indicator, the period for the Moving Average in Bollinger Bands, and the number of standard deviations used in Bollinger Bands.
***The script's conditions include elements such as calculating the current position of the RSI indicator, calculating the upper and lower Bollinger Bands, calculating the dispersion factor, and calculating Fibonacci levels.
***The parameters in the code can be adjusted for calculation, including the price type used, the RSI period, the Moving Average period for BB, and the standard deviation count for BB. After this, the current position of the RSI, Moving Average, and standard deviation for BB are calculated. After calculating the upper and lower BB, the levels above and below the average are calculated using a specific dispersion constant.
CONDITIONS FOR THE SCRIPT
current_rsi = ta.rsi(src, for_rsi) // Current position of the RSI indicator
basis = ta.ema(current_rsi, for_ma)
dev = for_mult * ta.stdev(current_rsi, for_ma)
upper = basis + dev
lower = basis - dev
dispersion = 1
disp_up = basis + (upper - lower) * dispersion
disp_down = basis - (upper - lower) * dispersion
// Fibonacci Levels
f100 = basis + (upper - lower) * 1.0
f78 = basis + (upper - lower) * 0.78
f65 = basis + (upper - lower) * 0.65
f50 = basis
f35 = basis - (upper - lower) * 0.65
f23 = basis - (upper - lower) * 0.78
f0 = basis - (upper - lower) * 1.0
***When calculating Fibonacci levels, the distance between the average of BB and the upper and lower BB is used. These levels are 0%, 23.6%, 35%, 50%, 65%, 78.6%, and 100%. Finally, the RSI line that changes color according to a specific RSI position, Fibonacci levels, and BB are visualized. Additionally, the levels of 70, 30, and 50 are also shown.
The script then sets the color of the RSI position according to the EMA and draws Bollinger Bands, RSI, Fibonacci levels, and the 70, 30, and 50 levels.
In conclusion, this script enables traders to analyze market trends and make informed decisions. It can also be customized to suit individual trading strategies.
This script analyzes the RSI indicator using Bollinger Bands and Fibonacci levels. The default settings are 14 periods for RSI, 233 periods and 2 standard deviations for BB. The MA period inside BB is selected as the BB period and is used when calculating Fibonacci levels.
***The reason for selecting these settings is to provide enough time for BB period to confirm a possible trend. Additionally, the MA period inside BB is matched with the BB period and used when calculating Fibonacci levels.
***Fibonacci levels are calculated from the distance between the upper and lower bands of BB and show how RSI movement is related to these levels. Better results can be achieved when RSI periods are set to Fibonacci numbers such as 21, 55, and 89. Therefore, the use of Fibonacci numbers is recommended when adjusting RSI periods. Fibonacci numbers are among the technical analysis tools that can capture the reflection of naturally occurring movements in the market. Therefore, the use of Fibonacci numbers often helps to better track fluctuations in the market.
Finally, the indicator also displays the 70 and 30 levels and the middle level (50) with Fibonacci levels drawn in circles. Changing these settings can help optimize the Fibonacci levels and further improve the indicator.
Thank you in advance for your suggestions and opinions......

Bollinger Bands %B (ValueRay)One of the key features of this BB%B is its ability to highlight overbought and oversold conditions. This allows you to make informed decisions on when to enter and exit a trade, helping you maximize your profits and minimize your losses.
- Bollinger Bands %B with the ability to change to a different Time Frame.(Defaults to current Chart Time Frame).
- Ability To Turn On/Off Background Highlighting if BB %B is Above/Below 0 / 1 thresholds.
- Ability To Turn On/Off Background Highlighting when BB %B Crosses back above/unser 0/1 thresholds.
---
My personal recommandation use: combine with CM_Ultimate RSI Multi Time Frame (ChrisMoody) and have solid oversold/overbought levels, when hes RSI and my BB %B are bot red/green

Seer's HutThis is a strategy based on Exponential Moving Averages or Volume Weighted Moving Averages against Adaptive fib resistance / support level and profit percentage which can be definetly defined by user and targeting small profits(profits will be raised by leverages).
In this strategy, there are predefined values which are collected one by one with statistical background and backtests. This gives an advantage to see which ratios are working better for each symbol. Also this statistics are re-evaluated monthly and if there is a need they are going to be changed with the help of libraries. Also IT IS RECOMMENDED TO USE IN DAILY INTERVAL GRAPHICS!!!!
When we deep dive to strategy, it is based on profit percentages. it is similar to the MOST system. MOST only changes the way with default value of %2. But this hardcoded strategy is not working well with each Symbol.
So this is the point where DC and ADR Statistics are involved.
For Ex. while BTC is suits well with %2, it does not do wonders for RSR or RUNE which is 4-5% for each.
There is 3 options for setting the statistical usage of this indicator.
1. Auto calculated based on 1000 days of ADR and DC
imgur.com
2. Using Library where statistical values are stored.
imgur.com
3. User-defined values used. Yeah you read it right. Fully on-demand changes are supported. Which gives freedom to users for setup their own Adaptive FIB and Profit Percentages.
imgur.com
Based on this 3 options, TP and SL points are calculated on bar closures. Strategy Orders are also shown / raised with the closures.
Ok, system calculates these values but how to read / use them. what is this strategy based on ?
This strategy is mostly looking for minimizing the LOSS in case of any stop. So because of this, in each TP, system gives order signal to close half of the remaining open position.
There are 7 type of orders
OL : Open Long (Close Short and Open Long if in position)
CL 50 : Close Long - %50 of Open Position
CL 100 : Close Long - Close all position
OS : Open Short (Close Long and Open Short if in position)
CL 50 : Close Short - %50 of Open Position
CL 100 : Close Short - Close all position
TP5 : Highest TP reached. Close all position.
Script checks cross of EMA / VWMA and adFib to decide open a position. In reversal / crosses, adFib line had been set to defined Fib. Percentage (FP) level.
For creating the TP points, Profit Percentage (PP) parameter had been used which I briefly introduce at the beginning with the options.
One important topic about this strategy, it is not stacking / pyramiding the positions. Which means, it always calculate one way position. For example we are in the long position after OL signal.
We reached TP values and take profits. Later on due to FP crossing EMA, OS order signal given. This means you have to close all long position and open short position.
But beware. These calculated points are based on given values or calculated regarding to average ADR / DC ratings. For supporting strategy, several methods also had been included in the options.
imgur.com
These are:
1. MA plotting (Optional 4 EMA, 1WMA) - checking for Golden and Death Cross
2. Bollinger Bands (Length 25 and Multiplier 2.5 set as default. Used in correlation with TEMA)
3. Kama 2 / Kama 5 - Crossing speaks of Trend way
4. TEMA (TEMA 50, VWMA 25 calculations and plotting. Used for TEMA 50 / VWMA 25 / SMA 25 cross checks for weakening or strengthening trend analysis)
5. ATR plotting
6. Chandelier Exit plotting (Widely used for calculating Stop levels in market)
7. PSAR (Widely used for indicating trend reversal)
Also for the ease of use, if the users does not want to plot any values on the graph and just want to see the values there is couple of tables also included.
1. EMA info
2. KAMA info
3. Order info
4. TP/SL info
imgur.com
Some important notes:
1. To minimize the stop just after the order opening candle in volatile grounds, system prevents to raise new order signals if there is a signal already raised in last 4 candle.
2. if system reach and give close order in one of the TP points (For Ex TP1.), then index goes down and goes up again same TP (above TP1 in scenario) after 4 candle, system gives a close order signal again in the same TP.
3. There is a Profit Factor value had been shown at Order Info table. This information shows how profitable is the setup regarding to given FP and PP values.
In general market conditions, A Profit Factor above 1.50 is considered good enough and above 2.0 it is considered ideal. A strategy with profit factor less than 1.20 suggests too bigger a risk taken for making money.
In some cases automatic ADR and DC calculations are not good enough. so if you want to find a good Profit Factor value, you can change the system automatic calculation to manual value entering and you can see the results directly with in this field.
