R2-Adaptive RegressionOVERVIEW
This is an implementation of alexgrover's R2-Adaptive Regression optimized for the latest version of TradingView.
Full details on the indicator are on alexgrover's page here:
Bias

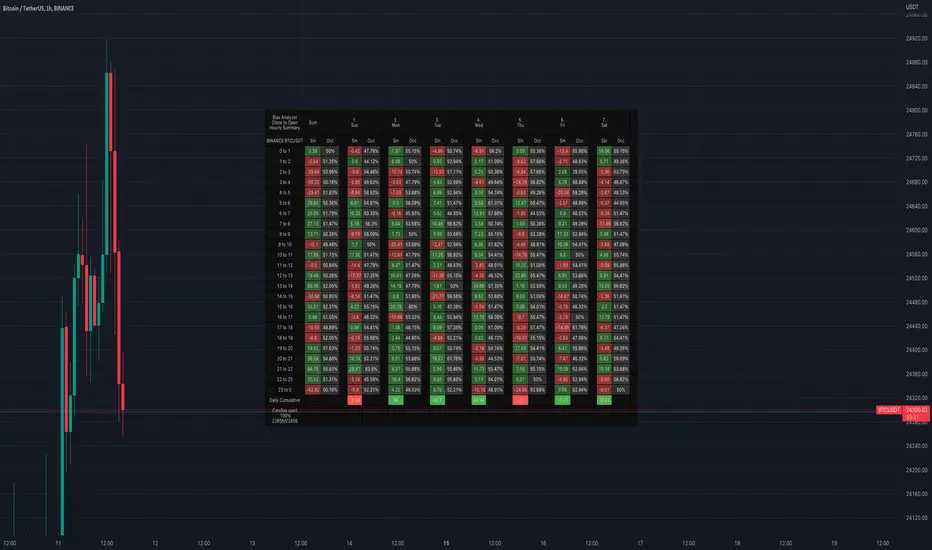
Bias AnalyzerName: Bias Analyzer
Category: Market Analyzer
Timeframe: 1H and 1D, depending on the Analysis type.
Technical Analysis: Usually when we think about a Trading System we start from an idea. This idea comes normally from observation and the study of the market.
Have we ever observed a market - for example Bitcoin - and thought that it increases at the start of a USA session? Great, this is a well-known category of Trading System and the purpose of the Bias Analyzer is to study these phenomena.
There are different types of Trading System that we can classify considering the market in-efficiency that we use to our advantage. In this case we make the Bias. Literally "inclination" or "presupposition" or precisely "tendency" of the price to go up or down in a temporal way.
The characteristics of the Bias depend on how much the Bias is persistent on the market since the analysed period. therefore we can consider:
Hourly Bias : analysing the hourly behaviours during the week. Trades normally last from a few hours to a few days.
Seasonal Bias : analysing the behaviour of the weeks in the monthly or annual context, evaluating the seasons.
Suggested usage: The possibilities of the tool are infinite, these are some scenarios of use:
Development of Intraday Trading Systems based on Hourly Bias with possible filters for specific days of the week.
Development of a Multi-day Trading System based on daily Bias with monthly analysis.
To identify the best day to execute our investment through Dollar Cost Average with a bit of healthy buy the dip
Main features:
Hourly Summary organized in Week
The cells contain the sum of the various price deltas for the single hour. The transparency indicates the frequency in which the candles close positive or negative. This information is available both in a synthetic way, as in the first column "Sum", and for each day of the week.
Hourly Details organized in different entry/exit
Shows the cumulative data of the various deltas, considering the purchase and the sale at certain times. In the rows are represented the buying hours and in the columns the selling hours.
Daily Summary organized in Months
The cells contain the summation of the various price deltas for the single day.
Hourly Details organized in different entry/exit
Allows to visualise the detailed analysis table, choosing to do it for all the months or for a specific month and shows the cumulative data of the various deltas, considering the purchase and the sale in certain days.
Configuration: You can configure the tool easily and completely.
Analysis
Calculate from Close to Open : this is the core of the whole analysis where the "Price Delta" to be calculated is defined. At this moment there is the possibility to calculate the distance between opening and closing.
Calculate in Percent or Cash : this allows to calculate the Price Delta in Percent or in Cash.
Analysis on 1H Timeframe
Show Hourly Summary on : allows to visualise the summary analysis table of the week. The cells contain the sum of the various price deltas for the single hour. The transparency indicates the frequency in which the candles close positive or negative. This information is available both in a synthetic way, as in the first column "Sum", and for each day of the week. At the bottom left there is also data which allows us to understand how many candles are being analysed. At the bottom of each day it is possible to visualise the cumulative data of the day. The position of the table is customizable.
Show Hourly Details of on : allows to visualise the detailed analysis table, choosing to do it for all days or for a specific day, and shows the cumulative data of the various deltas, considering the purchase and the sale at certain times. In the rows are represented the buying hours and in the columns the selling hours. For example, going to the table "All Days" we can see in the cell of row 13 and in column 22 the cumulative data of a possible buy on 13 and a sell at the end of 22. To facilitate the research of the values there is a configurable transparency system.
Analysis on 1D Timeframe
Show Daily Summary on : allows to visualise the summary analysis table of the month. The cells contain the summation of the various price deltas for the single day: The first row is the summation of all days of the month for all months in the analysis period, while the other rows represent the analysis for the various days of the individual months.
Show Daily Details of on : allows to visualise the detailed analysis table, choosing to do it for all the months or for a specific month and shows the cumulative data of the various deltas, considering the purchase and the sale in certain days. In the rows are represented the buying days and in the columns the selling days. For example, going to the table "All Months" we can see in the cell at row 1 and at column 3 the cumulative of a possible purchase on the 1st and the sale on the 3rd. To facilitate the research of the values, there is a configurable transparency system.
Table Layout
Size : allows to define the size of the text in the table.
Precision : it is possible to define the decimal precision of the calculations presented in the tables.
Transparency Factor : allows the application of a multiplication factor when the table calculates the transparency of detail tables.
Colours : allows to specify the colours of Profit, Loss and Neutral, besides to adapt a style coherent with the Dark Mode or Light Mode of Trading View
Volatility Filter
It is possible to directly apply a filter to the time series on which the delta is calculated. The volatility filter uses the ATR - an indicator that allows you to calculate the volatility in a given period. Briefly: the higher the ATR value, the higher the volatility. Therefore the filter works by comparing the volatility on two periods and indicates compression or expansion.
Backtest Dates
In order to facilitate the identification of in-sample and out-of-sample data, as well as the degradation of a given behaviour, it is possible to specify a period in which to do the analysis.
Breakout Probability (Expo)█ Overview
Breakout Probability is a valuable indicator that calculates the probability of a new high or low and displays it as a level with its percentage. The probability of a new high and low is backtested, and the results are shown in a table— a simple way to understand the next candle's likelihood of a new high or low. In addition, the indicator displays an additional four levels above and under the candle with the probability of hitting these levels.
The indicator helps traders to understand the likelihood of the next candle's direction, which can be used to set your trading bias.
█ Calculations
The algorithm calculates all the green and red candles separately depending on whether the previous candle was red or green and assigns scores if one or more lines were reached. The algorithm then calculates how many candles reached those levels in history and displays it as a percentage value on each line.
█ Example
In this example, the previous candlestick was green; we can see that a new high has been hit 72.82% of the time and the low only 28.29%. In this case, a new high was made.
█ Settings
Percentage Step
The space between the levels can be adjusted with a percentage step. 1% means that each level is located 1% above/under the previous one.
Disable 0.00% values
If a level got a 0% likelihood of being hit, the level is not displayed as default. Enable the option if you want to see all levels regardless of their values.
Number of Lines
Set the number of levels you want to display.
Show Statistic Panel
Enable this option if you want to display the backtest statistics for that a new high or low is made. (Only if the first levels have been reached or not)
█ Any Alert function call
An alert is sent on candle open, and you can select what should be included in the alert. You can enable the following options:
Ticker ID
Bias
Probability percentage
The first level high and low price
█ How to use
This indicator is a perfect tool for anyone that wants to understand the probability of a breakout and the likelihood that set levels are hit.
The indicator can be used for setting a stop loss based on where the price is most likely not to reach.
The indicator can help traders to set their bias based on probability. For example, look at the daily or a higher timeframe to get your trading bias, then go to a lower timeframe and look for setups in that direction.
-----------------
Disclaimer
The information contained in my Scripts/Indicators/Ideas/Algos/Systems does not constitute financial advice or a solicitation to buy or sell any securities of any type. I will not accept liability for any loss or damage, including without limitation any loss of profit, which may arise directly or indirectly from the use of or reliance on such information.
All investments involve risk, and the past performance of a security, industry, sector, market, financial product, trading strategy, backtest, or individual's trading does not guarantee future results or returns. Investors are fully responsible for any investment decisions they make. Such decisions should be based solely on an evaluation of their financial circumstances, investment objectives, risk tolerance, and liquidity needs.
My Scripts/Indicators/Ideas/Algos/Systems are only for educational purposes!

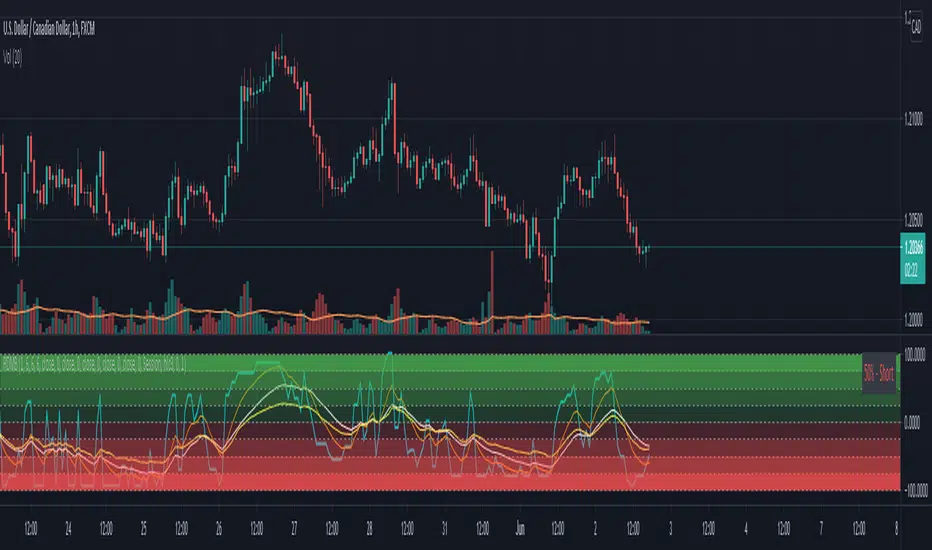
Market Bias (CEREBR)Hello Everyone. I hope you are all doing great. It's been a long time since I posted my first script here, and I got a lot of response from that.
So, I thought I should share this script also to everyone, and anyone that may find it useful. Personally, I use it to tell the general market conditions.
Here's how I works : The script tries to determine the overall direction of the market, using smoothed Heiken Ashi candles. The coloring system (using bright and dark colors) is an attempt to detect strong market and weak market conditions. There's also an oscillator within the script, but for now it isn't plotted. Credits to @jackvmk, I used part of his open-script code in this indicator.\
I have considered using the slope of the indicator plot as a filter for ranging market conditions. The plot goes relatively flat in 'flat' markets. However, I have not done anything about that yet. Maybe some other time.
I hope you find this useful. If you find a way to use this, please share it with the community in the comment section.
NOTE: THIS IS BY NO MEANS FINANCIAL ADVICE. You'll have to make your studies and come up with a way to apply this indicator to your trading style and strategy.
By the way, I would be going with the name 'CEREBR' for any subsequent scripts I release from now on.
Happy Trading, guys.

xBrat BIAS DEPTH HeatmapThis Trading Indicator is the "Go - No Go Gauge" for any trading signals strategy. A Sub-Chart that looks up 6 time frames and gives you real time BIAS. Bullish, Neutral or Bearish on each level. Making decisions, acting on trading signals easier! Only identifying those highest probability trades, no matter what signals trading indicator you are using. Ideal for Forex Trading, Futures Trading, Crypto Trading and Stocks Trading
This BIAS Depth Heatmap includes:
6 Levels of BIAS Depth
Scalping Setting
Day Trading Setting
Swing Trading Setting
And by only concentrating on trading the highest probability trades of any trading strategy, we can block out all the other noise and concentrate on a simple set of rules!
This is why our Founder, Paul Bratby, decided to help filter out all the noise and allow traders to see what's going off on higher timeframes "in depth" to help make those important trade entry decisions. This more global view of the BIAS DEPTH is designed to help traders make decisions faster!

Bias Master SystemName: Bias Master System
Category: Bias (Template/Master).
Operating mode: enters and exits at specific times of the day
Trades duration: a few hours, usually intra-day.
Timeframe: 1H.
Suggested usage: in markets where hourly biases are present.
Entry: enters long and short in predefined times, with possibility to manage trend or volatility filters.
Exit: exits in predefined times.
Usage: It can be used in a variety of ways:
- Together with the Bias Analyzer to quickly check the Bias found by the tool. This allows you to create profitable strategies in less than an hour, as an example the starting point with the Analyzer
- The strategy itself can be used to study the market for interesting biases.
- The strategy can be used as a starting code for the development of one's own strategies.
A tutorial with working examples on BTC and ETH is also available and will be provided with the access.
Configuration:
- Long Trades: possibility to specify two long trades configuration and filter them by day of the week, trend or volatility.
- Short Trades: possibility to specify two short trades configuration and filter then by day of the week, trend or volatility.
- Backtest dates: for splitting the available data in develop, test and validation.
- Results table: possibility to specify decimal precision and Dark Mode
Credits:
- QuantNomad for Results Table
Backtesting:
⁃ Exchange: BINANCE
⁃ Pair: ETHUSDTPERP
⁃ Timeframe: 1H
⁃ Fee 0.025%

Bias Pivot PointA simple indicator that uses Pivot Points as a filter and to generate a Directional Bias .
How to use this indicator?
1. Directional Bias
Bullish => Closing Price > Pivot Point
Bearish => Closing Price < Pivot Point
2. Support / Resistance
Each Pivot Points can be used as Support or Resistance
3. Take Profit Targets
Each Pivot Points can be used as targets for taking profit

Hourly Bias on BTC in Bullish USA Session “Green Eagle”Name: Hourly Bias on BTC in Bullish USA Session
Category: Hourly Bias
Operating mode: Spot, only long
Trades duration: Intraday, 11 bars
Timeframe: 1H
Suggested usage: When the market is compressed, USA session has a bullish bias.
Entry: enter Long at 15:00 on specific days of the week. There is a volatility filter based on ATR which identifies compression.
Exit: exit at a pre-defined time at 01:00
Usage:
⁃ It can be useful to use alerts or webhooks to automate this strategy.
⁃ This is a core system that can be improved in different ways (e.g. Stop-loss, take-profit, position sizing) or studying more the behaviour in the specific days of the week or short when is red.
Configuration:
- N/A
Backtesting
⁃ Exchange: BINANCE
⁃ Pair: BTCUSDT
⁃ Timeframe: 1H
⁃ Fee 0.075%
⁃ Slippage 2
- Start : 2019-01-06
We decided to release this free BTC strategy.
How you or we can improve? Source code is open so share your ideas!

[LanZhu] - Bias With DivergenceDescription
Bias is also known as deviation rate which is a technical index derived from the moving average principle. Its function is to measure the deviation degree between the stock price and the moving average line in the process of fluctuation.
Usage
Generally ,
Moving averages of period 6,12,24 and 72 are used in the calculation. Of course, it is adjustable and result in different sensitivity of the deviation rate.
When the stock price is above the moving average, it is positive.
When the stock price is below the moving average, it is negative.
When the stock price is consistent with the moving average, it is zero.
Example,
1. During weak market, we may take when 6-day deviation rate cross both 5 and -5 level to indicate possible overbought and oversold respectively. Reversal or rebound might happen.
2. During strong market, we may take when 6-day deviation rate cross both 8 and -8 level to indicate possible overbought and oversold respectively. Reversal or rebound might happen.
3. When all the bias lines are moving upward and across 0 line, a strong bullish trend might formed and Vice Versa for strong bearish trend
4. Divergence also added to find possible bull or bear reversal on the default bias period which is configurable.

Volume BiasHere’s an indicator that calculates the difference between the average distance we need to look back to find the up and down volume equal to the total volume of the last n bars. The further we need to look back to find the up or down volume, the more bearish or bullish its value is.
A not-yet published indicator from the PS-V5 blog!

Bias(Deviation Rate)Deviation rate (BIAS), by calculating the distance between the closing price and a moving average to reflect the reversal created by the degree of deviation between the price and the moving average during a certain period of time.
Above the zero axis is called positive deviation and belongs to the bullish zone, while below the zero axis is called negative deviation and belongs to the bearish zone.
Regardless of whether it is a positive deviation or a negative deviation, whenever the gap between the stock price and the moving average becomes larger, it means that the stock price has an overbought/oversold condition, and a high probability will result in a reversal.

RexDog Trade System FoundationThis indicator contains the foundation indicators used when adopting the RexDog Trading System.
The RexDog Trading System uses simple rules, probability, and key areas of market reaction to reverse engineer momentum within the market. These common rules and reactions are shared across all chart types, markets, and timeframes.
The foundation of the philosophy comes from using simple indicators, probability, and rules to answer the 3 questions of trading:
Where is price coming from?
Where is price going?
How does it want to get there?
* note: you should really be asking the 2nd question first.
This indicator contains the core bias and momentum indicators that provide you an edge when adopting the system.
The general philosophy of the trading system is that there are areas in all markets where momentum will be challenged or confirmed. Using various combined elements of this indicator provides you the general ranges of price where you expect a reaction. A reaction is either a confirmation and continuation of momentum or a stall and reversal of momentum.
Another important element of the trading system is the concept of intention. Using simple rules and the elements of this indicator provide you with a general range of where you will look for the intention of future price action.
Before I describe the components of this indicator and general usage I will mention that I use the term “algo” to define all market participants—all the way from the retail trader, hedge fund, big banks, ETFs, family offices, to secret algorithms in underground bunkers we will never know about.
First up here is what is contained within this indicator:
RexDog Average with ATR bands and Extreme ATR Bands – used to define bias within the market or timeframe
3 Momentum EMAs – these are used to define short term momentum
24/9 Avg – You also have the option of having a 24/9 EMA average and an option of turning off the 24/9 EMAs. This also has a plot color change on 9EMA above 24EMA = purple, 9EMA blow 24EMA = fuchsia
2 Simple Moving Averages – 1 short for momentum confirmation and 1 long for bias confirmation
200 options - Ability to plot the 200 AVG (see line below), 200 SMA, or 200 EMA individually. Also option to plot both the 200 SMA (red) and 200 EMA (green)
200 Avg – This plot is an average of the SMA200 and the EMA200. There is also a plot color change based on EMA above SMA = Green, EMA blow SMA = Red.
vWAP – the standard vWAP is added to the foundation as it plays a dual role of confirming both momentum and bias.
Info Panel – This info panel displays the current price, percentage, and ATR of all indicators in the foundation. It also includes a AVG line as well.
* Info panel is turned off by default
Indictor with Info Panel:
Indicator and Trade System Usage and Tips
Now let’s move onto the value of this indicator, how it is unique, and its usage.
The RexDog Average with ATR Bands and ATR Extreme Bands
The RexDog Average (RDA) is a bias-moving average indicator. The purpose is to provide the overall momentum bias you should have when trading an instrument. It works across all markets and all timeframes.
Usage:
Price above the RexDog AVG = long momentum bias
Price below the RexDog AVG = short momentum bias
Under the Hood:
This is so simple most reading this will discount it. The RexDog Average has been tested across all markets—FOREX, Crypto, Equities, Futures (even tick charts), and even the Penguin population in Antarctica.
The RexDog Average is an average of 6 simple moving averages: 200, 100, 50, 24, 9, 5.
There are 2 ATR bands, one above and one below. Just as with the RexDog Average we take the 6 ATR data points (200, 100, 50, 24, 9, 5). We then create an average by dividing by 6. Then add it to the price.
These ATR bands are also used as high probability reaction points.
Exponential Moving Averages
This indictor contains 3 EMAs that are used primarily for short-term momentum.
Usage of these EMAs are not simple cross signals. While crosses of the EMAs are important and do reveal the general story of the chart and momentum in the trading system they are more used as general areas of reaction points.
If the faster EMAs are below the slower EMA then generally we would refer to the algo as being momentum short. Momentum long would be the reverse.
When you combine the EMAs with the RDA you have both momentum and bias defined or at the very least you have high probability areas where momentum will be checked and a reaction is probable.
Moving Averages
There are 2 moving averages in the system foundation.
The 5 is for short-term momentum and high volatility confirmation. The 200 is the standard 200 used in many trading systems.
The 200 MA/EMA average is used in conjunction with the RDA to confirm market bias. Also, it provides a high probability area of market reaction.
The 200 is represented as the average between the 200 simple moving average and the 200 exponential moving average.
The color change in the 200 AVG is as follows. When the 200EMA is above the 200SMA the average line is green, Red when the 200EMA is below the 200SMA.
vWAP
The standard vWAP is also used in the trade system. As most traders who refer to or use the vWAP in their trading know this indicator provides a general area of market reaction. You will often see a check-in at the vWAP for a continuation or confirmation of momentum. Also if price breaks thru the vWAP you can look at this as a breakdown of momentum and an intention of where price might want to eventually go.
Putting it all Together
Before we put it all together, I should also mention that in the trading system there are only 2 types of trades you will do:
Momentum – trades that align with the momentum of the indicator and timeframe
Fade – trades that are against one or multiple indicators and the timeframe
The general usage of this indicator comes from using these as general areas where you expect price to have a reaction.
It starts with the RDA and defining the probability of bias in the market. The general philosophy here is the market will stay in that momentum state until it doesn’t. If the momentum bias is short and the price closes above the RDA then the momentum would be considered bias long. You’re then looking for follow thru and confirmation on following candles.
With bias defined you can then start to analyze and look for areas of reaction using the other indicators in the foundation.
Simple usage is if price is bias short and below the momentum EMAs you would expect a reaction when price comes up to the general area of the EMAs. Also, if the EMAs are confirming the momentum short the best trade is to trade with momentum.
Usually in the situation where all indicators are pointing to one momentum direction there are opportunities to do fade trades. These fade trades are typically when price is extended away from the key indicators. Your expectation in these trades is that price will snap back to test momentum and have some form of reaction at a key indicator area.
Additional usage is analyzing how all elements of this indicator are positioned from one another. For instance, the further the momentum EMAs get from the RDA provides a larger probability that price will eventually want to come and test the RDA area or a lower or upper ATR band of the RDA.
The information panel provides key data points on helping with this analysis.
In closing:
Simple trading typically works. While this indicator contains what some would consider basic market indicators it’s the rules, philosophy, and probability that provide the edge. When these indicators are combined as one and looked at as a whole to define momentum, reaction, and intention in the market it can provide an edge for answering the 3 key questions in trading.

RexDog Market BiasThe RexDog Market Bias takes the RexDog Foundation Base Indicators and applies weighted rules to provide a single percentage bias result based on the chart and timeframe you are looking at.
This should be combined with the RexDog Foundation.
* Consider this a Beta release with many improvements on the way. Also, realize at this time there are no hard rules on using this indicator-- but if you have a basic understanding of the RexDog System you will immediately see it confirms what you see on the chart. Also it will provide some gut checks when you get used to reading the indicator over time. In our initial beta testing, we've found it incredibly useful at a glance.
Indicator Overview
The base teal line is the bias rating.
On top of that you have the option (on by default) of having the m9, m24, and RexDog Average plotted based on this data point.
From there you have Long and Short bias with key 25% increments highlighted. These appear to be important turning points or momentum check-ins for the algo.
That's right these same highly reliable signals you use within the RexDog Trading System also work on the RexDog Market Bias. The same rules apply.
This is much more than an oscillator. It's combining all the RexDog Foundation and applies some initial smart rules to it. Further versions will build upon this.
General Usage:
Fades - when the market is at extremes these are potential signals for high probability fades
Momentum - when the market is coming from an extreme on a pullback to key levels (25, 50, 75) start to look for momentum entries
Don't argue with the chart. If momentum is over 50% look for confirmation from RexDog Trading Rules. The probability that momentum will continue is high when it's between 50-65%.
More rules to come. Finally, share your own findings in the DEN.
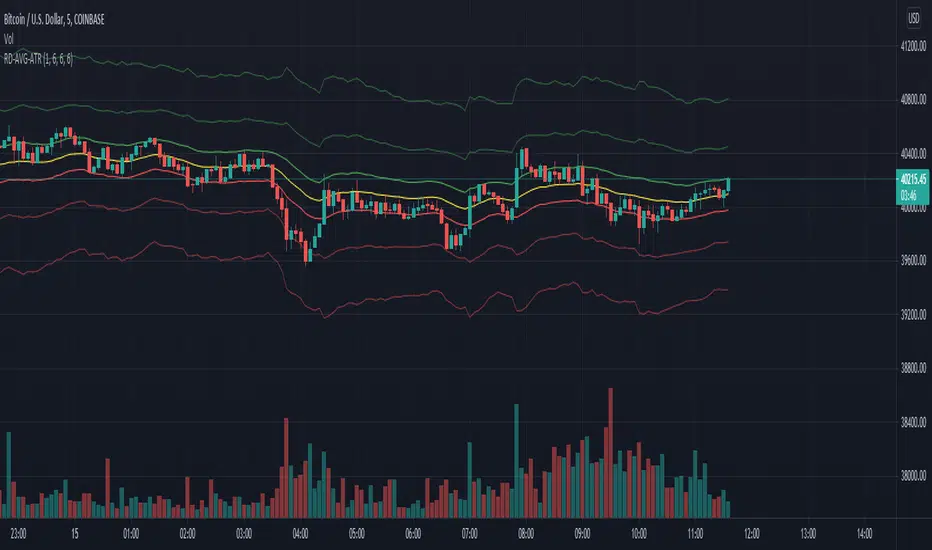
RexDog Average with ATRBam-- look what Rex did. A RexDog Average with ATR bands-- he's going insane. Simple but powerful.
This indicator includes the RexDog average but provides you with the ability to plot (and customize) both above and below ATR calculated bands.
With this indicator you can display all 3 or any combination of the bands: the RexDog Avg, Adding ATR Upper or the Subtracting ATR Below.
To remove a plot or customize color and line size go to the style options.
Before we get detailed with this version you can customize the default average factor of the RexDog Avg (default is 6). More tips on this below.
How This Works
Just as with the RexDog Average we take the 6 ATR data points (200, 100, 50, 24, 9, 5). We then create an average by dividing by 6. But wait there's more...
With this indicator you can customize independently the above and below bands via a float value for precision. 6 is the default (you can customize by increments at 0.25 or input value you like 1-20).
Now this works opposite how you might think but you'll get it once you start changing the numbers. For instance, editing the above band lowering the ATR factor will raise the band.
RexDog Avg Factor
With this release you are able to change the default average factor (6) to anything you want. You'll find though going too high or low from the default won't get the best results. The default increment change is 0.1 but you can enter any float value you like between 1-20.
The Original RexDog Average Overview
Yes, simple—the RexDog Average is a bias moving average indicator. The purpose is to provide the overall momentum bias you should have when trading an instrument. It works across all markets and all timeframes.
Usage:
Price above the RexDog AVG = long momentum bias
Price below the RexDog AVG = short momentum bias
With the ATR addition most likely your usage will be similar to Bollinger Bands. While not the same as in deviations much of the same principles might apply, especially with customization.
*Note: we have banned the word “trend” in the RexDog Trading Method.
Additional Usage Advice:
If price rips through the average your momentum bias should probably change. 80% of the time when price moves through the RexDog Average it will come back and test the area around average within 1-2 bars. 20% of the time it does not. The momentum is so strong in that direction so look for a 50-70% tests of the bar that impulse through the RexDog Average.
If you are using the RexDog Trading Method by default if the price is above the average and you are short you are in a fade trade. The momentum trade would be long. Of course reverse if price is below.
On multiple time frames. Of course, one timeframe can be long bias and a lower timeframe can be short bias. Which one do you use? Both—if your in a short trade using lower timeframe and with the bias of the average your in a momentum trade—but on the higher timeframe your aware you are essential fading the overall momentum.
Background:
Rex and I searched high and low for one simple thing. A moving average (or combination of some) that we could use to form our momentum bias that worked for all timeframes and all markets we trade.
We tried and tested them all. Even went down the path of ribbons and various other types of hybrid EMA /MA derivatives. Nothing had a high enough accuracy or mathematically was reliable that we could say with a high probability that it was on the right side of the momentum.
We almost stopped and landed on using the true and tested 200 MA—but we found through extensive tests that using the 200MA or EMA you’re often late to the party. Look you don’t need to be the first one in the trade but having a heads up sure helps.
To quote one of the best financial movies of the modern era—Margin Call:
“There are three ways to make a living in this business: be first, be smarter, or cheat… it sure is a hell of a lot easier to be first”. The RexDog Average used properly enables you to be first or damn near close.
Under the Hood:
This is so simple most reading this will discount it. You might even scoff and berate Rex for wasting your time. But you would be wrong. The RexDog Average has been tested across all markets—FOREX, Crypto, Equities, Futures (even tick charts), and even the Penguin population in Antarctica.
The RexDog Average is an average of 6 simple moving averages: 200, 100, 50, 24, 9, 5.
Yes, that’s it.
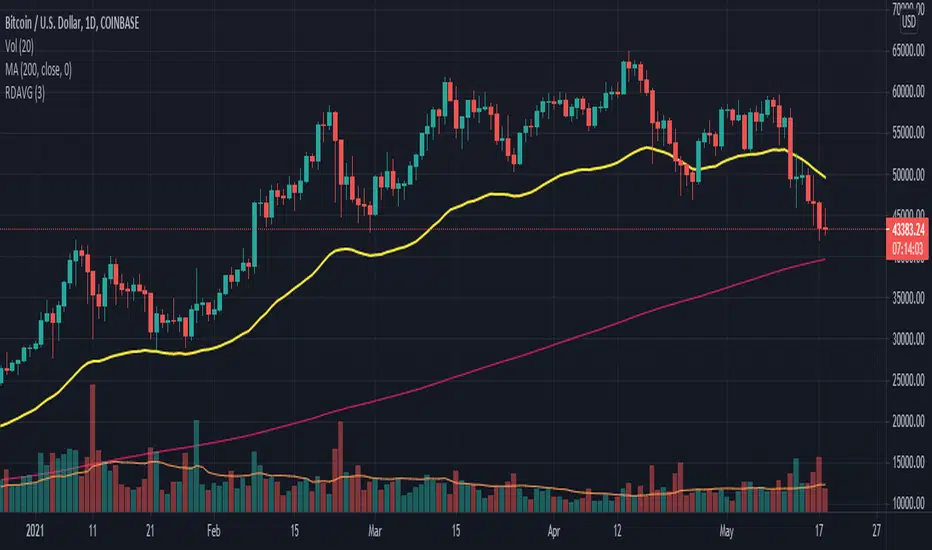
RexDog AverageYes, simple—the RexDog Average is a bias moving average indicator. The purpose is to provide the overall momentum bias you should have when trading an instrument. It works across all markets and all timeframes.
Usage:
Price above the RexDog AVG = long momentum bias
Price below the RexDog AVG = short momentum bias
*Note: we have banned the word “trend” in the RexDog Trading Method.
Additional Usage Advice:
If price rips through the average your momentum bias should probably change. 80% of the time when price moves through the RexDog Average it will come back and test the area around average within 1-2 bars. 20% of the time it does not. The momentum is so strong in that direction so look for a 50-70% tests of the bar that impulse through the RexDog Average.
If you are using the RexDog Trading Method by default if the price is above the average and you are short you are in a fade trade. The momentum trade would be long. Of course reverse if price is below.
On multiple time frames. Of course, one timeframe can be long bias and a lower timeframe can be short bias. Which one do you use? Both—if your in a short trade using lower timeframe and with the bias of the average your in a momentum trade—but on the higher timeframe your aware you are essential fading the overall momentum.
Background:
Rex and I searched high and low for one simple thing. A moving average (or combination of some) that we could use to form our momentum bias that worked for all timeframes and all markets we trade.
We tried and tested them all. Even went down the path of ribbons and various other types of hybrid EMA/MA derivatives. Nothing had a high enough accuracy or mathematically was reliable that we could say with a high probability that it was on the right side of the momentum.
We almost stopped and landed on using the true and tested 200 MA—but we found through extensive tests that using the 200MA or EMA you’re often late to the party. Look you don’t need to be the first one in the trade but having a heads up sure helps.
To quote one of the best financial movies of the modern era—Margin Call:
“There are three ways to make a living in this business: be first, be smarter, or cheat… it sure is a hell of a lot easier to be first”. The RexDog Average used properly enables you to be first or damn near close.
Under the Hood:
This is so simple most reading this will discount it. You might even scoff and berate Rex for wasting your time. But you would be wrong. The RexDog Average has been tested across all markets—FOREX, Crypto, Equities, Futures (even tick charts), and even the Penguin population in Antarctica.
The RexDog Average is an average of 6 simple moving averages: 200, 100, 50, 24, 9, 5.
Yes, that’s it.
The RexDog Average Plus will be released soon with additional parameters and most likely upper and lower bounds. In addition, we are working on a hybrid RexDog Exponential Average.
B3 HL2MA Painter ~ Extremely Smooth Average & Bar PaintMy HL2MA is a 'proprietary' formula based on the idea that I never again want to see a jagged average line. I released a version of this a long time ago, but I wanted to update it to how I have it on my charts in other platforms. Here are some notes about this moving average script:
The default input value is 5, and I suggest the range of use 4-6 with the rare occasion of using 3 or 7.
For me 5 is what I use UNLESS I AM IN A TRADE, then I might switch to 4 if I have some profits to lock, or 6 if I want to stay in for a lengthier trade.
This average when kept within the above parameters is the smoothest MA in my arsenal, HL2 refers to the middle of the candles which further de-noises the line.
The colors are green/red for good movement with the confirmed trend.
The colors are gray for movement against the current trend (signaling a possible mean reversion)
The colors blue & yellow appear when signaling possible chop or trend exhaustion.
Carried forward from the last time I posted this, the bias for longs and shorts is depicted as the color of the average line green or maroon, and ALERTS are based on that overall bias created the line by itself.
Also carried from the last post, the green and maroon clouds depict the price deviance from the line; when the cloud stretches wide it may be time to take profits and enter back in closer to the line.
Thanks again for liking and following!!!!
This share is in response to my 10,000th like on TradingView!
Favorite this one, and enjoy :-)

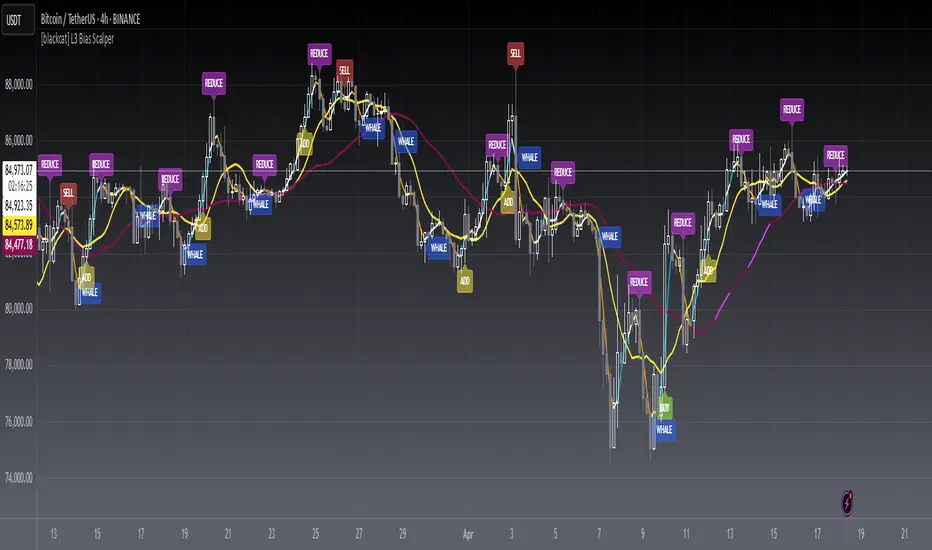
[blackcat] L3 Bias ScalperLevel: 3
Background
Bias alone is a powerful tool for trading. I use SMA3, SMA10, SMA20, SMA30 to cover short and middle term of the trend for scalping. Multiple biases can be introduced for long and short entries.
Function
Use SMAs and biases for scalping with whale move alert (banker fund flow detection)
Key Signal
buy --> entry signal for long
strongbuy --> entry signal for long
add --> buy more or re-entry signal for long
reduce --> partial exit for long
exit --> complete exit for long
sell --> short entry signal
whalemove --> banker fund move detection
Pros and Cons
This script provides entry signal together with whale detection by bias algorithms, you can use whale move to predict next move of trend in large time frame. However, trading signal should be further filtered out for more precise entry signal.
Remarks
At beginning, I want to make it simple and it looks very complex at the end...
Readme
In real life, I am a prolific inventor. I have successfully applied for more than 60 international and regional patents in the past 12 years. But in the past two years or so, I have tried to transfer my creativity to the development of trading strategies. Tradingview is the ideal platform for me. I am selecting and contributing some of the hundreds of scripts to publish in Tradingview community. Welcome everyone to interact with me to discuss these interesting pine scripts.
The scripts posted are categorized into 5 levels according to my efforts or manhours put into these works.
Level 1 : interesting script snippets or distinctive improvement from classic indicators or strategy. Level 1 scripts can usually appear in more complex indicators as a function module or element.
Level 2 : composite indicator/strategy. By selecting or combining several independent or dependent functions or sub indicators in proper way, the composite script exhibits a resonance phenomenon which can filter out noise or fake trading signal to enhance trading confidence level.
Level 3 : comprehensive indicator/strategy. They are simple trading systems based on my strategies. They are commonly containing several or all of entry signal, close signal, stop loss, take profit, re-entry, risk management, and position sizing techniques. Even some interesting fundamental and mass psychological aspects are incorporated.
Level 4 : script snippets or functions that do not disclose source code. Interesting element that can reveal market laws and work as raw material for indicators and strategies. If you find Level 1~2 scripts are helpful, Level 4 is a private version that took me far more efforts to develop.
Level 5 : indicator/strategy that do not disclose source code. private version of Level 3 script with my accumulated script processing skills or a large number of custom functions. I had a private function library built in past two years. Level 5 scripts use many of them to achieve private trading strategy.
EMA Cor Bias [Intromoto]I wanted a way to be able to see whether a separate security was above/below its own EMA(s) and to see those EMA crossovers on a correlated asset.
This script shows barcolors for directional bias of any chosen asset (manual ticker input) according to whether its price is above, below, or between two EMAs. This also includes a candle close requirement of 15 minutes. I use this tool for scalping on lower time frame and so will be able to see a more significant candle close resolution of the external asset.
For example, when BTC price of a given timeframe has closed a 15 minute candle above both BTC EMAs the current chart will barcolor teal, when below both on 15 min candle close, pink, with transition colors black and orange as price is between EMAs.
I've also included a crossover plotshape for when the external asset EMAs crossover/crossunder on the 15 minute candle close.
User can also change whether to simplify the strategy and use only the slow EMA for a three color bias, Teal - bullish, Black - neutral, Pink - bearish. Further experimentation will be made and I'll update accordingly.
DM me for access
Thanks!

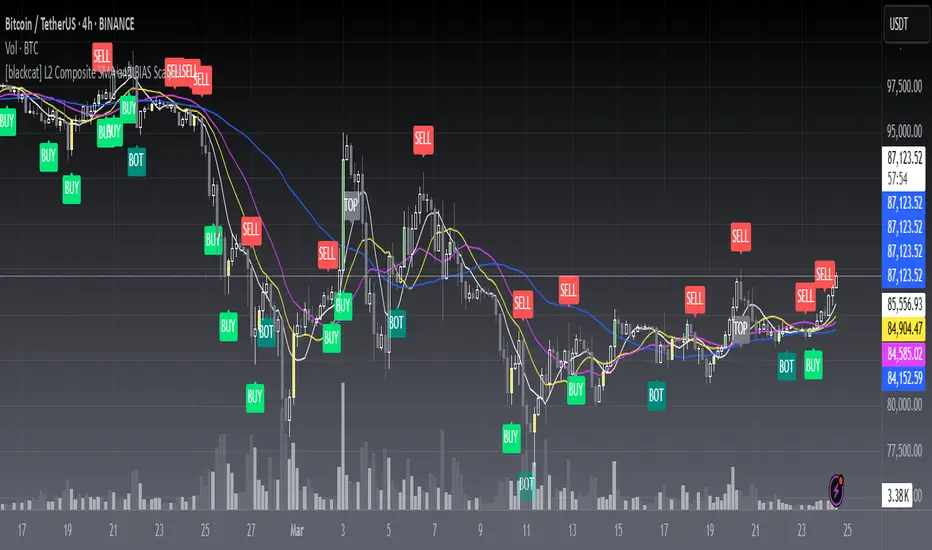
[blackcat] L2 Composite SMA and BIAS ScalperLevel: 2
Background
A simple moving average (SMA) calculates the average of a selected price range, usually closing prices, based on the number of periods in that range. A simple moving average is a technical indicator that can be used to determine whether an asset price is holding a bull, a bear, or is reversing.
The bias shows the moving average rate of deviation. Also known as the rate of deviation, or y-value for short, is an indicator that reflects the degree of deviation between the price and the SMA over a given period by calculating the percentage difference between the market index or the closing price and a moving average to allow for receive that the price reverses or recovers due to a deviation from the moving average trend with strong fluctuations and the price moves within the normal fluctuation range Build credibility to continue the original potential.
Function
L2 Composite SMA and BIAS Scalper is mainly based on a cluster of simple moving averages and their bias values to produce long and short entry points. Three different strategy to generate long and short entries are demostrated together. That is why this is called "Composite".
Key Signal
botsig --> indicating bottom zone
topsig --> indicating top zone
buysigI --> long entry type I
buysigII --> long entry type II
buysigIII --> long entry type III
selsigI --> short entry type I
selsigII --> short entry type II
selsigIII --> short entry type III
Pros and Cons
Pros:
1. common sma(), rsi() and bias() are utizlied to generate exact long and short entries
2. alerts for bottom and top zones
Cons:
1. SMA parameters may need optimization for specific trading pairs
2. No stop loss or take profit scheme is introduced.
Remarks
This is promising but need efforts to refine it.
Readme
In real life, I am a prolific inventor. I have successfully applied for more than 60 international and regional patents in the past 12 years. But in the past two years or so, I have tried to transfer my creativity to the development of trading strategies. Tradingview is the ideal platform for me. I am selecting and contributing some of the hundreds of scripts to publish in Tradingview community. Welcome everyone to interact with me to discuss these interesting pine scripts.
The scripts posted are categorized into 5 levels according to my efforts or manhours put into these works.
Level 1 : interesting script snippets or distinctive improvement from classic indicators or strategy. Level 1 scripts can usually appear in more complex indicators as a function module or element.
Level 2 : composite indicator/strategy. By selecting or combining several independent or dependent functions or sub indicators in proper way, the composite script exhibits a resonance phenomenon which can filter out noise or fake trading signal to enhance trading confidence level.
Level 3 : comprehensive indicator/strategy. They are simple trading systems based on my strategies. They are commonly containing several or all of entry signal, close signal, stop loss, take profit, re-entry, risk management, and position sizing techniques. Even some interesting fundamental and mass psychological aspects are incorporated.
Level 4 : script snippets or functions that do not disclose source code. Interesting element that can reveal market laws and work as raw material for indicators and strategies. If you find Level 1~2 scripts are helpful, Level 4 is a private version that took me far more efforts to develop.
Level 5 : indicator/strategy that do not disclose source code. private version of Level 3 script with my accumulated script processing skills or a large number of custom functions. I had a private function library built in past two years. Level 5 scripts use many of them to achieve private trading strategy.
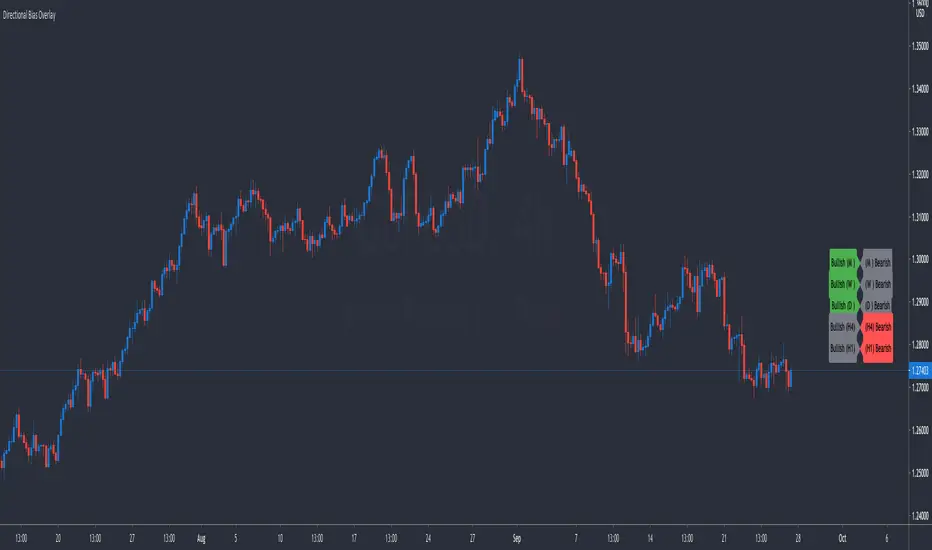
Directional Bias OverlaySimple indicator that keeps track of your thoughts on directional bias from the Monthly Timeframe down to the 1 Hour Timeframe. Features include:
Toggle Timeframes On or Off
Keep Track Of Up To 10 Currency Pairs At A Time
Adjust The Offset From Price So The Indicator Is Out Of The Way
Trends & RangesTrends & Ranges uses EMA ATR bands as a SuperTrend indicator.
How to use:
This indicator can be used to give you a direction bias, with the added function to create ranges which often lead to reversals or flat trading periods. Trade the break-out or wait for pull backs in the direction of the trend.
I'm not great at explaining stuff and will probably make things only more complicated, so I won't bother for now,
but if you have a question on how the script works I will gladly give it a try.
The option "Flexible Trends" will disable the min/max function (trailing or non trailing).
Flexible Trends enabled:
Flexible Trends disabled:
Settings are not optimized for any asset or time frame, you will have to do that for yourself. Feel free to share them in the comments.
Thanks for showing interest, enjoy and good luck! :)

TradeChartist TrendStalker - Market Bias Indicator™TradeChartist TrendStalker helps visualise the Market Bias through 3 different Plot types and also displays Trend Direction Identifier (Green, Red and Orange square blocks) that can be connected to ™TradeChartist Plug and Trade to generate Trade entries, Targets, StopLoss and create alerts based on performance on the chosen timeframe. The three plot types are as below.
1. Market Bias Strength Oscillator
Plots true strength of Market Bias - helps determine if Market is Bullish/Bearish overall for the asset on chart TF.
2. Market Bias Detector - Range Based
Displays TrendStalker plots stalking the Market Bias based on Range the Market is expecting to gain/lose from the asset on the Chart Timeframe. Change in Market Bias can be easily seen through the Convergence/Divergence of the TrendStalker plots.
3. Market Bias Detector - Price
Displays TrendStalker plots stalking the Market Bias based on Price for the asset on the Chart Timeframe. Change in Market Bias can be easily seen through the Convergence/Divergence of the TrendStalker plots.
Note: Trend Direction Identifier for Trade entries will be the same for Market Bias Detector plots, but differs from Market Bias Strength Oscillator.
Note: Trend Direction Identifier plots orange squares when its detecting a potential change in trend and its recommended to close some/most of the position or move Stop Loss to protect profit/reduce risk. Once the orange squares turn back into green/red squares, it signals safe re-entry.
Green squares - Bullish Trend
Red Squares - Bearish Trend
Orange Squares - Potential change in Market Bias
===================================================================================================================
TrendStalker Cool Extras
Option to paint Background Color
Option to enable Take Profit bar recommendation (Works only with Market Bias Strength Oscillator)
Option to paint Price Bars using Market Bias Strength
Alerts can be created for Long/Short Entry/Re-entry and Long/Short SOS signals (Orange squares). For all other alerts, ™TradeChartist Plug and Trade can be used.
BTC 1hr Chart with TrendStalker Extras
===================================================================================================================
BTC 1hr Chart with TrendStalker connected to ™TradeChartist Plug and Trade
===================================================================================================================
This is not a free to use indicator. Get in touch with me (PM me directly if you would like trial access to test the indicator)
Premium Scripts - Trial access and Information
Trial access offered on all Premium scripts.
PM me directly to request trial access to the scripts or for more information.
===================================================================================================================

Separated Moving Average [2] - evoThis is an updated version on one of my previous scripts. Small explanation in the description.
This new script gives you a direction bias based on closing above and below the lines, with an option to filter fake signals by waiting for one more candle close.
Also added more moving averages compared to the first script (built ins + donchian)
Hope you like it!
(If you're a coder with a slightly larger brain than me, please tell me in the comments if I fixed the repainting problem correctly, I'm not 100% sure..)
