Volume-Confirmed Reversal Engine [Scalping-Algo]█ VOLUME-CONFIRMED REVERSAL ENGINE
A reversal detection system combining price action exhaustion with volume confirmation to identify high-probability turning points.
█ WHAT MAKES THIS ORIGINAL?
Unlike oscillators (RSI, Stochastic) that signal at arbitrary levels, VCRE uses a TWO-STEP CONFIRMATION process:
1. ANCHOR CANDLE: Detects when price closes beyond ALL recent candles (not just one), indicating true exhaustion
2. VOLUME VALIDATION: Requires 2x average volume to confirm institutional participation
3. BREAKOUT CONFIRMATION: Waits for price to break back through anchor range before signaling
4. QUALITY SCORING: Rates each signal 1-4 stars based on multiple confluence factors
█ HOW IT WORKS
STEP 1 - ANCHOR DETECTION
• Bullish: Close drops below the LOW of ALL previous N candles + high volume
• Bearish: Close rises above the HIGH of ALL previous N candles + high volume
• This identifies potential exhaustion points with institutional participation
STEP 2 - CONFIRMATION
• Bullish signal: Price must close ABOVE anchor candle's high
• Bearish signal: Price must close BELOW anchor candle's low
• Must occur within specified bars or setup is cancelled
STEP 3 - SCORING (1-4 Stars)
★ Confirmation occurred
★ Anchor had exceptional volume (>2x avg)
★ Confirmation candle has strong volume (>1.2x avg)
★ Aligned with macro trend (200 EMA)
█ HOW TO USE
SIGNALS
• Green "B" = BUY signal | Red "S" = SELL signal
• More stars (★) = Higher probability setup
SETUP BOXES
• Green box = Bullish setup forming, waiting for confirmation
• Red box = Bearish setup forming, waiting for confirmation
DASHBOARD
• Shows status, confirmation countdown, and volume condition
█ RECOMMENDED SETTINGS
| Style | Lookback | Confirm | Volume Multi |
|--------------|----------|---------|--------------|
| Scalping | 10-15 | 2-3 | 1.5x |
| Day Trading | 15-25 | 3-4 | 2.0x |
| Swing | 20-30 | 3-5 | 2.0-2.5x |
█ KEY PARAMETERS
• Candle Lookback: Candles to check for breakout (higher = stronger signals)
• Confirm Within: Max bars for confirmation (lower = faster signals)
• Anchor Volume Multiplier: Volume threshold for anchor candle
• Macro Trend EMA: Trend filter for scoring (default 200)
█ ALERTS
• Buy/Sell Signal - Any confirmation
• High-Quality Buy/Sell - 3+ star signals only
• Setup Detected - When anchor forms (before confirmation)
█ TIPS
• Focus on 3-4 star signals for best results
• Signals near support/resistance add confluence
• Use stop-loss beyond anchor candle extreme
• Test on demo before live trading
Works on all markets: Stocks, Forex, Crypto, Futures
Indicateurs Bill Williams

Market Daily This is a high-accuracy intraday trading indicator designed for indices and stocks, built on trend + institutional levels + volatility control.
The script is non-repainting, rule-based, and suitable for live trading and paid subscriptions.

MACD Backtesting IndicatorThis Pine Script v5 indicator replicates TradingView's standard MACD with full backtesting capabilities. Traders can adjust all parameters (12,26,9 defaults) through inputs and see real-time performance metrics in the table. Buy/sell signals appear as labeled arrows, matching classic MACD crossover strategy while providing visual backtest results for strategy evaluation.

Relative Strength Index - More Lines, Color and Divergence.Modified RSI technical indicator with divergences. Additional colors and more lines have been added.Enjoy.

NQ Command Center [EOD Predictor]This is a sophisticated Macro-correlated Dashboard designed specifically for trading NQ (Nasdaq 100). It attempts to predict how the daily candle will close (Green or Red) by combining Price Action (Market Structure) with External Market Drivers (Yields, Volatility, Dollar, and Breadth).
How This Script Works
The script assigns a "Score" to current market conditions. The higher the score, the more bullish the prediction. The lower the score, the more bearish.
1. The "Structure" Score (Price Action) It looks at the Daily High/Low (PDH/PDL) and recent daily trend:
Bullish (+1): We are making Higher Highs/Higher Lows, or price is holding in the top 33% of yesterday's range.
Breakout (+2): Price has broken above the Previous Daily High (PDH).
Bearish (-1/-2): We are making Lower Highs, or price has broken below the Previous Daily Low (PDL).
2. The "Macro" Score (External Data) It pulls data from 5 external tickers to see if the environment supports a move:
ADDQ (Breadth): If > 0, more stocks are advancing than declining (Bullish).
VXN (Volatility): If falling, fear is decreasing (Bullish).
DXY (Dollar) & US10Y (Yields): If these are dropping, it is usually good for Tech/Nasdaq (Bullish).
CVD (Volume): Estimates if volume is dominated by buyers or sellers.
3. The Prediction (The Output) It sums these scores.
Total Score ≥ 4: "STRONG GREEN CLOSE 🚀" (High confidence Longs)
Total Score ≤ -4: "STRONG RED CLOSE 🩸" (High confidence Shorts)
Near 0: "CHOP / NEUTRAL" (Avoid trading or take quick scalps).
How to Use It Effectively
Symbol: Open a chart for NQ1! (Nasdaq Futures) or NDX.
Timeframe: This is designed for Intraday trading. Use 5m, 15m, or 1h charts. (Do not use on Daily chart, as the table lines up intraday data against daily history).
The Dashboard: Look at the table in the top right.
Focus on "AI Forecast": If it says STRONG GREEN, look for Long setups (pullbacks to support).
Check Confidence: If Confidence is "LOW", the macro data might be conflicting with price action (e.g., Price is going up, but Volume is selling). Be careful.
The Lines: The script plots Green (PDH) and Red (PDL) lines on your chart.
These are key reaction points. If price breaks the Green line, the "Live Status" on the dashboard will switch to BREAKOUT.

LQR Ai (All-in-One Tools)**Are you ready for takeoff? 🚀**
The **LQR To The Moon** indicator is the ultimate trading assistant designed by the **Laqira Protocol** team. We built this tool to replace the clutter of having 5 different indicators on your screen. It combines Trend Following, Momentum, and Volume Analysis into one clean, professional interface.
**🔥 Key Features:**
💎 **Smart Sniper Signals (MTF):**
The indicator uses a hidden engine that analyzes higher timeframes (Multi-Timeframe) to find the perfect entry points. It filters out market noise and provides clean **BUY** and **SELL** signals.
☁️ **Ichimoku Cloud Filter:**
Trend is your friend! The system automatically filters signals based on the Ichimoku Cloud.
* **Bullish:** BUY signals only appear when the price is **Above the Cloud**.
* **Bearish:** SELL signals only appear when the price is **Below the Cloud**.
*(You can toggle the Cloud and Tenkan/Kijun lines in the settings).*
⛽ **Whale Pump Detector:**
Don't miss the move! Candles turn **Neon Purple** whenever there is a massive volume spike (2x average), helping you spot institutional money entering the market.
📊 **Live Dashboard:**
A sleek HUD at the bottom of your screen shows real-time data:
* Market Trend (Based on Cloud)
* MACD Status (Bullish/Bearish)
* Signal Source Timeframe
🛠 **Fully Customizable Tools:**
Need more tools? You can enable them in the settings:
* **Visual EMAs:** Enable up to 2 custom Moving Averages (e.g., 50 & 200). Default is OFF to keep your chart clean.
* **Bollinger Bands:** Toggle BB on/off to analyze volatility.
---
**🚀 How to use:**
1. Add the indicator to your chart (Works best on Crypto & Forex).
2. Wait for a **BUY** signal diamond below the candle.
3. Confirm that the candle is **Neon Purple** (Volume confirmation) or the Dashboard shows "Bullish".
4. Enjoy the ride!
**Why use this?**
Because trading should be simple, fast, and profitable.
**Powered by Laqira Pay.**
#Crypto #Bitcoin #Strategy #Ichimoku #LQR

The Anh - Scalping 1M Pro V1 LOCKEDScalping 1M - Đánh nhanh, rút lẹ . Cần liên hệ chủ sở hữu để lấy Key kích hoạt .

cglimitThis indicator is designed to assist traders in identifying potential limit entry zones along with confirmation signals based on price behavior and technical conditions. It highlights areas where price may react, helping traders plan entries with a structured and disciplined approach.
The indicator provides both Buy Limit and Sell Limit levels, as well as confirmation signals to improve timing and trade confidence. Users can select from four different signal options, allowing flexibility for conservative or aggressive trading styles.
All signals are generated using predefined logic based on historical price data and market structure. This indicator does not predict future price movement and should be used as a decision-support tool, not as a standalone system.
Key features include multi-timeframe compatibility, customizable signal options, and broad market support including Forex, Crypto, Indices, and Stocks. It is suitable for scalping, day trading, and swing trading when combined with proper risk management.
⚠️ This indicator is intended for educational and analytical purposes only and does not provide financial advice. Trading involves risk, and users are responsible for their own trading decisions.
🟢 Why this will FIX the error
✔️ Description long enough
✔️ Explains what indicator does
✔️ Explains signals (4 options)
✔️ No banned words
✔️ TradingView House Rules compliant
📝 Final Checklist (Before clicking Publish)
✅ Description pasted
✅ Category selected
✅ “I swear to abide by House Rules” ticked
✅ Own chart layout used
✅ Publish Private / Protected (NOT public)

Beautiful Buy / Sell IndicatorThis indicator confirms Buy / Sell signal using both Heikin Ashi and awesome oscillator together. it gives a warning for a potential buy/sell first using green/red dot. then if it is confirmed it gives the buy/sell signal using arrows and text and beautifull background colors .the warning alert helps avoiding false trades and give time to the trader to get in the trade. The indicator is customizable and you can change colors and shapes.

Zippo Traffic v3Zippo Traffic v3
Zippo Traffic v3 is an advanced trend-following system that analyzes price movements to determine market direction. Not only does it generate buy and sell signals, but it also highlights uncertain market periods with yellow bars, signaling when new positions should not be opened.
How It Works
This system operates on a traffic light principle:
🟡 Yellow Bars: Indicate market uncertainty – refrain from opening new positions and exercise caution if you are already in a trade.
🟢 Green Bars: Signal a Long/Buy – indicating an uptrend.
🔴 Red Bars: Signal a Short/Sell – indicating a downtrend.
The Alligator (3 EMA) parameters (JawLen, TeethLen, LipsLen) are the only inputs that users can modify; all other technical indicators and calculations are fixed. This minimizes the risk of over-optimization and false signals, preserving the system’s core methodology.
Key Features
Neutral Zones: Unlike conventional trend-following indicators that only provide buy and sell signals, this indicator also identifies neutral areas (yellow bars) in the market.
Momentum + Trend Analysis: It combines multiple criteria to more accurately analyze the market direction.
Standard Price Data: All calculations are based on standard OHLC values. While Heikin Ashi or other candlestick styles may be used solely for enhanced visual clarity, they do not affect signal generation.
How to Use
🟢 Green Bars: Indicate a strong uptrend (Long).
🔴 Red Bars: Indicate a downtrend (Short).
🟡 Yellow Bars: Represent uncertain market conditions; avoid opening new positions during these periods.
Timeframe and Usage Recommendations
Signal quality may be poor in low-volume or illiquid securities.
For optimal results, it is recommended to use timeframes of 30 minutes or higher.
It has proven particularly effective on 4-hour, 8-hour, and daily charts.
Although it can be applied to shorter timeframes, increased price volatility may reduce signal accuracy.
Important Notice
This indicator is developed solely for technical analysis purposes and does not constitute investment advice. Market conditions can change rapidly— even a single candle can break through support or resistance levels. Yellow bars indicate that you should close your existing position and wait, or monitor for trend clarification, but do not necessarily signal an imminent trend reversal. All investment decisions should be made based on your own research and risk management strategies.

Laughing Grid Radar
// ═══ Row 9: 底部装饰线 ═══
table.cell(panel, 0, 9, "▄▄▄▄▄▄▄▄▄▄▄▄▄▄▄▄▄▄▄", bgcolor=c_void, text_color=c_neon_pink, text_halign=text.align_center, text_size=size.tiny)
table.merge_cells(panel, 0, 9, 1, 9)

Smoothed Divergence For Many Indicators | LUPENIndicator Guide: Smoothed Divergence For Many Indicators.
1. What is this Indicator?
'Smoothed Divergence For Many Indicators by LUPEN' is a powerful multi-functional tool designed to detect market reversals and trend continuations. It analyzes the relationship between Price Action and a selected Oscillator (like RSI, MACD, Stochastic, etc.) to identify "Divergences".
Unlike standard indicators that only show you the current value, this tool looks back at history, finds peaks and valleys (pivots), and draws lines connecting them to highlight discrepancies between momentum and price.
2. Key Concepts: The Two Types of Signals
A. Regular Divergence (Reversal Signal) -> R
This occurs when the price trend and the oscillator trend move in opposite directions. It suggests the current trend is losing momentum and a reversal is likely.
Bullish Regular Divergence (Buy Signal):
Price: Makes a Lower Low.
Oscillator: Makes a Higher Low.
Meaning: Sellers are pushing price down, but with less strength than before. Buyers are stepping in.
Visual: A Solid Green line drawn below the price.
Hidden Divergence (Trend Continuation) -> H
This occurs during a pullback in an existing trend. It signals that the main trend is still strong and likely to resume.
Bullish Hidden Divergence (Buy Signal):
Price: Makes a Higher Low (in an uptrend).
Oscillator: Makes a Lower Low.
Meaning: The oscillator cooled off significantly, but price held up well. This "hidden" strength suggests the uptrend will continue.
Visual: A Dashed Blue line drawn below the price.
Bearish Hidden Divergence (Sell Signal):
Price: Makes a Lower High (in a downtrend).
Oscillator: Makes a Higher High.
Meaning: The oscillator rallied hard, but price couldn't break the previous high. This weakness suggests the downtrend will resume.
Visual: A Dashed Orange line drawn above the price.
How to Trade With It
Select Your Oscillator:
Go to the settings and choose your preferred oscillator from the list (RSI is the default and most common).
Tip: RSI is great for general purpose. MACD or OsMA are excellent for trend-following. CCI is good for detecting extremes.
Confirm the Trend:
Look at the chart context. Is the market trending up or down?
If Trending UP: Look primarily for Hidden Bullish (continuation) or wait for Regular Bearish at major resistance levels.
If Trending DOWN: Look for Hidden Bearish (continuation) or Regular Bullish at major support.
Wait for the Signal:
"R" Label: Indicates a Regular divergence (Reversal). Be ready for a potential change in trend direction.
"H" Label: Indicates a Hidden divergence (Continuation). This is often a high-probability entry point to join an existing trend.
T3 Smoothing (Optional but it's the core of the indicator):
The indicator includes a "T3 Smoothing" feature enabled by default. This smooths out the jagged lines of the oscillator to reduce false signals.
Adjustment: If you find the signals are too slow, you can turn off Use T3 Smoothing in the settings to see the raw oscillator data.
Combine with Support/Resistance: A Regular Bullish Divergence that appears exactly at a major Support Level is a much stronger signal than one that appears in the middle of nowhere.

RTH High Low Guardian-Pro# RTH Guardian - User Guide
## Overview
RTH Guardian is a sophisticated intraday trading indicator designed for Regular Trading Hours (RTH) sessions on futures markets like NQ and ES. It tracks the session's highest high and lowest low candles, creating dynamic support and resistance zones while providing real-time quality metrics to help you make informed trading decisions.
Think of this indicator as your trading guardian - it watches over the market structure during RTH, identifies key levels, and warns you when conditions might be unfavorable for entry.
---
## Core Concept: The Three-Line System
When a new session high or low is established, the indicator creates three horizontal lines:
### For Highs (Short Setup):
- **Red Line (High)**: The absolute high of the breakout candle
- **Green Line (Low)**: The low of that same breakout candle
- **Blue Line (HL/2)**: The midpoint - your potential entry zone for shorts
### For Lows (Long Setup):
- **Green Line (Low)**: The absolute low of the breakout candle
- **Red Line (High)**: The high of that same breakout candle
- **Blue Line (HL/2)**: The midpoint - your potential entry zone for longs
The philosophy is simple: trade from the middle, not the extremes. The HL/2 line represents a balanced entry point where you're neither chasing the high/low nor entering too early.
---
## Understanding the Label Metrics
Each HL/2 line displays a floating label with five key pieces of information:
### 💲 Price
The exact price level of the HL/2 midpoint. This is your potential entry price.
**Example**: `💲 21450.75`
### 🛑 Delta (Δ)
The distance between the HL/2 and the opposite extreme of the breakout candle.
- **For shorts**: Distance from HL/2 to the candle's low
- **For longs**: Distance from HL/2 to the candle's high
This tells you how much "room" you have for the trade to breathe. A larger delta generally means more tolerance for adverse movement.
**Example**: `🛑 Δ 15.50` (15.50 points of room)
### ⏰ Time Since Last Hit
How many bars ago the HL/2 level was last touched by price action.
This is your "freshness" indicator. The longer price stays away from a level, the less relevant it becomes as immediate support/resistance.
**Example**: `⏰ 3 bars ago` (Price tested this level 3 bars back)
**Interpretation**:
- 1-3 bars: Very fresh, high relevance
- 4-8 bars: Cooling off
- 9+ bars: Level is aging, price has moved on
### 🎯 Hit Percentage
The quality metric. Shows how many times the HL/2 has been tested out of the total bars since creation.
**Formula**: (Number of hits / Total bars) × 100
**Example**: `🎯 2/5 = 40.0%`
**Color Coding** (when "Use Quality Color" is enabled):
- **Gray** (0%): Untested, no data yet
- **Blue** (<20%): Low interaction, level mostly ignored
- **Green** (20-39%): Moderate quality, decent level
- **Yellow** (40-59%): High interaction, strong level
- **Red** (≥60%): Excessive grinding, potential chop zone
**Trading Insight**: Green and Blue zones often represent the best risk/reward opportunities. Yellow and Red suggest the market is struggling with the level - proceed with caution or avoid.
### 🚀 Breakaway Status
Tracks momentum away from the level - a one-time event that never updates.
**For Highs (Short)**: First candle where the **high** drops below the HL/2
**For Lows (Long)**: First candle where the **low** rises above the HL/2
**Example**: `🚀 1st B-away` (Breakaway achieved on the very first candle)
**Interpretation**:
- **1st-2nd B-away**: Explosive momentum, strong directional move
- **3rd-5th B-away**: Healthy progression away from level
- **6th+ B-away**: Slower momentum, level still has gravity
- **No B-away**: Price keeps returning to level, not breaking free
Early breakaway (1st-3rd) suggests the level is being respected and momentum is strong in the opposite direction. Late or no breakaway suggests the level is "sticky" and might still be in play.
---
## The Guardian Analysis Table
The table in the corner provides a macro view of market conditions with three sections:
### Chop Zone Analysis (Top)
Detects when price is trapped between the High's Low and Low's High - a range-bound danger zone.
**Status Indicators**:
- **Clear** (Green): Clean trending conditions, no overlap
- **Wide Range** (Yellow): Some overlap but tradeable
- **TIGHT CHOP** (Orange): Dangerous grinding between levels
**Example**: `Chop: TIGHT CHOP (4x)` - Price has bounced between the zones 4 times. Stay out or trade breakouts only.
### SHORT Section (Red)
Metrics for potential short setups from the High's HL/2:
- **Seq-H (Sequential Highs)**: How many consecutive higher highs have formed
- Green (<5): Healthy trending
- Yellow (5-9): Extended, caution
- Red (≥10): Severely overextended
- **MFE (Maximum Favorable Excursion)**: Best profit potential if you shorted from HL/2
- Green (>100% of Δ): Excellent movement
- Blue (50-100%): Good movement
- Orange (<50%): Limited movement
- **MAE (Maximum Adverse Excursion)**: Worst drawdown if you shorted from HL/2
- Green (<50% of Δ): Minimal heat
- Yellow (50-80%): Moderate heat
- Red (>80%): Significant heat taken
### LONG Section (Green)
Mirror metrics for potential long setups from the Low's HL/2.
Same interpretation as SHORT section but for long positions.
---
## Trading Psychology: What This Indicator Teaches You
### The Cave Diving Parallel
Just as a cave diver checks their air supply, depth, and safety lines before proceeding deeper, RTH Guardian asks you to check your trading environment before taking a position:
1. **Air Supply = Delta**: Do you have enough room for the trade to work?
2. **Depth Gauge = Hit Percentage**: Is this level quality or are you diving into murky waters?
3. **Safety Line = Breakaway**: Is there momentum carrying price away from danger?
4. **Visibility = Chop Status**: Can you see clearly or is it too stirred up?
### Self-Sabotage Patterns It Reveals
**Pattern 1: Chasing**
If you're tempted to enter when "bars ago" shows 0-1 and hit percentage is already Yellow/Red, you're chasing a grinding level. The indicator is warning you: "This level is being fought over. Choose another entry or wait."
**Pattern 2: Entering Extended Moves**
Sequential highs/lows in Red territory means you're late to the party. The mountain metaphor applies: you're trying to summit a peak when you should have started at base camp.
**Pattern 3: Ignoring the Chop**
Trading when "TIGHT CHOP" shows is like trying to swim against a riptide. The indicator is literally telling you the market is trapped. Step aside.
**Pattern 4: Disrespecting Momentum**
"No B-away" after many bars means price won't leave the level alone. That's the market telling you the battle isn't decided. Don't force a directional bias.
---
## Optimal Usage Workflow
### 1. Session Start (9:30 AM ET)
Watch for the first high and low to establish. Don't rush - let the levels prove themselves.
### 2. Level Creation
When a new high/low forms (indicated by red/green circles), observe:
- Is the Delta substantial? (>10 points on NQ is generally good)
- Check Guardian table: Are we in clear or chop conditions?
### 3. Wait for Quality
Let the level develop. Watch the hit percentage and bars ago metrics update.
**Ideal Entry Window**:
- Hit percentage: Blue or Green zone
- Bars ago: 2-5 (not too fresh, not too stale)
- Breakaway: Achieved within 1st-3rd candle
- Chop status: Clear
- MFE showing good follow-through, MAE manageable
### 4. Avoid When
- Chop status shows TIGHT CHOP
- Hit percentage in Red zone (≥60%)
- Sequential highs/lows ≥10 (severely extended)
- No breakaway after 8+ candles
- MAE significantly exceeds MFE
### 5. Position Management
Use the Delta as your baseline for stops and targets:
- Stop loss: Beyond the extreme (high/low line)
- Target: At minimum 1× Delta, ideally 2× Delta from HL/2
---
## Visual Indicators at a Glance
### Circles
- **Red circle**: New session high established
- **Green circle**: New session low established
### Background Shading
- **Light red shade**: New high breakout zone
- **Light green shade**: New low breakout zone
- **Light gray shade**: Chop zone (price between High's Low and Low's High)
### Line Colors (Default)
- **Red**: Extreme highs
- **Green**: Extreme lows
- **Blue**: Entry zones (HL/2 midpoints)
---
## Common Questions
**Q: Why does the level sometimes update frequently?**
A: During volatile sessions, new highs/lows form rapidly. This is normal. The Guardian table's Sequential count will warn you when it becomes excessive.
**Q: What if both HIGH and LOW labels show high hit percentages?**
A: You're in a consolidation phase. The Chop indicator should reflect this. Step aside and wait for a clean breakout.
**Q: Can I use this on other timeframes?**
A: Yes! The indicator allows you to select 1, 5, 15, 30, or 60-minute timeframes. However, it's designed for RTH sessions (9:30 AM - 4:00 PM ET), so it works best on instruments with distinct RTH hours.
**Q: What's the difference between "bars ago" and breakaway?**
A: "Bars ago" tracks the last time price tested the HL/2 level. Breakaway tracks whether price has definitively moved away from the level (one-time event). You can have a recent hit (bars ago = 1) but no breakaway if price keeps returning.
**Q: Should I always wait for breakaway?**
A: Not necessarily. Breakaway indicates momentum, which is favorable but not mandatory. However, if you see "No B-away" after 10+ candles, that's a red flag that the level lacks conviction.
---
## Advanced Tips
### 1. Confluence with Other Analysis
RTH Guardian works best when combined with your existing analysis:
- Use it to confirm entries from your primary system
- Let it keep you out of low-quality setups
- Treat it as a quality filter, not a standalone signal generator
### 2. MFE/MAE Learning
Over time, study the MFE/MAE ratios in the Guardian table:
- If shorts consistently show high MAE and low MFE, the market has an upward bias
- If longs show the opposite, downward bias exists
- When both directions show high MAE, you're in chop - reduce position sizing
### 3. Session Personality
Each RTH session has its own character:
- Trend days: Levels update frequently, Sequential counts high, one direction dominant
- Range days: Chop status persistent, hit percentages high, MFE/MAE balanced
- Breakout days: Early levels hold, low hit percentages, strong breakaway signals
### 4. Emotional Discipline Integration
Before entering any trade, verbally state:
- "The Delta is X points"
- "Hit percentage is Y% (color)"
- "Breakaway was Zth candle"
- "Chop status is "
This forces you to acknowledge what the indicator is telling you. If you can't justify the entry using these metrics, don't take it.
---
## The Mountain Philosophy
Remember the wisdom from "The Mountain Is You": self-sabotage in trading often comes from ignoring the signs that are clearly visible. RTH Guardian puts those signs directly on your chart.
When you override a Red hit percentage or enter during TIGHT CHOP, you're not "seeing something the indicator missed" - you're engaging in the very self-sabotage patterns that keep you from consistency.
The indicator doesn't predict the future. It holds up a mirror to current market structure and asks: "Given what you can see right now, is this a quality opportunity?"
Your edge isn't in being right every time. It's in consistently taking only the setups where the conditions stack in your favor.
RTH Guardian helps you do exactly that.
---
## Customization Options
The indicator is highly customizable through the settings panel:
### Line Appearance
- Colors for all lines (High, Low, HL/2 for both sides)
- Line thickness (1-10)
- Line style (Solid, Dashed, Dotted)
### Label Settings
- Background colors for HIGH and LOW labels
- Text color
- Font size (Tiny, Small, Normal, Large, Huge)
- Quality color mode (auto-colors based on hit percentage)
### Guardian Table
- Position (9 locations available)
- Font size
- Sequential trend warning threshold (default: 5 bars)
- Grinding trend warning threshold (default: 10 bars)
- Chop zone multiplier (default: 1.5× Delta)
---
## Final Thoughts
RTH Guardian is not a holy grail. It's a discipline tool.
It won't make you a profitable trader overnight, but it will make you honest about the quality of your entries. Over time, that honesty compounds into consistency.
Use it wisely, respect its warnings, and let it guide you away from self-sabotage.
Good trading requires good information + emotional discipline. RTH Guardian provides the information. The discipline is still on you.
---
*"The mountain is you. The obstacles you face are often the ones you create. RTH Guardian helps you see those obstacles before you create them on your chart."*


MAX TRADE ZONA MAX TRADE ZONA is a precision zone-based trading indicator designed to highlight potential Buy/Sell areas and key reaction levels. It helps traders spot structured entries with clear risk planning and cleaner chart visuals. Best used with proper risk management and confirmation (trend, structure, and volatility)

9 HMA Direction Scalper (Pure Flip)new easier 9hma directional pure flip, it will help you with scalping short trends

PhoenixC EMA Strategymnn,h,bm,vbmvcnxfnxvnxvcnvcdgfjfgjfgjfgjdgjdgjdfjdfhsdfghdsfgdghdfhdfhdfhdfhdhdfhdhdf

MAX TRADEMAX TRADE is a professional BUY/SELL signal indicator built for scalping and intraday trading. It generates clear entries and displays pre-defined risk zones directly on the chart to help traders manage positions faster and more confidently.

Sessions + EMAS + Nube (Mini Table)This indicator is designed to help traders analyze market trends and identify potential trading opportunities.
It provides clear visual signals based on price behavior and technical calculations, allowing traders to better understand market structure, momentum, and direction.
The indicator can be used on any market and timeframe, making it suitable for both intraday and swing trading.
It is intended as a decision-support tool and should be used in combination with proper risk management and other forms of analysis.


GBPUSD Institutional Signals - LIVE (Full Suite FIXED)This script is design to show market direction clearer
This script will also help with when the market may be finishing corseting itself and
will show when the continuation is resuming.

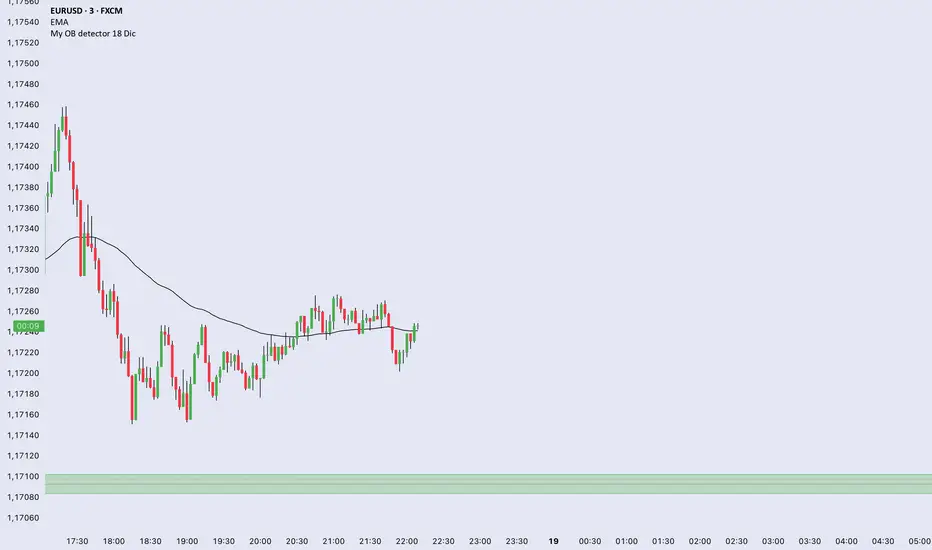
My OB detector 18 DicProfessional Order Block indicator optimized for M3 timeframe. It features automatic 50% entry detection, a strict 1:1 risk-to-reward ratio, and a 10-pip minimum profit filter. Strictly follows the Madrid session hours for Euro and US sessions.