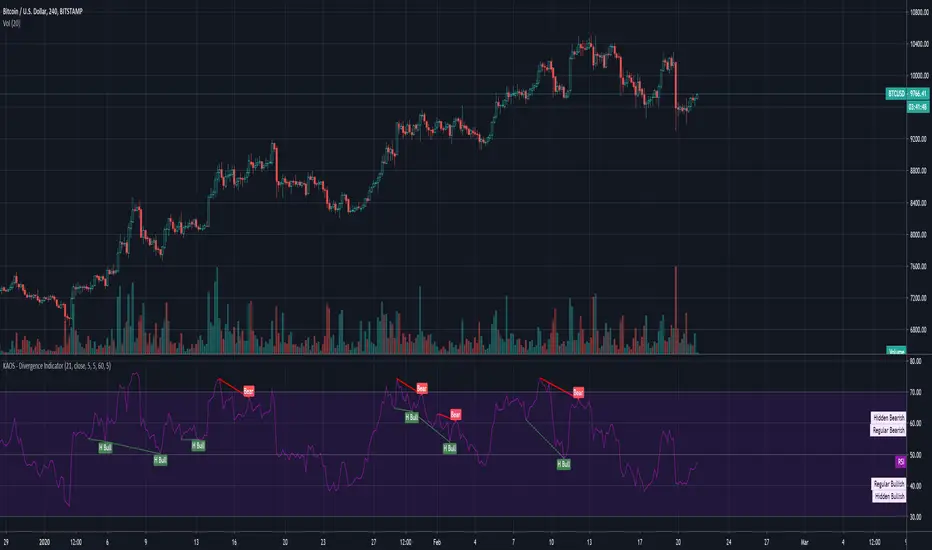
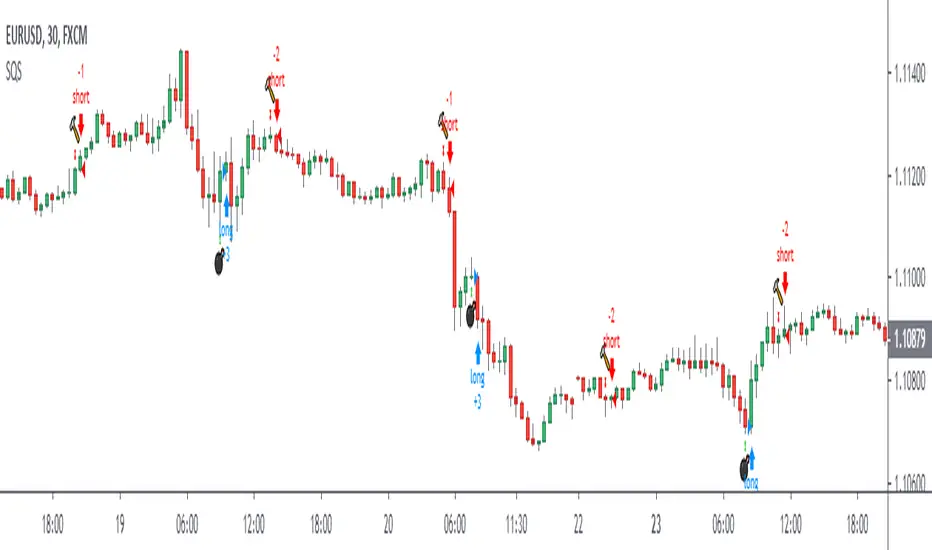
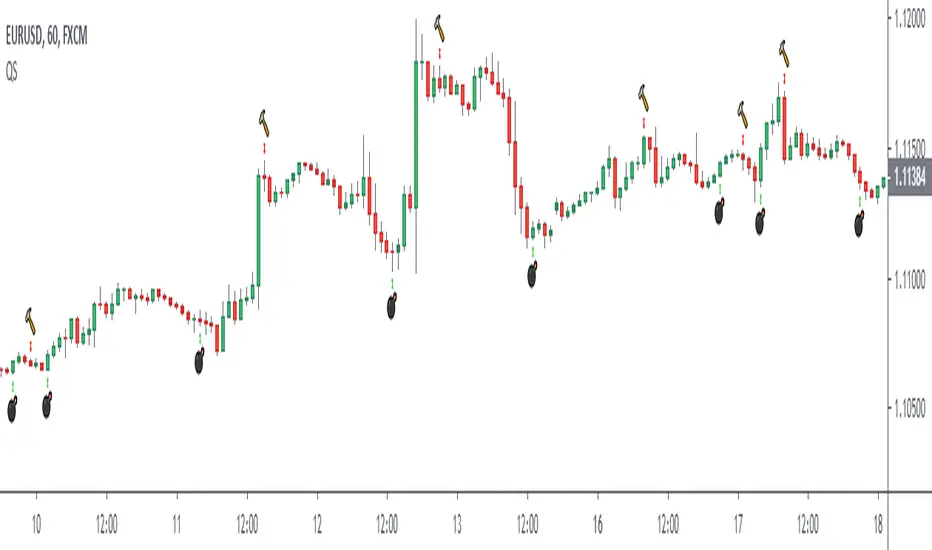
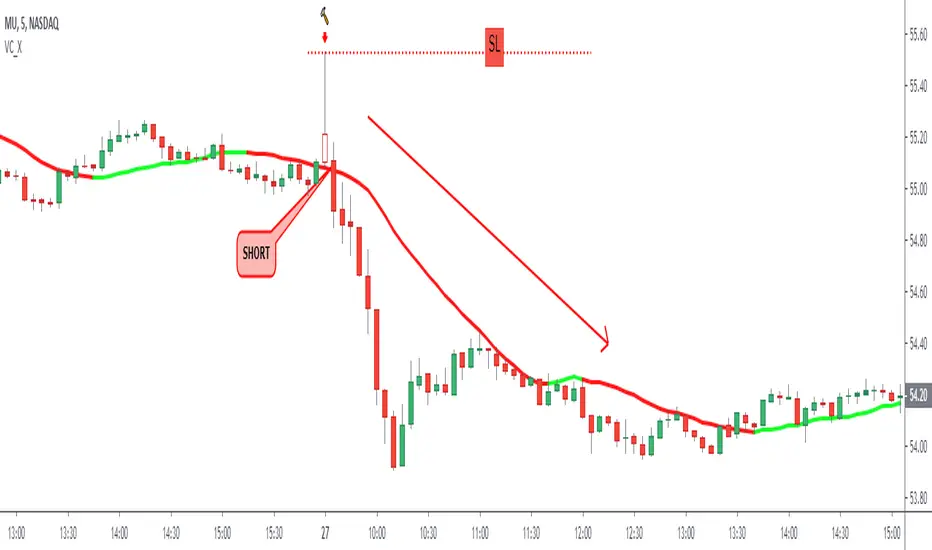
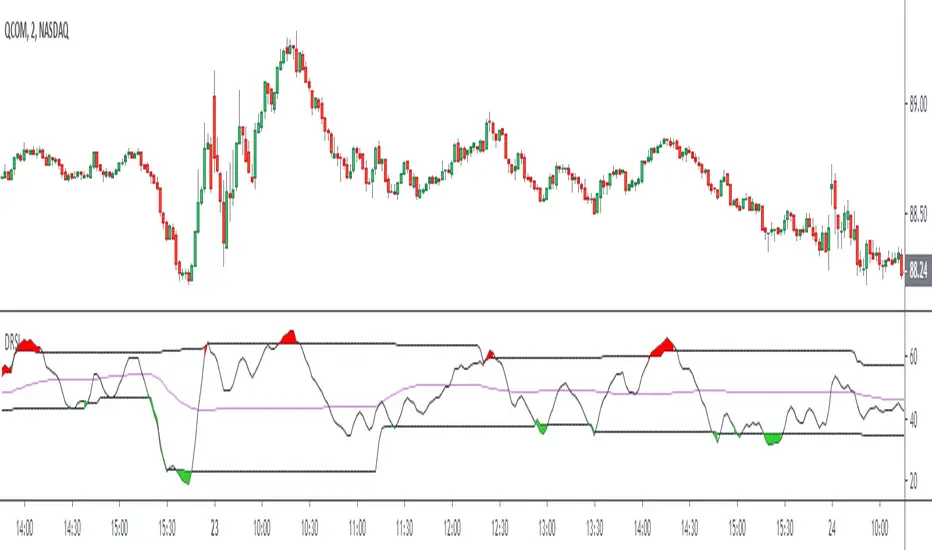
Dear Followers, today another awesome Swing and Scalping Trading Strategy indicator, runnable on a bot , which works great on High Timeframes (1D is suggested) but also on lower ones (just write me in order to help you find correct settings) and even better on 1m Renko chart! If you are a scalper, you will love suggested entries for fast profit. You can run...
This indicator finds possible points of reversion, you can use it to stack positions and get a good average price for when the price changes direction, it is the trader responsibility to manage the position and make a profit. -Added alerts
It is a long only strategy. 1. Buy when price breaks out of the upper band. 2. Exit has two options. Option 1 allows you to exit using lower band. Option 2 allows you to exit using basis line. 3. Slippage and commissions are not considered in the return calculation.
Indicator for pyramidization and coverage. Recommended time frame 60 min. Alerts added.
Strategy for pyramidization and coverage. (Indicator PyramiCover) Recommended time frame 60 min.
This identifies Buy and Sell Points once the period high breaches the SMA High and period low breaches the SMA Low. It produces profitable results greater than 80% of the time.
The PSO is a rewired version of a short-period stochastic. Unlike a standard stochastic oscillator, this indicator is normalized to register neutral values at zero while providing greater sensitivity to short-term price moves. This indicator uses a central zero line as a reference point and will oscillate above and below this point as price fluctuates. In...
MACD normalized with its highest and lowest values over the last “Normalization period” - includes alerts
The KDJ indicator is derived from the Stochastic with the one difference being the addition of the J line. This implies that the KDJ indicator has a total of three lines; %K%D%J. The %J is simply put, the difference between the %K and the %D lines, which is similar to the MACD. The difference between the %J and that of the MACD is that it is plotted as a...
It is a long only strategy. 1. Buy when price breaks out of the upper band. 2. Exit has two options. Option 1 allows you to exit using lower band. Option 2 allows you to exit using moving average. 3. Option 1 preferred over option 2 if the instrument is highly volatile. 4. Slippage and commissions are not considered in the return calculation.
The Market Mode indicator seeks to identify trends and rebounds by identifying “phases” according to the principles of John Ehlers. - When the oscillator passes above the top line, the market is in an uptrend. - When the oscillator goes below the bottom line, the market is in a downtrend. - Between these two levels, the market is calmer and could rebound in the...
I add a basic strategy for the "Quadratic traffic light" indicator, it can help to find a good configuration. Regards.
The quadratic semaphore indicator is an indicator that find confirmed market u-turn with the help of 2 quadratic regression calculated with Highs and Lows over the last “length” periods. - “p” setting is candlesticks quantity to confirmed the quadratic regression has formed a High or Low parabola, such as Fractals. Consecutive same signals can happen due to the...
This script detects an event created by Oliver Velez, it is a wide-range candle with a small body and a long tail (hammer-type candle), its range is noticeably larger than previous candles, as a rule it can be taken that the body should be maximum of 30% of the total range of the candle with a long tail. The stop goes under the tail and the signal is given when...
The Dynamic RSI indicator is a kind of exponential RSI. The overbought and oversold levels (respectively HiLine and LoLine) are calculated according to the recent highest and lowest values of the Dynamic RSI line.
The TMMS oscillator (aka “Trading Made More Simpler”) is an indicator made of conditions based on both 2 separated Stochastic and 1 RSI. Bullish zone is green and bearish one is red. When the histogram is grey, no signals is available at that time. The indicator has an option to show the current trend of an Hull moving average (ascending or descending curve)....