[HA] Heikin-Ashi Shadow Candles// For overlaying Heikin Ashi candles over basic charts, or for use in it's own panel as an oscillator.
// Enjoy the visual cues of HA candles, without giving up price action awareness.
// Good for learning and comparison.
// Aug 11 2022
Release Notes: * Bugfix: Candle color was based on classic direction not HA direction (did not update cover photo).
// Aug 12 2022
Release Notes: * Implemented true oscillator mode.
Provided as separate plot (styles tab) or mode switch option (Inputs tab). TV gets spazzy with "styles tab" "default hidden" plots, and will reset them if any variables are modified that affect them (i.e. wick color override). Mode switch should be sufficient for both users.
// Aug 21 2022
Republished because of typo in indicator name prevented search.
Candles

Commodity Channel Relative StrengthNew concept(I think atleast) I've joined the Standard RSI and CCI at the hip with another plotcandle, which gives a picture of a larger candle With more interesting movement imo. Includes Fib Retracement Levels, High/Low and a couple of coppock curves for more confirmation. Broadening candles seem to indicate a weakening of trend strength (from what i've seen atleast) although exceptions do occur. Vice versa for tapering to a lesser degree I imagine. RSI has been shifted down to 0 to align the center point with the CCI , so the usual 30/70 RSI Levels are now -20/20 (although I have 30/-30 instead for the hlines).

OHLC MTFThe script allows you to plot the opening, highest, lowest and closing (ohlc) values of a previous candle.
Settings :
- "Time Frame" : allows you to choose the reference time frame;
- "Offset" : sets which candle to select the data from.
Ex : If you select "1 day" as the time frame and "1" as the offset, the OHLC values of yesterday's daily candle will be displayed (regardless of your current time frame).

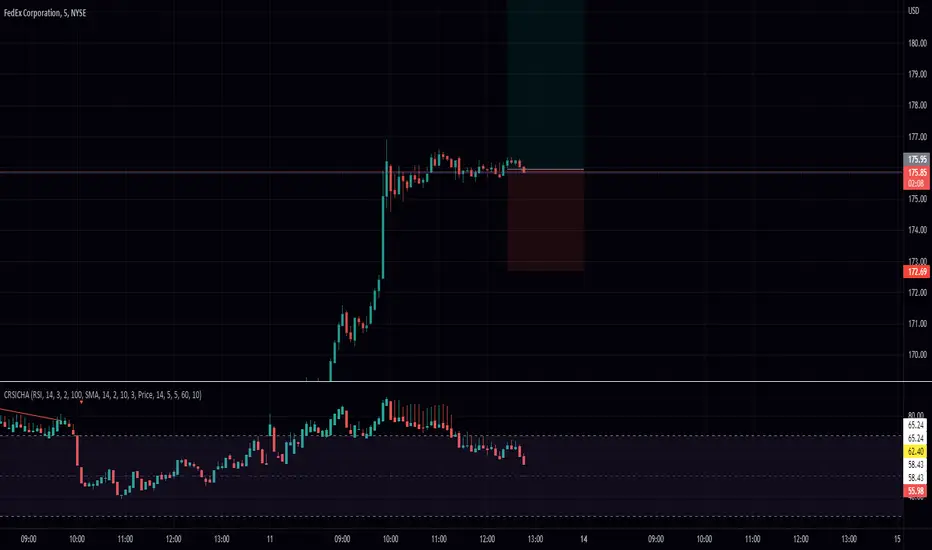
RSI Candle with Connors RSI and Heikin Ashi (CRSICHA)This script was designed to work and feel like the built in RSI script but with a lot of added feature that traders might enjoy. You get to see the RSI represented as candle sticks OR Heikin Ashi. I have added in Connors RSI as a bonus so you can see what this lesser used study looks like in candle form. Just like in the original script I have moving averages and Bollinger Bands. I must say, Heikin Ashi really excells in this situation because you don't need to know an exact price! As always I hope every one finds this useful! Enjoy!
RSI Precision Trend Candles [Loxx]RSI Precision Trend Candles is a candle coloring indicator that uses an average range algorithm to determine trend direction. The precision trend algorithm can be used on any calculated output to tease out interesting trend information.
What is RSI?
The relative strength index (RSI) is a momentum indicator used in technical analysis. RSI measures the speed and magnitude of a security's recent price changes to evaluate overvalued or undervalued conditions in the price of that security.
The RSI is displayed as an oscillator (a line graph) on a scale of zero to 100. The indicator was developed by J. Welles Wilder Jr. and introduced in his seminal 1978 book, New Concepts in Technical Trading Systems.
Included
Bar coloring
Signals
Alerts
Loxx's Expanded Source Types
Candle Stick UpdateHeikin ashi chart so powerful that you can understand trend direction easily. But sometimes, this type of chart doesn't update properly and make no sense on real time. So I made this script. You can now change candle stick style default to heikin ashi (default / modified version) on the real time default chart without switching heikin ashi chart. Enjoy traders!!! And don't forget to press the like button :)

Extreme Bars"Extreme Bars" is a simple but useful indicator that marks overbought and oversold candles. This indicator paints candles that fall far above the average red, and the candles that rise above the average green. Of course, they can change these colors if they want. "Extreme Bars" can be interpreted in many different ways. The starting points of colored candles can often be good support or resistance. In addition, it would be wise to close the positions opposite the colored candles and to maintain the positions compatible with the colored candles. It is also possible that the gaps formed by the colored candles will be closed in the future. The sensitivity of the indicator can be changed in the settings section.

Magnifying Glass (LTF Candles) by SiddWolf█ OVERVIEW
This indicator displays The Lower TimeFrame Candles in current chart, Like Zooming in on the Candle to see it's Lower TimeFrame Structure. It plots intrabar OHLC data inside a Label along with the volume structure of LTF candle in an eloquent format.
█ QUICK GUIDE
Just apply it to the chart, Hover the mouse on the Label and ta-da you have a Lower Timeframe OHLC candles on your screen. Move the indicator to the top and shrink it all the way up, because all the useful data is inside the label.
Inside the label: The OHLC ltf candles are pretty straightforward. Volume strength of ltf candles is shown at bottom and Volume Profile on the left. Read the Details below for more information.
In the settings, you will find the option to change the UI and can play around with Lower TimeFrame Settings.
█ DETAILS
First of all, I would like to thank the @TradingView team for providing the function to get access to the lower timeframe data. It is because of them that this magical indicator came into existence.
Magnifying Glass indicator displays a Candle's Lower TimeFrame data in Higher timeframe chart. It displays the LTF candles inside a label. It also shows the Volume structure of the lower timeframe candles. Range percentage shown at the bottom is the percentage change between high and low of the current timeframe candle. LTF candle's timeframe is also shown at the bottom on the label.
This indicator is gonna be most useful to the price action traders, which is like every profitable trader.
How this indicator works:
I didn't find any better way to display ltf candles other than labels. Labels are not build for such a complex behaviour, it's a workaround to display this important information.
It gets the lower timeframe information of the candle and uses emojis to display information. The area that is shown, is the range of the current timeframe candle. Range is a difference between high and low of the candle. Range percentage is also shown at the bottom in the label.
I've divided the range area into 20 parts because there are limitation to display data in the labels. Then the code checks out, in what area does the ltf candle body or wick lies, then displays the information using emojis.
The code uses matrix elements for each block and relies heavily on string manipulation. But what I've found most difficult, is managing to fit everything correctly and beautifully so that the view doesn't break.
Volume Structure:
Strength of the Lower TimeFrame Candles is shown at the bottom inside the label. The Higher Volume is shown with the dark shade color and Lower Volume is shown with the light shade. The volume of candles are also ranked, with 1 being the highest volume, so you can see which candle have the maximum to minimum volume. This is pretty important to make a price action analysis of the lower timeframe candles.
Inside the label on the left side you will see the volume profile. As the volume on the bottom shows the strength of each ltf candles, Volume profile on the left shows strength in a particular zone. The Darker the color, the higher the volume in the zone. The Highest volume on the left represents Point of Control (Volume Profile POC) of the candle.
Lower TimeFrame Settings:
There is a limitation for the lowest timeframe you can show for a chart, because there is only so much data you can fit inside a label. A label can show upto 20 blocks of emojis (candle blocks) per row. Magnifying Glass utilizes this behaviour of labels. 16 blocks are used to display ltf candles, 1 for volume profile and two for Open and Close Highlighter.
So for any chart timeframe, ltf candles can be 16th part of htf candle. So 4 hours chart can show as low as 15 minutes of ltf data. I didn't provide the open settings for changing the lower timeframe, as it would give errors in a lot of ways. You can change the timeframe for each chart time from the settings provided.
Limitations:
Like I mentioned earlier, this indicator is a workaround to display ltf candles inside a label. This indicator does not work well on smaller screens. So if you are not able to see the label, zoom out on your browser a bit. Move the indicator to either top or bottom of all indicators and shrink it's space because all details are inside the label.
█ How I use MAGNIFYING GLASS:
This indicator provides you an edge, on top of your existing trading strategy. How you use Magnifying Glass is entirely dependent on your strategy.
I use this indicator to get a broad picture, before getting into a trade. For example I see a Doji or Engulfing or any other famous candlestick pattern on important levels, I hover the mouse on Magnifying Glass, to look for the price action the ltf candles have been through, to make that pattern. I also use it with my "Wick Pressure" indicator, to check price action at wick zones. Whenever I see price touching important supply and demand zones, I check last few candles to read chart like a beautiful price action story.
Also volume is pretty important too. This is what makes Magnifying Glass even better than actual lower timeframe candles. The increasing volume along with up/down trend price shows upward/downward momentum. The sudden burst (peak) in the volume suggests volume climax.
Volume profile on the left can be interpreted as the strength/weakness zones inside a candle. The low volume in a price zone suggests weakness and High volume suggests strength. The Highest volume on the left act as POC for that candle.
Before making any trade, I read the structure of last three or four candles to get the complete price action picture.
█ Conclusion
Magnifying Glass is a well crafted indicator that can be used to track lower timeframe price action. This indicator gives you an edge with the Multi Timeframe Analysis, which I believe is the most important aspect of profitable trading.
~ @SiddWolf

[FR]Custom Candles/FVG/nSideBarCustom Candles /FVG/ nSideBar
- I used this as a learning project for understanding plot()'s Better
- My goal was to see if I could use normal plots to cleanly plot FVGs on the chart using only plots with out and boxes/lines
The problem was if multiple FVGs were on back to back bars the plot fill would fill the line to the next FVG/Bar
I solved this by using 4 plots and alternating them if consecutive FVGs form
- 2 MODES
- Slim
- Normal
//////////////////////////////////////////////////////////////////////////////////////////////////////////////////////////////////////////////////////////////////////////////
-Slim
Uses 3 plotcandle() parts and divides the candle between body/wicks/open and close
by manipulating the ohlc inputs and the colors I was able to pretty make them full customizable
all components are customizable with up/down colors
-Normal
These are your normal candles but they are full customize able from components to individual up/down colors
--------------------------------------------------------------------------------------------------------------------------------------------------------------------------------------------------------------------------------------------------------
- FVGs
There are 2 FVG settings can be used with both MODES
- Big
These are the FVGs that use plots and since there isn't a 500 object limit on plots you don't need to manage them in the code and they are there how ever far you need to look back
- Slim
These use a Line and the width of the line can be adjusted for user preferences
--------------------------------------------------------------------------------------------------------------------------------------------------------------------------------------------------------------------------------------------------------
- INSIDE-BARS
These will change the color of the body of either SLIM or NORMAL Candles
--------------------------------------------------------------------------------------------------------------------------------------------------------------------------------------------------------------------------------------------------------
Drawing Snap Features Work Just Fine!
I suggest hiding your chart candles with the eye in the top left of the screen and moving the indicator to the top of your object tree
I understand that the candles in the chart pictures are impractical I was just demonstrating the functionality of the tool
Hope You Enjoy!!
FFriZz

Better Heiken-Ashi Candles w/ Expanded Source Types [Loxx]Better Heiken-Ashi Candles w/ Expanded Source Types is an indicator to compare regular candles to traditional Heiken-Ashi candles to "better" Heiken Ashi candles. This indicator and comparison study appears an oscillator. The purpose of this indicator is to demonstrate a better way to calculate HA candles and also to demonstrate expanded source types. This indicator is meant to be used by advanced Pine Coders who wish to add fine-tuning to their indicators and strategies.
What are Heiken Ashi "better" candles?
The "better formula" was proposed in an article/memo by BNP-Paribas (In Warrants & Zertifikate, No. 8, August 2004 (a monthly German magazine published by BNP Paribas, Frankfurt), there is an article by Sebastian Schmidt about further development (smoothing) of Heikin-Ashi chart.)
They proposed to use the following :
(Open+Close)/2+(((Close-Open)/(High-Low))*ABS((Close-Open)/2))
instead of using :
haClose = (O+H+L+C)/4
According to that document the HA representation using their proposed formula is better than the traditional formula.
What are traditional Heiken-Ashi candles?
The Heikin-Ashi technique averages price data to create a Japanese candlestick chart that filters out market noise.
Heikin-Ashi charts, developed by Munehisa Homma in the 1700s, share some characteristics with standard candlestick charts but differ based on the values used to create each candle. Instead of using the open, high, low, and close like standard candlestick charts, the Heikin-Ashi technique uses a modified formula based on two-period averages. This gives the chart a smoother appearance, making it easier to spots trends and reversals, but also obscures gaps and some price data.
What's going on with this indicator?
- First, we have the options to select the candlestick type: Regular, HA, HA Better
- Next, and to demonstrate the expanded source types, I've added a simple moving average. In the drop down for the SMA source you'll notice something very different from the typical TradingView source selector. Here's how to decode the new names for the sources:
Close = close
Open = open
High = high
Low = low
Median = hl2
Typical = hlc3
Weighted = hlcc4
Average = ohlc4
Average Median Body = (open+close)/2
Trend Biased = (see code, too complex to explain here)
Trend Biased (extreme) = (see code, too complex to explain here)
... for HA and HA better, see the same set up as above but with different open and close values to calcualate the other source types
- For the HA better calculations, we run the close value through either an Adaptive, Kaufman, or T3 smoothing filter. The length for these smoothing filters, either 2 or 3, can be found in the code and is a constant value that shouldn't be changed. This smoothing is in inline with what is described in the article mentioned above
- Lastly, I've placed an SMA over the oscillator so that the user can test out the various sources explained above
Included:
- Toggle on/off bar coloring

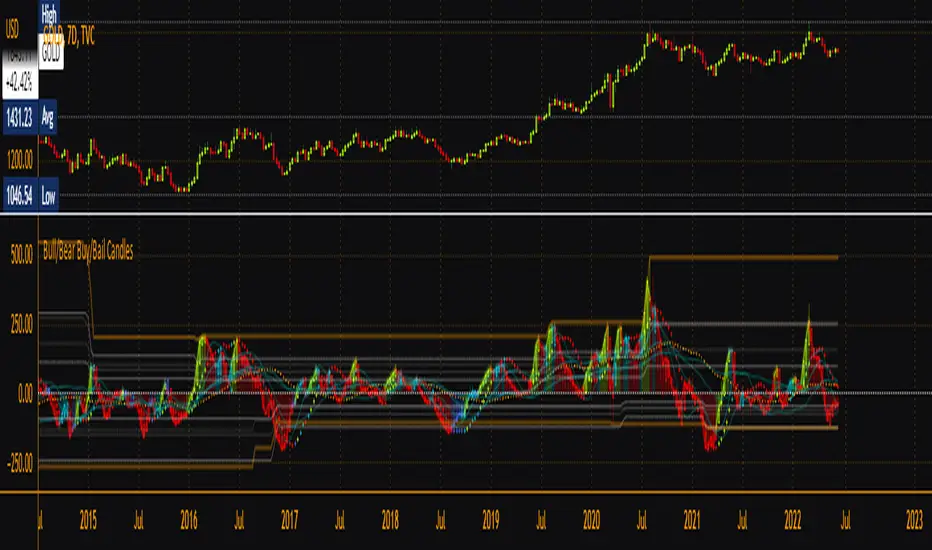
Bull/Bear Buy/Bail CandlesBased on BullBearPower indicator, this is a heavily modified version with colored candles to show when bulls or bears are buying or bailing. Includes Fibonacci Levels based on Highest/Lowest value in variable length, along with optional second timeframe and alternative calculation for candles and linear regression curves for increased versatility. Green = bullish /long, Aqua = still-bullish albeit weakening, blue = weak albeit strengthening and red = weak/short. Perfect as a confirmation indicator for those looking to time markets.
Relative Aggregate Strength OscillatorCredits to
@wolneyyy - "Mean Deviation Detector - Throw Out All Other Indicators"
And
@algomojo - "Responsive Coppock Curve"
And the default Relative Strength Index
The candles are the average of the MFI ,CCI ,MOM and RSI values presented as candles, they seemed similar enough in style to me so I created candles out of each and the took the sum of all the candle's OHLC values and divided by 4 to get an average.
In the Background we have @wolneyyy's - "Mean Deviation Detector - Throw Out All Other Indicators" in blue
along with @algomojo's - "Responsive Coppock Curve" in red and green.

Infiten's Return Candle OscillatorInfiten's Return Candle Oscillator is an oscillator which shows the percentage return on the open, high, close and low over a customizable period in the form of candlesticks. It may be helpful for seeing volatility, swing trading, or mean reversion trading.
The RCO consists of two plotted elements :
RCO Candles (short length): candlesticks which are plotted with low = the product of the percentage changes in the low over a period, high = the product of the percentage changes in the high over a period, close = the product of the percent changes in close over a period, and open = the product of the percentage changes in return over a period. Similarly to with standard candlesticks, if the percentage change on the close is higher than the percentage change on the open, the candlestick is green, otherwise it is red.
Smoothed RCO Line (long length) : a moving average of the average of the low, close, open and high calculated for the RCO Candles. The line's transparency is determined by the percentage difference between the RCO and the highest or lowest RCO over the long length. A more transparent line means that the RCO is closer to the highest or lowest RCO, and may be indicative of a reversal, or weakening trend.

2TimeFrame Candles by EsIstTurnt//Not my original idea, Ive pretty much just doubled the code to have 2 Candles .All Credit goes to the creator of "Multi-Time Period Charts" as I have it saved in my library. I cant find it anymore and searching the script doesn't appear it seems so if its you let me know (and ill credit you). Why did I opt to plot 2 candles you say? 2*candles=(info)*2. 3 if we count the regular plot. Anything more than that and its too busy/blurring to really visualize trends but this was a bit of a game changer no more switching timeframes back and forth .

Liquidity Heatmap LTF [LuxAlgo]This indicator displays column heatmaps highlighting candle bodies with the highest associated volume from a lower user selected timeframe.
Settings
LTF Timeframe: Lower timeframe used to retrieve the closing/opening price and volume data. Must be lower than the current chart timeframe.
Other settings control the style of the displayed graphical elements.
Usage
It can be of interest to show which candles from a lower timeframe had the highest associated volume, this allows for the highlighting of areas where a candle body was the most traded by market participants.
The area with the highest activity is highlighted in the script with a yellow color (or another user selected color) and additionally by two lines forming an interval.
When the candle body with the highest volume is overlapped by a candle body with lower volume this one will be highlighted instead, hence why certain areas of high activity might not be highlighted by the heatmap.
It is recommended to hide regular candles or use a more discrete graphical presentation of prices when using this tool. Lines are also displayed to highlight the full candle range as well as if a candle was bullish (in green) or bearish (in red). These lines can be hidden if the user is only interested in the heatmap.

CANDLE FILTER Todays scripts is based on my Pullback And Rally Candles with other meaningful candles such as Hammers and Dojis.
You can choose which Candles to show on the cart and if you want to candles to appear above or below a moving average.
If you follow my work, you may recognise some of these candles which I'm about to show you however these candles are 1) more refined and 2) has moving average filters.
Ive included a D,6H,1H Candle in this script as on different timeframes - each swing low on average has a different amount of bars within the swing low / swing high so the DPB and RD will only work on the Daily
//Pullback candle
This candle is very powerful when used with simple Price Action such as Market Structure//Demand zones and support zones. (((((WORKS BEST IN UPTRENDS AND BOTTOM OF RANGES)))))
Ive included a D,6H,1H Pullback Candle in this script as on different timeframes - each swing low on average has a different amount of bars within the swing low so the DPB will only work on the Daily
//DAILY PULLBACK (Swing Traders)
snapshot
//4H PULLBACK (Swing Traders)
snapshot
- this signal will produce more signals due to the swing low filter on the 4H
//1H PULLBACK
snapshot
- this signal has been refined due to too many candle displaying in weak areas
!!!IF YOU DONT WANT TO USE PULLBACKS DURING DOWNTRENDS THEN USE THE EMA FILTER TO TURN OFF THE PULLBACKS WHEN PRICE IS BELOW THE MOVING AVERAGE!!!
//Rally candle (My personal Favourite) (((((WORKS BEST IN DOWNTRENDS AND TOP OF RANGES)))))
This candle is very powerful when used with simple Price Action such as Market Structure//Supply zones and Resistance zones.
//DAILY RALLY(Swing Traders)
snapshot
//4H RALLY(Swing Traders)
snapshot
- this signal will produce more signals due to the swing high filter on the 4H
!!!IF YOU DONT WANT TO USE RALLIES DURING UPTRENDSTHEN USE THE EMA FILTER TO TURN OFF THE RALLIES WHEN PRICE IS ABOVE THE MOVING AVERAGE!!!
//POWERFUL DOJIS (INDECISION)
snapshot
We look for indecision in key areas to see if momentum is shifting. When combined with Pullbacks or Rallys - this will enhance the odds of a probably area.
//HAMMERS
snapshot
//MOVING AVERAGES
snapshot
Short EMA = 50
Long EMA = 200
This filter can be used when the market is trending - look out for rejections off the moving averages
Also you can chance the Short And Long EMA to choose which MA cross you want to use
snapshot
ALSO ALL THE CANDLES HAVE A ALERT CONDITIONS WHICH YOU CAN ACCESS - THIS WILL ALERT ANY CANDLE YOU CHOOSE
Please leave a like/comment on this post as this is much appreciated....

No Active BarThis is probably the only script on TradingView that's clinically proven to lower your blood pressure!***
This script in conjunction with some chart settings changes can completely hide the active candle, only showing historic candles, thus, reducing risk of cardiac arrest and or panic attack.
What to do:
0. Make sure you are using a candlestick chart or this script won't work properly
1. Right click the chart and select "Settings..."
2. Select "Symbol" under the "Chart Settings" menu
3. Disable every item EXCEPT for the "Body"
4. Click on the boxes next to "Body" to access the color picker then change both box's transparency settings down to 0
(the script only colors closed bars, so the active bar will be present just transparent)
5. Right click on the price scale on the far left or far right side of the screen and hover the mouse over "Labels". If any selections have a check mark next to them click them to disable them (especially the "Ask & Bid" price setting since it tracks current price)
That's it! Instead of wicks the High & Low prices are plotted above and below the candles using a step line. It looks a bit strange at first but you'll get used to it. Check out the indicator settings to change the color and style of the High & Low lines.
***The statement could prove true for some but is mostly complete bullshit

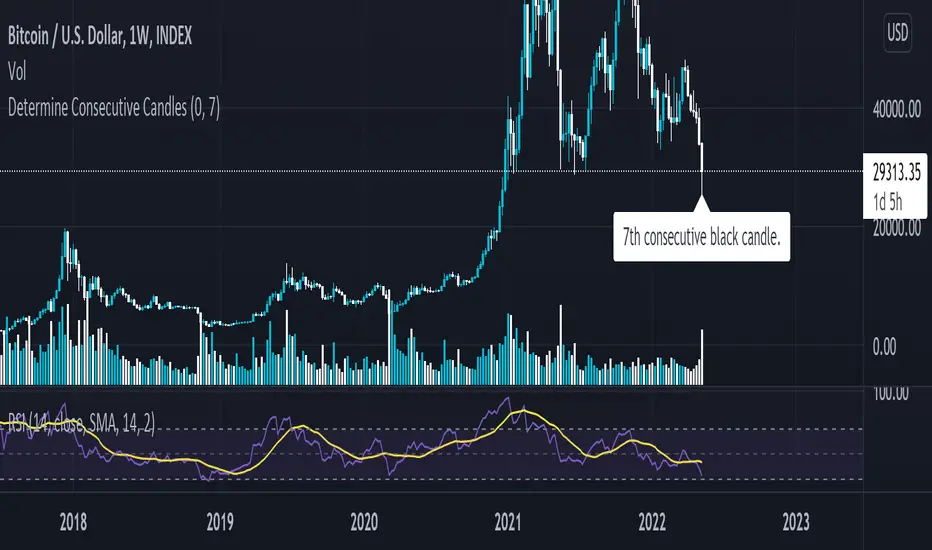
Determine Consecutive Candles█ OVERVIEW
This is a simple script that will plot labels over or under candles to show where there had been consecutive candles that closed in a similar fashion. This script was inspired by a Tweet about Bitcoin experiencing its first 7th-consecutive weekly black candle and I sought out to test that.
█ INPUTS
There are three inputs for this script.
"offset" ( integer ) - (Can be 0 or 1) Allows the user to apply this script at the currently closing candle or the most recently closed candle.
"Number of Candles" ( integer ) - (From 3 to 100*) Allows the user to select how many candles to back test for consecutive-ness.
"Black or White" ( boolean ) - Allows the user to select what kinds of candles to look for in this script. (true - Black , false - White ).
*Publishing open-sourced, this selection was arbitrary and can be modified at will.
█ USAGE
Because I had created this in a little over an hour, this is just a simple experiment that I wanted to share with others. Its applications are unknown to me, but I am interested in hearing how others may find what this script does useful.
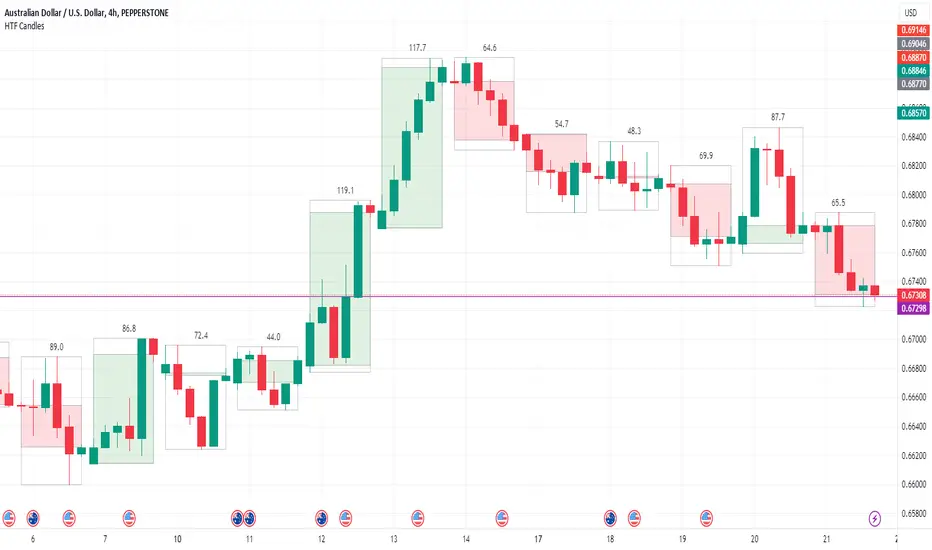
HTF Candle Boxes for LTF Charts
This indicator allows you to show an outline of a Higher Time Frame (HTF) candle on a Lower Time Frame (LTF) chart. Options include selecting the HTF interval, and an option to either show a single shaded Box for the candle (High to Low), or a shaded box for the body (Open to Close) with the High to Low shown in an unshaded box. The purpose is to easily visualise what the previous HTF candles look like as you are working on the lower charts, for example was yesterday's candle Bullish, Bearsish, indecision, a Doji etc.
Candle Colored by Volume Z-score [Morty]This indicator colors the candles according to the z-score of the trading volume. You can easily see the imbalance on the chart. You can use it at any timeframe.
In statistics, the standard score (Z-score) is the number of standard deviations by which the value of a raw score (i.e., an observed value or data point) is above or below the mean value of what is being observed or measured. Raw scores above the mean have positive standard scores, while those below the mean have negative standard scores.
This script uses trading volume as source of z-score by default.
Due to the lack of volume data for some index tickers, you can also choose candle body size as source of z-score.
features:
- custom source of z-score
- volume
- candle body size
- any of above two
- all of above two
- custom threshold of z-score
- custom color chemes
- custom chart type
- alerts
default color schemes:
- green -> excheme bullish imbalance
- blue -> large bullish imbalance
- red -> excheme bearish imbalance
- purple -> large bearish imbalance
- yellow -> low volume bars, indicates "balance", after which volatility usually increases and tends to continue the previous trend
Examples:
* Personally, I use dark theme and changed the candle colors to black/white for down/up.
Volume as Z-score source
Any as Z-score source, more imbalances are showed

topsy-turvy tousled candlesVery simple and weird type of candlesticks 😀
Wicks becomes body-ish and body becomes wickish
Cheers!

Rolling Heikin Ashi Candles█ OVERVIEW
This indicator displays a Rolling Heikin Ashi Candles for a given timeframe Multiplier. Contrary to Heikin Ashi Candles Charts, if the timeframe Multiplier is "5", this indicator plots Heikin Ashi Candles OHLC of the last 5 Candles.
█ WHAT IS THE NEED FOR IT
Let's see if we want to use a Higher timeframe OHLC Data using security function or resolution options. The indicator repaints until the higher timeframe Heikin Ashi Candles closes, leading to a repainting strategy or indicator using higher-timeframe data. So we can use Rolling Heikin Ashi Candles in these cases.
█ USES
To Pull out higher timeframe Heikin Ashi Candles OHLC Data to build a non-repainting strategy or indicator.
█ WHY I AM BUILDING THIS SIMPLE INDICATOR
There is no doubt higher timeframe analysis is a critical study to mastering the markets.
I found a necessity for an indicator that analyses multiple higher timeframes and gives us a cumulative or average trend direction. I already built the indicator; I will release it soon. The Indicator I am building is wholly based on my understanding and perspective of Market Structure. Please use this indicator idea to remove the repainting issue when you make an indicator that utilises higher timeframe data.
I am using this in my upcoming indicators. Felt to share before head.
Stay Tuned...
If you have any recommendations or alternative ideas, then please drop a comment under the script ;)

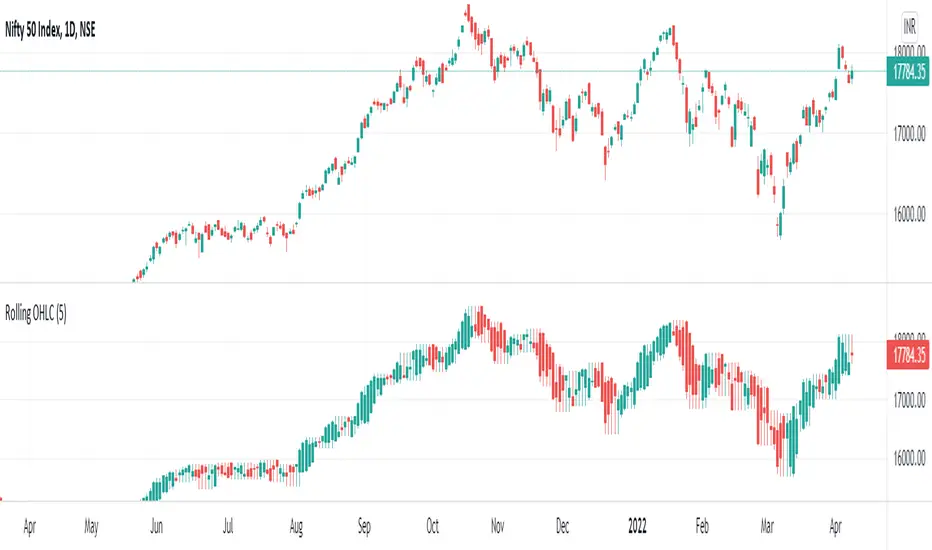
Rolling OHLC Candles█ OVERVIEW
This indicator displays a Rolling OHLC Bars for a given timeframe Multiplier. Contrary to OHLC Charts, if the timeframe Multiplier is "5", this indicator plot OHLC of the last 5 Candles.
█ WHAT IS THE NEED FOR IT
Let's see if we want to use a Higher timeframe OHLC Data using security function or resolution options. The indicator repaints until the higher timeframe OHLC Candle closes, leading to a repainting strategy or indicator using higher-timeframe data. So we can use Rolling OHLC Candles in these cases.
█ USES
To Pull out higher timeframe OHLC Data to build a non-repainting strategy or indicator.
Prominently, traders use Heikin Ashi Candles to locate trends or trading opportunities easier than traditional candlesticks. But the OHLC in those Heikin Ashi candles doesn't match with conventional candlesticks. We can use these Rolling OHLC Candles as an alternative for Heikin Ashi Candles because Here we can locate trends or trading opportunities easier than traditional candlesticks, and also close of these candles matches the close of the standard candlesticks, which can help us to take trades based on the close of the candles.
█ WHY I AM BUILDING THIS SIMPLE INDICATOR
There is no doubt higher timeframe analysis is a critical study to mastering the markets.
I found a necessity for an indicator that analyses multiple higher timeframes and gives us a cumulative or average trend direction. I already built the indicator; I will release it soon. The Indicator I am building is wholly based on my understanding and perspective of Market Structure. Please use this indicator idea to remove the repainting issue when you make an indicator that utilises higher timeframe data.
I am using this in my upcoming indicators. Felt to share before head.
Stay Tuned...
If you have any recommendations or alternative ideas, then please drop a comment under the script ;)