ZenAlgo - ChannelOverview and required chart interaction
This indicator draws a price channel and a volume profile that are both anchored to a user defined swing range. To initialize it, the user must pick two chart timestamps using the script inputs:
Start - the first anchor point (typically one extreme of the move, such as the swing low for an ascending move or the swing high for a descending move).
End - the second anchor point (the opposite extreme of that same move).
After both points are set, the script analyzes the bars between Start and End, fits a sloped channel through that range, builds a volume profile aligned with the channel, and then projects all derived levels forward along the same slope.
Inputs and what they control
Volume area and profile resolution
Width % controls how far the volume profile histogram can extend horizontally. It scales the longest profile bar relative to the Start-End range length.
Volume Area % controls how much of total volume around the profile’s highest volume region is included when computing the value area boundaries.
Style and visibility
Toggles exist for displaying the profile derived levels: LOC , VAH/VAL , pivot labels (HH, HL, LH, LL), breakout shapes, and optional ghost extensions.
Extend lines right decides whether primary lines are truly extended to the right by TradingView’s line extension, or only drawn for the Start-End segment.
Ghost Extend draws dotted, semi transparent projections for a configurable number of future bars when the main lines are not extended.
Deviation levels
Deviation Multiplier and Deviation Levels add symmetric bands above and below the LOC, spaced by a distance derived from the channel height relative to LOC. These bands are projected along the channel slope.
Slope analysis and alerts
The script can evaluate channel "strength" using either angle in degrees or a normalized percent-per-bar slope . The chosen measure is then bucketed into qualitative strength categories that are used only for labeling and alert message context.
Alerts can be enabled for confirmed breakouts and for slope sign changes (bullish to bearish, or bearish to bullish).
How the channel baseline is constructed from Start to End
Once Start is reached, the script begins accumulating bar-by-bar statistics until End is reached:
It tracks the number of bars in the selected range and accumulates an average and a linearly weighted average of closes.
At End, it converts those aggregates into a straight line defined by a start value, an end value, and a per-bar slope across the Start-End period.
Why this works (within the chosen range):
Using a fitted line over the selected segment provides a compact description of directional drift across that range. It will not capture every fluctuation, but it provides a stable reference for projecting "where the middle of the move is" as time advances.
How the channel height is determined and why the borders sit where they do
After computing the baseline slope, the script scans through the selected bars to measure how far price deviated above and below that baseline:
For each bar in the range, it computes the baseline value at that bar index and measures the distance from that baseline to the bar’s high and to the bar’s low.
It finds the maximum upward deviation and the maximum downward deviation.
The baseline is shifted so the lower channel border is aligned to the worst downward deviation, and the total channel height becomes the distance between the worst upward and worst downward deviations.
Why this works (and what it implies):
The resulting channel borders are anchored to the extremes observed in the selected range. That makes the borders a description of the range’s realized "envelope" around the fitted drift.
Because this envelope is derived from past extremes in the chosen window, it is descriptive rather than predictive. When price behavior changes, future price can exceed the historical envelope and will be treated as a breakout.
How the volume profile is built inside the channel
The script constructs a volume profile that is aligned with the sloped channel, not a flat horizontal range:
The channel’s vertical span is divided into the configured number of bins (Layers).
For each bar in the selected range, the script checks which bins are intersected by that bar’s high-low range and adds that bar’s volume to each intersected bin.
It keeps track of the bin with the highest accumulated volume. That bin defines the profile’s maximum-volume region.
Why this works (and what it measures):
Aggregating volume by where price traded within the channel helps identify the areas where the most activity occurred during the selected move.
Using bar range intersection (high-low crossing a bin) is a practical approximation for distributing volume across prices without requiring intrabar volume-at-price data. This approximation can over-attribute volume to multiple bins for wide bars, but it remains consistent across the range.
LOC, VAH, and VAL derivation
LOC (line of control)
The LOC is placed at the center of the highest-volume bin.
The LOC is then drawn as a line from Start to End, following the same slope as the channel baseline.
Interpretation:
LOC represents the most frequently traded zone within the selected channel range, expressed as a sloped level that moves forward with the channel’s drift.
VAH and VAL
Total volume across all bins is computed.
Starting from the highest-volume bin, the script expands upward and downward, accumulating volume until the accumulated fraction exceeds the configured Volume Area %.
The highest included bin boundary becomes VAH, and the lowest included bin boundary becomes VAL.
VAH and VAL are drawn as sloped lines parallel to the channel drift.
Interpretation:
VAH and VAL bound the portion of the channel where the majority of the range’s volume accumulated, based on the chosen percentage.
Relative position of price to these levels can be used as context for whether current trading is occurring in historically high-activity or low-activity parts of the selected move.
Deviation bands around LOC
After LOC is known, the script creates additional parallel bands:
It measures the vertical distance from LOC to the top channel border.
Using that as a base offset, it draws symmetric lines above and below LOC for each deviation level, scaled by the deviation multiplier.
These lines are projected with the same slope as the channel.
Interpretation:
These bands provide repeated "distance markers" above and below LOC in units derived from the selected range’s internal structure.
They are best treated as contextual zones rather than precise targets, because spacing is tied to the chosen Start-End window and its extremes.
Optional projections: Extend right and Ghost Extend
Two projection mechanisms exist:
If Extend lines right is enabled, the main channel borders, LOC, and optionally VAH/VAL and deviation lines are extended using TradingView line extension.
If Extend right is disabled but Ghost Extend is enabled, dotted projections are drawn for a fixed number of future bars from End, including channel borders, LOC, VAH/VAL, and deviation lines.
Interpretation:
Both options visualize where the same fitted structure would land in future bars if slope remains unchanged. They do not update slope unless Start-End selection is changed.
Pivot labels: HH, HL, LH, LL
The script optionally labels local swing points using pivot detection:
A pivot high is confirmed when a high is greater than neighboring highs by the configured left and right bar counts.
A pivot low is confirmed similarly for lows.
New pivot highs are labeled as HH or LH relative to the prior pivot high, and pivot lows as HL or LL relative to the prior pivot low.
The logic includes a reset behavior after a new LL or HH to reduce chaining ambiguity across regime shifts.
Interpretation:
These labels provide local structure context that can be compared to the channel’s direction and to whether price is interacting with channel borders or profile levels.
Breakout detection on channel borders
Once End is set, the channel is considered active and the script evaluates each new bar against the channel borders at that bar index:
It computes the current top and bottom border values for the present bar by advancing from the Start baseline with the fitted slope and channel height.
A potential breakout is marked on the first bar that crosses above the top border (or below the bottom border), using a close-based crossing test against the prior bar’s border value.
After a potential breakout, the script waits for confirmation:
For an upside breakout, confirmation occurs only if price remains above the top border and then closes higher than the potential breakout close.
For a downside breakout, confirmation occurs only if price remains below the bottom border and then closes lower than the potential breakout close.
If price re-enters back inside the border before confirmation, the pending breakout state is canceled.
Interpretation:
The two-step logic distinguishes an initial border cross from follow-through. It aims to reduce cases where a single bar spikes outside the channel and immediately returns.
The confirmation test is still close-based and does not consider intrabar excursions beyond the channel, so it is sensitive to candle closes rather than wicks.
Alerts included by the script
Confirmed breakout up or down can trigger alerts and corresponding alertconditions, aligned to the confirmed state described above.
Slope sign change alert triggers when the computed slope (based on the last selected Start-End range) flips sign compared to the previously computed slope. This is a re-selection or re-computation event rather than a continuous recalculation.
How to interpret the plotted elements together
A practical way to read the indicator is to separate it into three layers of information:
Channel structure
Top and bottom borders describe the fitted envelope of the selected range.
The slope indicates the drift direction implied by that selection.
Activity structure inside the channel
LOC is the highest-activity region within the selected range, projected along drift.
VAH and VAL bound the configured fraction of volume around the activity center.
Deviation bands give repeated distance zones around LOC.
Event markers
Pivot labels show local swing structure.
Breakout markers highlight border crosses and confirmed follow-through.
How to best use this indicator
Selecting Start and End effectively
Choose Start and End that represent a coherent swing segment where you want the channel and profile to describe that move.
Avoid mixing multiple regimes (for example, including both a strong trend and a later choppy distribution) unless that is explicitly what you want the profile to summarize.
If the selected window is extremely long, the script limits processing to recent data due to a hard cap (it warns when the range exceeds 10,000 bars and uses only the most recent subset).
Using LOC, VAH, and VAL for context
Treat LOC as the "most traded" zone of the selected move, projected forward.
Treat VAH and VAL as boundaries of the selected move’s high-activity region. Price acceptance inside VAH-VAL and excursions outside that band can be interpreted as trading in higher-activity versus lower-activity zones of the selected move.
Using breakouts
A potential breakout is an early warning that the historical envelope is being exceeded on a closing basis.
A confirmed breakout indicates follow-through beyond the initial breakout close while remaining outside the channel border.
Combining with pivot labels
Compare HH/HL sequences to the channel slope to understand whether local structure aligns with the selected drift.
Pivot labels can also help you decide when the current Start-End selection is no longer representative and should be refreshed.
Added value over other free indicators
The volume profile is constructed along a sloped channel , not a flat horizontal range, so the distribution is expressed in the same coordinate frame as the selected drift.
LOC, VAH, and VAL are therefore projected parallel to the channel , providing moving reference levels tied to the chosen swing segment rather than static horizontal bands.
Breakout logic uses a two-step potential and confirmation mechanism, which separates first border crossings from subsequent follow-through conditions.
Disclaimers and where the indicator can fall short
Results depend heavily on Start and End selection. Different anchor points can produce materially different slope, channel height, and profile levels.
The volume profile uses candle range intersection to distribute volume across bins. Large range candles can contribute volume to many bins, which may broaden the apparent distribution.
The channel borders are based on extremes within the selected range. If market volatility expands, price can exceed the envelope frequently and produce repeated breakout states.
Breakout detection is close-based. Wick-only excursions beyond borders are not treated as breakouts unless the close crosses the border.
Very large ranges may be truncated for processing due to the script’s internal bar limit, which changes what data is actually summarized.
Channelbreak

Auto Channel [SciQua]Auto Channel
Purpose
Auto Channel finds the single best parallel price channel from recent price action and keeps it updated in real time. It uses ZigZag pivots to build candidate channels, scores each candidate for quality, then plots the winner. When price closes outside the channel, the script flags a breakout and can fire alerts.
How it works
1. ZigZag pivots
The script uses TradingView’s TradingView/ZigZag/7 library to generate a stream of swing highs and lows based on a percentage reversal threshold and a leg depth. These pivots are the only points the channel logic evaluates, which keeps the search fast and focused on structure rather than noise.
2. Channel candidates
From the most recent pivots, the script forms all combinations of two swing highs and two swing lows.
It computes a slope for the high line and a slope for the low line and requires that they be nearly parallel within a user-defined tolerance.
3. Quality scoring and selection
For every valid candidate, the script checks the recent pivot segments against the trial channel and computes:
Inside ratio: fraction of tested pivots that sit fully inside the channel after applying the tolerance buffer.
Violation sum: total magnitude of the breaches for any pivots outside the channel.
Current width: distance between upper and lower lines at the current bar.
The “best” channel is chosen by:
1. highest inside ratio
2. then widest current width
3. then smallest violation sum
4. Plot and projection
The upper and lower lines are anchored to the chosen pivot pairs and extend to the left. The script also projects each line to the current bar to compute the live upper and lower channel prices. Those levels drive the breakout checks and alerts.
5. Breakouts and alerts
A breakout is detected when the bar closes above the projected upper line or closes below the projected lower line, after applying the tolerance buffer. Triangle markers highlight fresh breakouts, and you can enable alert conditions to automate notification or strategy handoff.
Inputs:
ZigZag
Price deviation for reversals (%)
Default 0.2. Larger values produce fewer, larger swings. Smaller values produce more, smaller swings.
Pivot legs
Default 2. Controls the lookback depth ZigZag uses to confirm pivots.
ZigZag Color
Visual only.
Tip: If you are not seeing a stable channel, increase the ZigZag percentage to reduce minor swings.
Channel search
Number of recent pivots to consider
Default 12. Higher values search more history and try more channel combinations. Lower values make the search faster and more reactive.
Max slope difference for parallel
Default 0.0005. Maximum allowed difference between the upper and lower line slopes. Smaller values enforce stricter parallelism.
Max price tolerance outside channel
Default 0.0. A buffer added to the channel boundaries during validation and breakout checks. Use this to ignore tiny wicks that poke the lines.
Minimum inside to outside pivots ratio for valid channel (0.00–1.00)
Default 1.00. Require that at least this fraction of checked pivots lie inside the channel. For a more permissive fit, try 0.60 to 0.85.
Styling
Upper Line Color
Lower Line Color
Breakout Above Color
Breakout Below Color
Plots and visuals
Upper channel line
Lower channel line
Triangle markers on the bar that first confirms a close outside the channel, above or below.
Lines extend left from their pivot anchors. Projection to the current bar is used internally to test for breakouts and to set alerts.
Alerts
The script defines two alert conditions:
Close Above Channel
Triggers when the bar closes above the projected upper line plus tolerance.
Close Below Channel
Triggers when the bar closes below the projected lower line minus tolerance.
Practical usage
Trend channels
In a steady trend, a high inside ratio with a moderate width often highlights the dominant channel. Consider trend entries near the lower line in an uptrend or near the upper line in a downtrend, with exits or stops beyond the opposite boundary.
Breakout trades
Combine the channel breakout alert with volume or a separate momentum filter. The tolerance input helps avoid false triggers from small wicks.
Tuning for timeframe and symbol
• Faster markets or lower timeframes usually benefit from a larger ZigZag percentage and a smaller pivot count.
• Slower markets or higher timeframes can use more pivots and a tighter slope difference to enforce cleaner geometry.
Notes and limitations
Channels are derived from ZigZag pivots. If your ZigZag settings change, the detected channel will also change.
The script plots only the single best channel at any time to keep the chart clean.
Breakout markers appear on confirmed bars. For historical bars, markers appear only where a breakout would have been confirmed at that time.
Lines extend left from their anchors. The script projects the lines internally to the current bar for checks and alerts.
License and attribution
License
Creative Commons Attribution-NonCommercial 4.0 International (CC BY-NC 4.0).
Open source for educational and personal use only. Commercial use requires written permission.
Attribution
© 2025 SciQua — Joshua Danford
Libraries
Uses TradingView/ZigZag/7.
Changelog
v1.0
Initial release. Automatic parallel channel detection from ZigZag pivots, quality scoring, live plotting, and close-based breakout alerts.
FAQ
Why do I not see any channel sometimes?
There may not be a valid pair of highs and lows that pass the slope, inside ratio, and tolerance checks. Loosen the constraints by increasing Max slope difference, lowering Minimum inside ratio, or increasing the ZigZag percentage.
The channel looks too narrow or too wide?
Adjust Number of recent pivots and Minimum inside ratio. A higher inside ratio tends to favor cleaner, sometimes wider channels. A lower ratio may admit narrower, more reactive channels.
How can I reduce false breakout alerts?
Increase Max price tolerance outside channel to ignore small wicks. Add a volume or momentum confirmation in your personal alert workflow.
Thank you for using Auto Channel . Feedback and improvements are welcome.

Smart Money Breakout Channels [AlgoAlpha]🟠 OVERVIEW
This script draws breakout detection zones called “Smart Money Breakout Channels” based on volatility-normalized price movement and visualizes them as dynamic boxes with volume overlays. It identifies temporary accumulation or distribution ranges using a custom normalized volatility metric and tracks when price breaks out of those zones—either upward or downward. Each channel represents a structured range where smart money may be active, helping traders anticipate key breakouts with added context from volume delta, up/down volume, and a visual gradient gauge for momentum bias.
🟠 CONCEPTS
The script calculates normalized price volatility by measuring the standard deviation of price mapped to a scale using the highest and lowest prices over a set lookback period. When normalized volatility reaches a local low and flips upward, a boxed channel is drawn between the highest and lowest prices in that zone. These boxes persist until price breaks out, either with a strong candle close (configurable) or by touching the boundary. Volume analysis enhances interpretation by rendering delta bars inside the box, showing volume distribution during the channel. Additionally, a real-time visual “gauge” shows where volume delta sits within the channel range, helping users spot pressure imbalances.
🟠 FEATURES
Automatic detection and drawing of breakout channels based on volatility-normalized price pivots.
Optional nested channels to allow multiple simultaneous zones or a clean single-zone view.
Gradient-filled volume gauge with dynamic pointer to show current delta pressure within the box.
Three volume visualization modes: raw volume, comparative up/down volume, and delta.
Alerts for new channel creation and confirmed bullish or bearish breakouts.
🟠 USAGE
Apply the indicator to any chart. Wait for a new breakout box to form—this occurs when volatility behavior shifts and a stable range emerges. Once a box appears, monitor price relative to its boundaries. A breakout above suggests bullish continuation, below suggests bearish continuation; signals are stronger when “Strong Closes Only” is enabled.
Watch the internal volume candles to understand where buy/sell pressure is concentrated during the box. Use the gauge on the right to interpret whether net pressure is building upward or downward before breakout to anticipate the direction.
Use alerts to catch breakout events without needing to monitor the chart constantly 🚨.

Auto Support Resistance Channels [TradingFinder] Top/Down Signal🔵 Introduction
In technical analysis, a price channel is one of the most widely used tools for identifying and tracking price trends. A price channel consists of two parallel trendlines, typically drawn from swing highs (resistance) and swing lows (support). These lines define dynamic support and resistance zones and provide a clear framework for interpreting price fluctuations.
Drawing a channel on a price chart allows the analyst to more precisely identify entry points, exit levels, take-profit zones, and stop-loss areas based on how the price behaves within the boundaries of the channel.
Price channels in technical analysis are generally categorized into three types: upward channels with a positive slope, downward channels with a negative slope, and horizontal (range-bound) channels with near-zero slope. Each type offers unique insights into market behavior depending on the price structure and prevailing trend.
Structurally, channels can be formed using either minor or major pivot points. A major channel typically reflects a stronger, more reliable structure that appears on higher timeframes, whereas a minor channel often captures short-term fluctuations or corrective movements within a larger trend.
For instance, a major downward channel may indicate sustained selling pressure across the market, while a minor upward channel could represent a temporary pullback within a broader bearish trend.
The validity of a price channel depends on several factors, including the number of price touches on the channel lines, the symmetry and parallelism of the trendlines, the duration of price movement within the channel, and price behavior around the median line.
When a price channel is broken, it is generally expected that the price will move in the breakout direction by at least the width of the channel. This makes price channels especially useful in breakout analysis.
In the following sections, we will explore the different types of price channels, how to draw them accurately, the structural differences between minor and major channels, and key trade interpretations when price interacts with channel boundaries.
Up Channel :
Down Channel :
🔵 How to Use
A price channel is a practical tool in technical analysis for identifying areas of support, resistance, trend direction, and potential breakout zones. The structure consists of two parallel trendlines within which price fluctuates.
Traders use the relative position of price within the channel to make informed trading decisions. The two primary strategies include range-based trades (buying low, selling high) and breakout trades (entering when price exits the channel).
🟣 Up Channel
In an upward channel, price moves within a positively sloped range. The lower trendline acts as dynamic support, while the upper trendline serves as dynamic resistance. A common strategy involves buying near the lower support and taking profit or selling near the upper resistance.
If price breaks below the lower trendline with strong volume or a decisive candle, it can signal a potential trend reversal. Channels constructed from major pivots generally reflect dominant uptrends, while those based on minor pivots are often corrective structures within a broader bearish movement.
🟣 Down Channel
In a downward channel, price moves between two negatively sloped lines. The upper trendline functions as resistance, and the lower trendline as support. Ideal entry for short trades occurs near the upper boundary, especially when confirmed by bearish price action or a resistance level.
Exit targets are typically located near the lower support. If the upper boundary is broken to the upside, it may be an early sign of a bullish trend reversal. Like upward channels, a major down channel represents broader selling pressure, while a minor one may indicate a brief retracement in a bullish move.
🟣 Range Channel
A horizontal or range-bound channel is characterized by price oscillating between two nearly flat lines. This type of channel typically appears during sideways markets or periods of consolidation.
Traders often buy near the lower boundary and sell near the upper boundary to take advantage of contained volatility. However, fake breakouts are more frequent in range-bound structures, so it is important to wait for confirmation through candlestick signals and volume. A confirmed breakout beyond the channel boundaries can justify entering a trade in the direction of the breakout.
🔵 Settings
Pivot Period :This parameter defines how sensitive the channel detection is. A higher value causes the algorithm to identify major pivot points, resulting in broader and longer-term channels. Lower values focus on minor pivots and create tighter, short-term channels.
🔔 Alerts
Alert Configuration :
Enable or disable the full alert system
Set a custom alert name
Choose the alert frequency: every time, once per bar, or on bar close
Define the time zone for alert timestamps (e.g., UTC)
Channel Alert Types :
Each channel type (Major/Minor, Internal/External, Up/Down) supports two alert types :
Break Alert : Triggered when price breaks above or below the channel boundaries
React Alert : Triggered when price touches and reacts (bounces) off the channel boundary
🎨 Display Settings
For each of the eight channel types, you can customize:
Visibility : show or hide the channel
Auto-delete previous channels when new ones are drawn
Style : line color, thickness, type (solid, dashed, dotted), extension (right only, both sides)
🔵 Conclusion
The price channel is a foundational structure in technical analysis that enables traders to analyze price movement, identify dynamic support and resistance zones, and locate potential entry and exit points with greater precision.
When constructed properly using minor or major pivots, a price channel offers a consistent and intuitive framework for interpreting market behavior—often simpler and more visually clear than many other technical tools.
Understanding the differences between upward, downward, and range-bound channels—as well as recognizing the distinctions between minor and major structures—is critical for selecting the right trading strategy. Upward channels tend to generate buying opportunities, downward channels prioritize short setups, and horizontal channels provide setups for both mean-reversion and breakout trades.
Ultimately, the reliability of a price channel depends on various factors such as the number of touchpoints, the duration of the channel, the parallelism of the lines, and how the price reacts to the median line.
By taking these factors into account, an experienced analyst can effectively use price channels as a powerful tool for trend forecasting and precise trade execution. Although conceptually simple, successful application of price channels requires practice, pattern recognition, and the ability to filter out market noise.

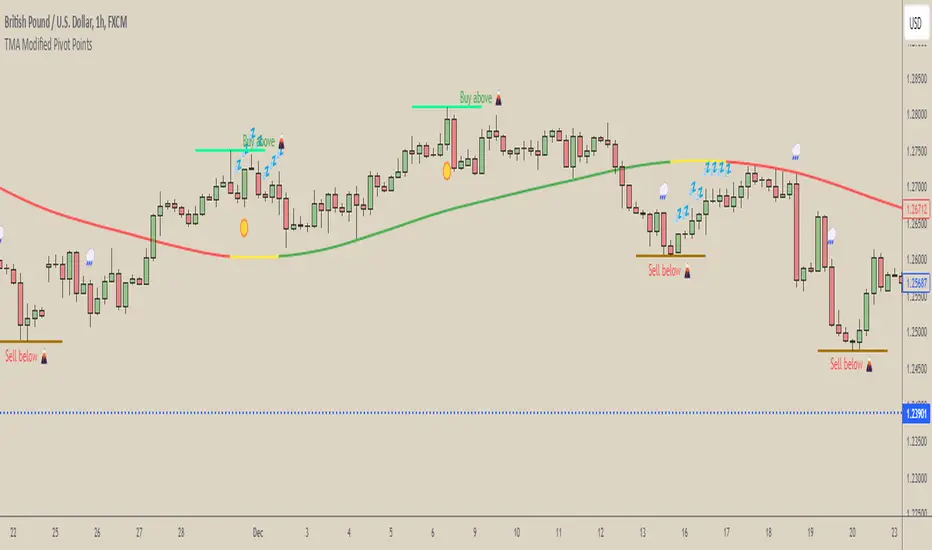
[COG] WeatherForecaster🌤️ Just like a weather forecast that adjusts as new data emerges, this TMA Pivot Points Forecaster adapts to evolving market conditions!
Description:
This indicator combines the power of a Triple Moving Average (TMA) with pivot point analysis to identify potential market turning points and trend directions. Like a meteorologist using various atmospheric data to predict weather patterns, this tool analyzes price action through multiple lenses to forecast potential market movements.
Key Features:
- Dynamic TMA Line: Acts as our "atmospheric pressure system," showing the underlying market direction
- Adaptive Pivot Points: Like weather stations, these pivots identify key market levels where the "climate" might change
- Smart Entry Signals: ☀️ and 🌧️ icons appear when conditions align for potential trades
- Timeframe-Adaptive: Automatically adjusts sensitivity across different timeframes
- Customizable Visuals: Adjust colors and styles to match your trading environment
Settings Include:
✓ TMA Length and Slope Sensitivity
✓ Pivot Point Parameters
✓ Visual Customization Options
✓ Toggle Entry Signals
✓ Toggle Pivot Lines
Note: Like weather forecasts that update with new data, this indicator recalculates as market conditions evolve. Past signals may adjust as more price action develops. Always use proper risk management and combine with other analysis tools.
Usage Guide:
The indicator works best when used as part of a complete trading system. Here's how to interpret the signals:
📈 Bullish Conditions:
- TMA Line turns green: Indicates upward momentum
- "Buy above 🌋" level appears: Potential resistance turned support level
- ☀️ Signal: Indicates favorable buying conditions
📉 Bearish Conditions:
- TMA Line turns red: Indicates downward momentum
- "Sell below 🌋" level appears: Potential support turned resistance level
- 🌧️ Signal: Indicates favorable selling conditions
⏺️ Ranging Conditions:
- TMA Line turns yellow: Market in consolidation
- 💤 Signal: Suggests waiting for clearer direction
Best Practices:
1. Higher timeframes (4H, Daily) tend to produce more reliable signals
2. Use the pivot lines as potential entry/exit reference points
3. Adjust the TMA length based on your trading style:
• Shorter lengths (20-30) for more active trading
• Longer lengths (50-60) for trend following
Settings Explained:
TMA Settings:
- TMA Length: Determines the smoothing period (default: 30)
- Slope Threshold: Controls trend sensitivity (default: 0.015)
Pivot Settings:
- Left/Right Bars: Controls pivot point calculation
- Line Length: Adjusts the visual length of pivot lines
- Line Style & Colors: Customize the visual appearance
Disclaimer:
Past performance does not guarantee future results. This indicator, like any technical tool, provides possibilities rather than certainties. Please test thoroughly on your preferred timeframes and markets before using with real capital.
RSI Volatility Suppression Zones [BigBeluga]RSI Volatility Suppression Zones is an advanced indicator that identifies periods of suppressed RSI volatility and visualizes these suppression zones on the main chart. It also highlights breakout dynamics, giving traders actionable insights into potential market momentum.
🔵 Key Features:
Detection of Suppression Zones:
Identifies periods where RSI volatility is suppressed and marks these zones on the main price chart.
Breakout Visualization:
When the price breaks above the suppression zone, the box turns aqua, and an upward label is drawn to indicate a bullish breakout.
If the price breaks below the zone, the box turns purple, and a downward label is drawn for a bearish breakout.
Breakouts accompanied by a "+" label represent strong moves caused by short-lived, tight zones, signaling significant momentum.
Wave Labels for Consolidation:
If the suppression zone remains unbroken, a "wave" label is displayed within the gray box, signifying continued price stability within the range.
Gradient Intensity Below RSI:
A gradient strip below the RSI line increases in intensity based on the duration of the suppressed RSI volatility period.
This visual aid helps traders gauge how extended the low volatility phase is.
🔵 Usage:
Identify Breakouts: Use color-coded boxes and labels to detect breakouts and their direction, confirming potential trend continuation or reversals.
Evaluate Market Momentum: Leverage "+" labels for strong breakout signals caused by short suppression phases, indicating significant market moves.
Monitor Price Consolidation: Observe gray boxes and wave labels to understand ongoing consolidation phases.
Analyze RSI Behavior: Utilize the gradient strip to measure the longevity of suppressed volatility phases and anticipate breakout potential.
RSI Volatility Suppression Zones provides a powerful visual representation of RSI volatility suppression, breakout signals, and price consolidation, making it a must-have tool for traders seeking to anticipate market movements effectively.

The Bar Counter Trend Reversal Strategy [TradeDots]Overview
The Bar Counter Trend Reversal Strategy is designed to identify potential counter-trend reversal points in the market after a series of consecutive rising or falling bars.
By analyzing price movements in conjunction with optional volume confirmation and channel bands (Bollinger Bands or Keltner Channels), this strategy aims to detect overbought or oversold conditions where a trend reversal may occur.
🔹How it Works
Consecutive Price Movements
Rising Bars: The strategy detects when there are a specified number of consecutive rising bars (No. of Rises).
Falling Bars: Similarly, it identifies a specified number of consecutive falling bars (No. of Falls).
Volume Confirmation (Optional)
When enabled, the strategy checks for increasing volume during the consecutive price movements, adding an extra layer of confirmation to the potential reversal signal.
Channel Confirmation (Optional)
Channel Type: Choose between Bollinger Bands ("BB") or Keltner Channels ("KC").
Channel Interaction: The strategy checks if the price interacts with the upper or lower channel lines: For short signals, it looks for price moving above the upper channel line. For long signals, it looks for price moving below the lower channel line.
Customization:
No. of Rises/Falls: Set the number of consecutive bars required to trigger a signal.
Volume Confirmation: Enable or disable volume as a confirmation factor.
Channel Confirmation: Enable or disable channel bands as a confirmation factor.
Channel Settings: Adjust the length and multiplier for the Bollinger Bands or Keltner Channels.
Visual Indicators:
Entry Signals: Triangles plotted on the chart indicate potential entry points:
Green upward triangle for long entries.
Red downward triangle for short entries.
Channel Bands: The upper and lower bands are plotted for visual reference.
Strategy Parameters:
Initial Capital: $10,000.
Position Sizing: 80% of equity per trade.
Commission: 0.01% per trade to simulate realistic trading costs.
🔹Usage
Set up the number of Rises/Falls and choose whether if you want to use channel indicators and volume as the confirmation.
Monitor the chart for triangles indicating potential entry points.
Consider the context of the overall market trend and other technical factors.
Backtesting and Optimization:
Use TradingView's Strategy Tester to evaluate performance.
Adjust parameters to optimize results for different market conditions.
🔹 Considerations and Recommendations
Risk Management:
The strategy does not include built-in stop-loss or take-profit levels. It's recommended to implement your own risk management techniques.
Market Conditions:
Performance may vary in different market environments. Testing and adjustments are advised when applying the strategy to new instruments or timeframes.
No Guarantee of Future Results:
Past performance is not indicative of future results. Always perform due diligence and consider the risks involved in trading.

Market Core [BigBeluga]MARKET CORE Toolkit
The BigBeluga Market Core Toolkit is a comprehensive suite of advanced trading indicators designed to provide traders with a holistic view of market dynamics, structure, and potential opportunities.
In an ever-evolving market, relying on a single indicator can leave traders vulnerable to gaps in their analysis. The BigBeluga Market Core Toolkit addresses this challenge by integrating a range of complementary indicators that work synergistically to reveal the full picture. From detecting key support and resistance levels to identifying market structure shifts, volume imbalances, inefficiencies or analysis of money flow, this toolkit covers every aspect of market behavior.
⬤ Order Blocks
BigBeluga Order Blocks revolutionize the way traders visualize potential areas of significant market activity. Unlike traditional order block indicators that often result in cluttered, noisy charts, these Order Blocks are designed for clarity and effectiveness. They simulate and predict where large areas of market orders may rest by analyzing volume and volatility, providing excellent support or resistance areas.
The blocks offer cleaner chart presentation with reasonable distribution, volume ratio visualization within each block, and categorization into Strong, High and Balanced blocks.
Additionally, a third line has been introduced to rank order blocks by volume using a modified percent rank method for more precise ranking.
This ranking system uses percentile ranks, a concept commonly used in standardized tests. In the context of order blocks, the percentile rank of a particular order block's volume is interpreted as the percentage of the order blocks strength. This method provides a more nuanced and statistically robust way of comparing and prioritizing order blocks.
Key features:
Cleaner chart presentation with reasonable distribution of blocks
Volume ratio visualization within each block (bullish vs bearish)
Categorization into High and Balanced blocks for easy identification of significant levels
Relative volume percentage and volume delta display
Advanced ranking system using modified percent rank method for volume comparison
These Order Blocks help traders:
Forecast excellent support or resistance areas
Gain insight into the balance of the market at specific levels
Identify significant market levels at a glance
Visualize market imbalances through volume delta
Prioritize order blocks based on their relative volume importance
Make more informed decisions about potential entry and exit points
⬤ Beluga Profile
The Beluga Profile is a revolutionary market analysis tool that transforms complex market data into a clear, intuitive visual narrative. At its core, it combines a Dual-Profile Analysis, merging Delta Volume Profile with Money Flow Profile to give traders a comprehensive view of market dynamics.
The percentage scale on the left side aren't just numbers; they represent the Levels Strength Percentage, a crucial ranking system that immediately draws your attention to the most significant price zones. Complementing this, a heat map overlay brings these strength levels to life, offering an instant, color-coded representation of where the market's most influential areas lie.
To the right, a detailed breakdown of volume and money flow for each level provides the hard data behind the visual cues. This granular information allows you to dive deep into the market's structure, understanding not just where the significant levels are, but why they matter.
Below the main chart, the Delta Volume Bar serves as a foundation, showing the average delta of the volume profile. This bar is more than just a measure of volume – it's a window into the underlying forces driving price movement. Just above this bar, a macro trend indicator in the form of an arrow offers a quick, clear signal of the overall market direction based on these delta volume calculations.
But the Beluga Profile doesn't just show you what's happening – it helps you understand the 'why' and 'how'. The Adaptive Points of Interest feature allows you to customize your analysis, focusing on the areas that matter most to your trading strategy. You can select from various options including Money Flow, Delta+, Delta-, Volume+, and Level % (Highest), tailoring the display to your specific analytical needs. This flexibility ensures you can focus on the most relevant data for your trading style. Real-time Active Price Tracking ensures you're always in sync with the latest market movements.
All of these elements work in concert, creating a symphony of market information. They empower you to:
Spot key price levels with uncanny precision
Foresee potential market turns before they happen
Grasp the quality and strength of price moves
Adjust your strategy on the fly as market conditions shift
Develop a holistic understanding of market structure and participant behavior
Make informed decisions backed by a clear view of the overall market trend
In essence, the Beluga Profile isn't just a tool – it's your market storyteller, translating the complex language of price, volume, and money flow into a narrative that you can understand and act upon with confidence.
⬤ Smart Money Concepts (SMC)
The Smart Money Concepts component of the toolkit focuses on automatically detecting key market structures crucial in technical analysis. It identifies and visualizes Break of Structure (BOS) and Change of Character (CHOCH) patterns, helping traders spot potential trend reversals and significant market movements. This includes BOS identification when price breaks previous support or resistance and CHOCH detection for potential trend reversals, with automatic detection of both bullish and bearish patterns.
The latest enhancement to this feature adds a new layer of analysis through Delta Volume Calculation. When a BOS or CHOCH is detected, the toolkit calculates the delta volume within the range from the high or low point to the break point. This analysis considers all the candles in this range and determines whether the volume is predominantly bullish, bearish, or neutral.
Bullish Volume: If the delta volume is bullish, a green diamond is plotted at the high or low point, indicating potential upward momentum.
Bearish Volume: If the delta volume is bearish, a red diamond is plotted, suggesting downward pressure.
Neutral Volume: When the volume is neutral, a yellow diamond is displayed, indicating a balance in buying and selling forces.
This visual representation of volume dynamics provides an additional layer of insight, helping traders assess the strength and direction of price movements following a structure break. You can see an example of this on the attached image, where the diamonds clearly indicate the type of volume driving the breakout.
The toolkit also incorporates Fair Value Gap (FVG) Detection. Fair Value Gaps represent inefficiencies in the market, where there is an imbalance between buy and sell orders. These gaps often act as magnets for price, potentially leading to future reversals or continuations when filled. The toolkit identifies and highlights these gaps, allowing traders to recognize areas where the market may seek to rebalance.
Additionally, Double Top and Bottom Pattern Detection has been integrated, identifying potential reversal points at these classic price formations. Double tops signal potential bearish reversals after a price peak, while double bottoms suggest potential bullish reversals after a price dip. These patterns can be crucial indicators for traders looking to capitalize on upcoming trend changes.
Smart Money Concepts help traders:
Identify potential trend reversals early with a clearer view of market structure.
Recognize significant changes in market structure and volume participation.
Differentiate between temporary pullbacks and genuine trend changes using volume insights (color coded diamonds).
Shows Fair Value gaps which helps to identify price momentum and inefficiencies in the market.
This enhancement ensures that traders can not only see structural changes but also understand the volume behind those moves, leading to more informed and confident trading decisions.
⬤ Support and Resistance Levels
This powerful tool is designed to identify key price levels in the market, providing traders with a clear visual representation of potential support and resistance areas. It goes beyond simple level identification by incorporating a sophisticated ranking system and adjustable sensitivity.
The grading system of levels is a unique feature that evaluates the significance of high and low points in the price action. It takes into consideration how many times the price has touched or interacted with specific levels. This means that levels which have been tested multiple times are given higher importance in the ranking. For example, a price level that has acted as support or resistance three times will be ranked higher than a level that has only been touched once.
By leveraging this grading system, traders can focus on the most significant levels that have repeatedly influenced price action, potentially improving the accuracy of their trading decisions and risk management strategies.
This Support and Resistance Levels indicator helps traders:
Identify and prioritize potential reversal points based on their historical significance and frequency of price interaction
Set more accurate entry and exit points aligned with key market levels, focusing on those with higher ranking
Understand the hierarchical structure of market support and resistance, distinguishing between major and minor levels
Plan stop-loss and take-profit levels with greater precision, using the ranking to gauge the strength of each level
Adapt their analysis to varying market strengths and volatilities, with the ability to filter out less significant levels
Recognize recurring price patterns and potential breakout levels based on the ranked historical price interactions
⬤ How to Use the Toolkit
Each of these indicators, while powerful on its own, works synergistically with the others to provide a more complete picture of the market.
The strength of this toolkit lies in its ability to analyze the market from multiple perspectives
Combining these advanced trading indicators into a cohesive toolkit empowers traders with a comprehensive, multi-dimensional view of the market that no single indicator could provide on its own. The market's complexity demands an approach that goes beyond relying on just one aspect, such as price action, volume, or order flow. Integrating these diverse indicators creates a robust analytical framework that captures the market from multiple angles, leading to more accurate insights and better-informed decision-making.
Analyze Order Blocks to identify potential support/resistance and volume imbalances
Use Beluga Profile for comprehensive market structure and trend analysis
Monitor SMC indicators for potential trend reversals and breakouts
Utilize Support and Resistance Levels for precise entry/exit points and risk management
Combine insights from all tools for a multi-dimensional view of market conditions
⬤ Customization
Each component of the toolkit offers various customization options to suit different trading styles and preferences. These inputs allow traders to adjust settings to better fit their analysis needs and strategies:
Order Blocks
- Order Blocks : Set the amount of Order Blocks on the chart.
- Color Selection : Choose the color for highlighting the order blocks on your chart.
Market Structure
- Sensitivity : Adjust the sensitivity for detecting market structure breaks. Higher sensitivity will detect more granular breaks, while lower sensitivity focuses on more significant movements.
- Data : Enable or disable the display of market structure data.
- Zigzag Option : Toggle Zigzag displays from highs and lows.
S/R (Support and Resistance)
- Sensitivity : Control how sensitive the tool is in detecting support and resistance levels. Lower sensitivity will highlight fewer but stronger levels, while higher sensitivity may reveal more levels.
- Width % : Adjust the width of the support and resistance zones to visually emphasize their importance.
- Color Selection : Choose colors for both support and resistance levels for better clarity.
FVG (Fair Value Gap)
- Max : Set the maximum number of fair value gaps to display. Higher values will show more gaps, while lower values will focus on the most prominent ones.
- Color Selection : Customize the color for the fair value gap areas.
Volume Profile
- Length : Define the look-back period for the volume profile analysis. A longer length considers more historical data, while a shorter length focuses on recent data.
- Levs : Choose the number of volume levels to display, allowing for more or fewer volume bars within the profile.
- BG : Enable or disable background shading for the volume profile.
- HeatMap : Activate or deactivate the heat map overlay for volume intensity visualization.
- POC (Point of Control) : Toggle the Point of Control display and choose between different metrics, such as volume+, money flow, Delta+ and Delta-, Level % (Highesr), to base the POC on.
- Color Selection : Customize the color for the Point of Control line.
These customization options provide traders with the flexibility to tailor the toolkit to their specific trading strategies, enhancing their ability to identify key market signals with precision.
Each component of the toolkit offers various customization options to suit different trading styles and preferences.
The BigBeluga Market Core Toolkit synthesizes complex market data into clear, actionable formats, providing traders with professional-level insights. It's a comprehensive market analysis system that can give traders a significant edge in understanding market behavior and identifying high-probability trade setups. While highly effective, it's recommended to use this toolkit in conjunction with fundamental analysis and sound risk management practices for optimal trading results.
Script payant

Pivot Channel Breaks [BigBeluga]Pivot Channel Break
The Pivot Channel Break indicator identifies key pivot points and creates a dynamic channel based on these pivots. It detects breakouts from this channel, providing potential entry and exit signals for traders.
🔵 How to Use
Channel Identification:
- Upper and lower channel lines drawn based on pivot highs and lows
- Channel width dynamically adjusted using ATR-like calculation
Breakout Signals:
- Upward breakout: Price closes above upper channel line
- Downward breakout: Price closes below lower channel line
- Signals shown as X marks on the chart
Pivot Points:
- High pivots marked with "H" triangles
- Low pivots marked with "L" triangles
Support & Resistance:
- Optional signals when price touches but doesn't break channel lines
Trend Visualization:
- Optional bar coloring based on the most recent breakout direction
🔵 Customization
• Pivot Right: Lookback period for pivot detection (default: 10)
• Pivot Left: Forward period for pivot confirmation (default: 40)
• Channel Width: Multiplier for channel width calculation (default: 1.0)
• Support & Resistance Signals: Toggle additional touch signals
• Bar Color: Enable/disable trend-based bar coloring
Calculation:
Detect pivot highs and lows using specified lookback periods
Calculate channel basis using 10-period SMA of close prices
Determine channel width using ATR-like calculation: RMA(high - low, 10) * width multiplier
Set channel lines based on pivot points and calculated deviations
Identify breakouts when price crosses beyond channel lines
The Pivot Channel Break indicator offers a dynamic approach to identifying potential trend changes and breakout opportunities. It combines pivot point analysis with a flexible channel calculation, providing traders with a visual tool for market structure analysis. Use this indicator in conjunction with other technical analysis methods to confirm signals and manage risk effectively.

IsAlgo - Manual Channel► Overview:
Manual Channel is a strategy that allows traders to manually insert channel lines and set the lines’ width. Trades are opened when the price hits one of the lines and bounces back, with the expectation that it will move towards the opposite line. This strategy offers flexibility in configuring channel lines and trading behavior.
► Description:
The Manual Channel strategy is based on the use of manually defined channel lines to guide trading decisions. Traders start by marking four key points on the chart to create the channel. The first two points share the same time but different prices, and the last two points also share the same time but different prices. This method allows traders to place the channel lines precisely based on their analysis and insights. Additionally, the strategy allows for adjusting the width of the channel lines, which acts as a buffer zone around the main lines.
Once the channel is established, the strategy continuously monitors the price movements in relation to these lines. When the price touches one of the channel lines, the strategy opens a trade with the expectation that the price will bounce back and move towards the opposite line. For example, if the price hits the lower channel line, a long trade (buy) might be opened with the anticipation that the price will rise to the upper channel line. Conversely, if the price hits the upper channel line, a short trade (sell) might be opened expecting the price to fall to the lower channel line.
The strategy offers several options for managing trades. Traders can choose to close a trade when the price reaches the opposite channel line, capturing the expected movement within the channel. Additionally, if the price breaks outside the channel, traders have the option to close trades immediately or stop further trade executions to avoid potential losses.
↑ Channel Example:
↓ Channel Example:
► Features and Settings:
⚙︎ Channel: Define the time and prices of the four main points of the channel lines, and set the lines’ width.
⚙︎ Entry Candle: Specify the minimum and maximum body size and the body-to-candle size ratio for entry candles.
⚙︎ Trading Session: Define specific trading hours during which the strategy operates, restricting trades to preferred market periods.
⚙︎ Trading Days: Specify active trading days to avoid certain days of the week.
⚙︎ Backtesting: Perform backtesting for a selected period to evaluate strategy performance. This feature can be deactivated if not needed.
⚙︎ Trades: Configure trade direction (long, short, or both), position sizing (fixed or percentage-based), maximum number of open trades, and daily trade limits.
⚙︎ Trades Exit: Set profit/loss limits, specify trade duration, or exit based on channel breaks.
⚙︎ Stop Loss: Choose from various stop-loss methods, including fixed pips, ATR-based, or highest/lowest price points within a specified number of candles. Trades can also be closed after a certain number of adverse candle movements.
⚙︎ Break Even: Adjust stop loss to break even once predefined profit levels are reached, protecting gains.
⚙︎ Trailing Stop: Implement a trailing stop to adjust the stop loss as the trade becomes profitable, securing gains and potentially capturing further upside.
⚙︎ Take Profit: Set up to three take-profit levels using methods such as fixed pips, ATR, or risk-to-reward ratios. Alternatively, specify a set number of candles moving in the trade’s direction.
⚙︎ Alerts: Comprehensive alert system to notify users of significant actions, including trade openings and closings. Supports dynamic placeholders for take-profit levels and stop-loss prices.
⚙︎ Dashboard: Visual display on the chart providing detailed information about ongoing and past trades, aiding users in monitoring strategy performance and making informed decisions.
► Backtesting Details:
Timeframe: 15-minute EURUSD chart
Initial Balance: $10,000
Order Size: 10 units
Commission: 0.05%
Slippage: 5 ticks
This strategy opens trades around a manually drawn channel, which results in a smaller number of closed trades.

IsAlgo - CandleWave Channel Strategy► Overview:
The CandleWave Channel Strategy uses an exponential moving average (EMA) combined with a custom true range function to dynamically calculate a multi-level price channel, helping traders identify potential trend reversals and price pullbacks.
► Description:
The CandleWave Channel Strategy is built around an EMA designed to identify potential reversal points in the market. The channel’s main points are calculated using this EMA, which serves as the foundation for the strategy’s dynamic price channel. The channel edges are determined using a proprietary true range function that measures the distance between the highs and lows of price movements over a specific period. By factoring in the maximum distance between highs and lows and averaging these values over the period, the strategy creates a responsive channel that adapts to current market conditions. The channel consists of five levels, each representing different degrees of trend tension.
The strategy continuously monitors the price in relation to the channel edges. When a candle closes outside one of these edges, it indicates a potential price reversal. This outside-close candle acts as a signal for a possible trend change, prompting the strategy to prepare for a trade entry. Upon detecting an outside-close candle, the strategy triggers an entry. The logic behind this is that when the price moves outside the defined channel, it is likely to revert back within the channel and move towards the opposite edge. The strategy aims to capitalize on this reversion by entering trades based on these signals.
Traders can adjust the channel’s length, levels, and minimum distance to tailor it to different market conditions. They can also define the characteristics of the entry candle, such as its size, body, and relative position to previous candles, to ensure it meets specific conditions before triggering a trade. Additionally, the strategy permits the specification of trading hours and days, enabling traders to focus on preferred market periods. Exit can be configured based on profit/loss limits, trade duration, and band reversal signals or other criteria.
How it Works:
Channel Calculation: The strategy continuously updates the channel edges using the EMA and true range function.
Signal Detection: It waits for a candle to close outside the channel edges.
Trade Entry: When an outside-close candle is detected, the strategy enters a trade expecting the price to revert to the opposite channel edge.
Customization: Users can define the characteristics of the entry candle, such as its size relative to previous candles, to ensure it meets specific conditions before triggering a trade.
↑ Long Trade Example:
The entry candle closes below the channel level, indicating a potential upward reversal. The strategy enters a long position expecting the price to move towards the upper levels.
↓ Short Trade Example:
The entry candle closes above the channel level, signaling a potential downward reversal. The strategy enters a short position anticipating the price to revert towards the lower levels.
► Features and Settings:
⚙︎ Channel: Adjust the channel’s length, levels, and minimum distance to suit different market conditions and trading styles.
⚙︎ Entry Candle: Customize entry criteria, including candle size, body, and relative position to previous candles for accurate signal generation.
⚙︎ Trading Session: Define specific trading hours during which the strategy operates, restricting trades to preferred market periods.
⚙︎ Trading Days: Specify active trading days to avoid certain days of the week.
⚙︎ Backtesting: backtesting for a selected period to evaluate strategy performance. This feature can be deactivated if not needed.
⚙︎ Trades: Configure trade direction (long, short, or both), position sizing (fixed or percentage-based), maximum number of open trades, and daily trade limits.
⚙︎ Trades Exit: Set profit/loss limits, specify trade duration, or exit based on band reversal signals.
⚙︎ Stop Loss: Choose from various stop-loss methods, including fixed pips, ATR-based, or highest/lowest price points within a specified number of candles. Trades can also be closed after a certain number of adverse candle movements.
⚙︎ Break Even: Adjust stop loss to break even once predefined profit levels are reached, protecting gains.
⚙︎ Trailing Stop: Implement a trailing stop to adjust the stop loss as the trade becomes profitable, securing gains and potentially capturing further upside.
⚙︎ Take Profit: Set up to three take-profit levels using methods such as fixed pips, ATR, or risk-to-reward ratios. Alternatively, specify a set number of candles moving in the trade’s direction.
⚙︎ Alerts: Comprehensive alert system to notify users of significant actions, including trade openings and closings. Supports dynamic placeholders for take-profit levels and stop-loss prices.
⚙︎ Dashboard: Visual display on the chart providing detailed information about ongoing and past trades, aiding users in monitoring strategy performance and making informed decisions.
► Backtesting Details:
Timeframe: 30-minute GBPJPY chart
Initial Balance: $10,000
Order Size: 500 units
Commission: 0.02%
Slippage: 5 ticks

Quan Channel - Quan DaoI tried several channels, like the supertrend, ATR, Donchian or Bollingers, but they do not seem to fit my needs.
So I created a new channel to PREDICT the next impulse move of a price.
The current value of the top or bottom of the channel is based on 2 previous candles (not the candle itself), and it takes into account:
- The Direction of the previous candles (red or green) and
- The Width of their bodies
In my channel, the top or bottom lines will cover the price movement most of the time. But in some cases, when the price is on a big move, it will go out of the channel. And this is the time we need to consider a buy/sell (or take some profit) as well (not necessarily 100% of the time, though).
Personally, I like to use another oscillator in combination with this channel to predict whether it will reverse after the breakouts or continue to make another peak. If you are a DCA or long-term investor, I guess it would be safe to buy at the blue signals (out of bottom) and take some profits at the orange signals (out of top).
I also added an alert when the price breaks out of the channel for easier tracking.
TP-Plus IndicatorThis indicator calculates the current price range.
Calculate the slope or angle of the price velocity for both the fast and the slow period.
You can use it to spot the top and bottom of the range and wait for the price to break out of either level.
Once above the level top level or below bottom level, the price would move approximately the same distance as the height of the range.

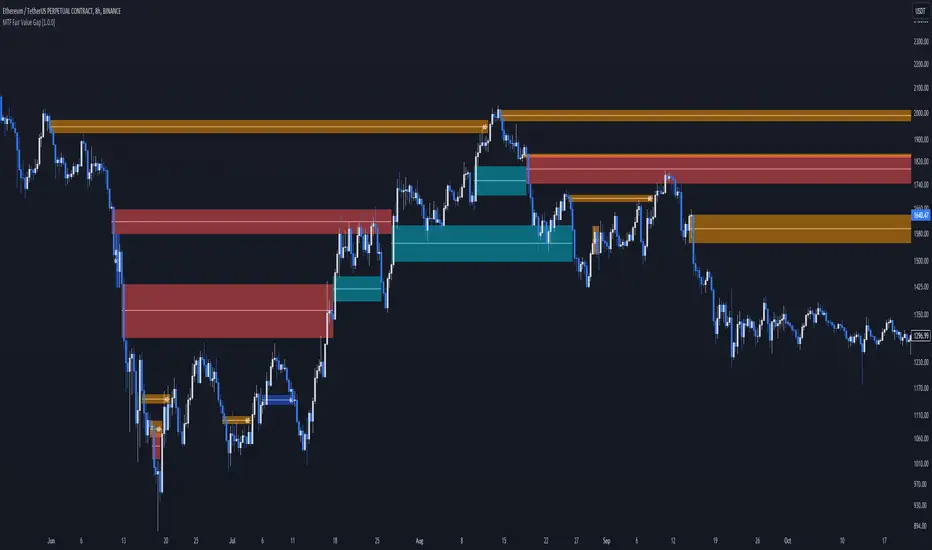
MTF Fair Value Gap [BigBeluga]The MTF Fair Value Gap (FVG) indicator provides multi-timeframe options to observe lower or higher gaps in different timeframes within your current one. This can enhance the confluence in your trading decisions.
🔶 USAGE
An FVG is formed when a candle has an 'empty' body, leaving a gap. These areas are often filled before the market continues to trend in its original direction.
In practical terms, FVGs serve to highlight support areas (bullish FVGs) and resistance zones (bearish FVGs). As a gap is filled, signaling the end of the existing imbalance, it tends to foreshadow an impending price reversal.
While this approach is inherently contrarian, individuals seeking a more trend-following strategy can opt to use FVG identification as straightforward signals. This entails taking a long position upon detecting a bullish FVG and adopting a short position in the presence of a bearish FVG.
🔹 Mitigation
The mitigation point is where the user selects when the FVG is considered filled or no longer usable.
Source => Choose the candle's low/high or close as the mitigation point.
Point => Choose the FVG's mitigation point to trigger after the candle's Source has filled it. Users can choose between the middle point or the top/bottom of the FVG.
ccc
🔹 MTF
This script can display MTF FVGs from different timeframes while showing the current one. This is extremely useful as it avoids the need to switch timeframes frequently and can add significant confluence with the current FVG.
🔹 Threshold
The Threshold is an input to remove insignificant FVGs that are too small to be truly useful. Users can choose between:
Auto => Automatically remove unusable FVGs.
Manual => Set an automatic Threshold.
🔶 TIPS
Users can choose how many FVGs to display on the current chart for better visualization.
Users can choose which FVGs to display: only the current one, only MTF ones, or both.
PRICE CHANNEL MEAN REVERSIONThis script is a Fully Automated trading script meant to be used with "Oanda" broker and the plug-ins for algorithmic trading automation.( FOREX ONLY)
This script is meant to capture "MEAN REVERSION " for intraday charts (1hour) preferably and will hold for days / weeks .trading on forex markets.
(The combination of indicators includes a high and low price channel along with a fast moving average)
This script is original in the description of Alan Hulls moving average combined with the high and low closing of price action.
The concept of this mean reversion strategy is to try and capture price exhaustive moves . The moving average is fast and most times remains in the channel. when the moving average overshoots the channel the average price of the instrument is thought to be rising or falling faster then average, indicating a possibility that the instrument may revert (pull back) this strategy aims to capture that pull back.
This strategy uses a higher risk than reward profile to jump in front of market moves (4 risk to 1 reward)
in the likelihood the instrument will revert back (example) 25 pips before it continues 100 pips in the current direction.
This strategy should only be used in markets that you believe are mean reverting at the time of trading otherwise you will be jumping Infront of a possible trend and the price can continue in the trending direction for an unknown specified amount of time.
This script uses a (user defined period) fast moving average ( green/red color) and (user defined period) price channel (White/Blue) chosen in the indicator settings menu.
The default parameters are 55 with a (minimum of 1 and maximum of 10000) for the moving average and 50 with a (minimum of 1 and maximum of 10000) for the price channel , the default parameters = roughly 2 days of price action on the (1 hour) chart.
"The default parameters should be kept unless you fully understand the complete strategy"
the upper band (white line) is the highest close of the specified period and the lower band (blue line) is the lowest close of the same period.
When the fast moving average over shoots the price channel (exits) then crosses back into the price channel (enters) it will trigger a long or short trade.
The long signal is given when the the moving average crosses below the low band then crosses back above the low band . The trade long trade will be entered and the trade will exit if the stop loss or profit targets are hit or if the short signal is given the trade will close then reverse.
The short trade will be entered if the fast moving average crosses above the upper band (white line) then crosses back down through the upper band (white line) The trade short trade will be entered and the trade will exit if the stop loss or profit targets are hit or if the long signal is given the trade will close then reverse.
When the trade is entered a red , a blue and green horizontal dotted line will appear on the chart.
the blue line is the strategy entry price , the red line is the stop loss price , and the green line is the take profit price . the colors will invert if the trade is long or short.
(Setting alerts should be done in the indicator settings menu, and the parameters you chose will determine the stop loss/target and the amount of "units = (position size)" you wish to trade for the (forex only) markets. using "alert() function calls only" is the only alert that should be used with this strategy.
(note : when "alert() function calls only" is set two messages will be sent, one closing any open position in the opposite direction and one placing the new order regardless if you are currently in a trade or not)
Trade targets , stoploss and trade position size are a user defined variables entered in the indicator settings menu. (target pips minimum 0 and a maximum of 1000)(stop pips minimum of 0 and maximum of 1000)
Back test date range is included in the script for back testing different data periods.
the back ground will be colored a transparent navy blue if the period you are looking trading is with in the date range( note: to place live trades the end date will need to be in the future)
this is also adjustable in the settings menu
The avoid spread filter is a user defined time in which the spread is typically higher than average, applying this filter avoids trades in the specified time. When this filter is applied there will be a transparent red back ground color in the specified time.
Back test default setting are equivocal to OANDA:NZDUSD
at the time of this publication placing trades with the "Oanda" broker are as follows , NZD units = 3250 equal 2000 USD position size . "Oanda" current leverage is 33.3 to 1 for this particular pair and commission is paid in spread (1.7) pips = 0.55 USD per trade , Margin required for the trade is 60.50 USD , Position sizing = 6.5% of a 1000 USD account. OANDA:NZDUSD
Volume Channel - [With Volume Filter]The indicator calculates two volume-weighted moving averages (VWMA) using different lengths, and filters them based on a moving average of volume. The filtered VWMA values are then plotted on the chart as lines, representing the fast and slow moving averages. In addition, upper and lower bands are calculated based on the slow VWMA and plotted as lines on the chart.
The fast and slow VWMA lines can be used to identify trends in the market. When the fast VWMA is above the slow VWMA, it is an indication of an uptrend, and when the fast VWMA is below the slow VWMA, it is an indication of a downtrend. The position of the VWMA lines relative to the upper and lower bands can also be used to identify potential trade signals.
When the price is near the upper band, it indicates that the market is overbought, and when the price is near the lower band, it indicates that the market is oversold. Traders can use these signals to enter or exit trades.
The indicator also includes a volume filter, which means that the VWMA values are only calculated when the volume is above a certain moving average of volume. This helps to filter out noise in the market and provide more accurate signals.
Explanation for each parameter
vwmaLength1: This is the length of the fast volume-weighted moving average (VWMA) used in the calculation. The default value is 10, and it can be adjusted by the user.
vwmaLength2: This is the length of the slow volume-weighted moving average (VWMA) used in the calculation. The default value is 25, and it can be adjusted by the user.
bandLength: This is the length of the moving average used to calculate the upper and lower bands. The default value is 34, and it is not adjustable by the user.
volumeFilterLength: This is the length of the moving average of volume used as a filter for the VWMA calculation. The default value is 5, and it can be adjusted by the user.
src: This is the input source for the VWMA calculation. The default value is close, which means the indicator is using the closing price of each bar. However, the user can select a different input source by changing this parameter.
filteredVwma1: This is the filtered VWMA calculated based on the volume filter and the fast VWMA length. It is plotted as a line on the chart and can be used to identify short-term trends.
filteredVwma2: This is the filtered VWMA calculated based on the volume filter and the slow VWMA length. It is plotted as a line on the chart and can be used to identify long-term trends.
ma: This is the moving average of the filtered slow VWMA values, which is used to calculate the upper and lower bands. It is plotted as a line on the chart.
offs: This is the offset used to calculate the upper and lower bands. It is based on the standard deviation of the filtered slow VWMA values and is multiplied by 1.6185 * 3. It is plotted as a line on the chart.
up: This is the upper band calculated as the moving average plus the offset. It is plotted as a line on the chart and can be used to identify overbought conditions.
dn: This is the lower band calculated as the moving average minus the offset. It is plotted as a line on the chart and can be used to identify oversold conditions.

VWAP Supply and Demand ZonesThis is my 1st indicator enjoy.
Description of the VWAP Supply and Demand Zones indicator:
This indicator uses the Volume Weighted Average Price (VWAP) to identify potential supply and demand zones in the market. The VWAP is a popular indicator that shows the average price of a security weighted by volume over a specified period of time. It can be used as a benchmark to measure the efficiency of trading and to identify trends and price levels.
The indicator plots the VWAP as a blue line on the chart, and also plots two other lines above and below it, which represent the upper and lower bounds of the supply and demand zones. The width of these zones can be adjusted by changing the “Zone Width” input parameter.
The indicator also plots shapes on the chart to mark when a supply or demand zone is formed. A supply zone is formed when the price crosses above the VWAP and then falls back below it, indicating that there is more selling pressure than buying pressure at that level. A red triangle is plotted above the bar where this happens, and a red zone is drawn between the previous close and previous VWAP values.
A demand zone is formed when the price crosses below the VWAP and then rises back above it, indicating that there is more buying pressure than selling pressure at that level. A green triangle is plotted below the bar where this happens, and a green zone is drawn between the previous close and previous VWAP values.
The supply and demand zones can be used as potential areas of support and resistance, where traders can look for reversal or continuation signals. For example, if the price enters a supply zone from below, it may indicate that sellers are willing to sell at higher prices, which could lead to a bearish reversal. Conversely, if the price enters a demand zone from above, it may indicate that buyers are willing to buy at lower prices, which could lead to a bullish reversal.
The indicator can be applied to any timeframe or market, but it may work better on higher timeframes where volume data is more reliable. It can also be combined with other indicators or tools to confirm or filter signals.

Faytterro Bandswhat is Faytterro Bands?
it is a channel indicator like "Bollinger Bands".
what it does?
creates a channel using standard deviations and means. thus giving users an idea about the expensive and cheap zones. It uses a special weighted moving average different from standard bollinger bands, it also averages not only price but also deviations.
how it does it?
it uses this formulas:
how to use it?
its usage is the same as "bollinger band".
length represents the number of candles to be taken into account, source represents the source of those candles and stdev represents the coefficient of the standard deviation.
you can use it with other indicators:

HHLL Strategy This is simple Highest high and Lowest low strategy.
Buy when break HH+offset
Sell when break LL+offset
Offset = (HH-LL)/2

The Killer Whale - Multiple Keltner Channels by JoeFinally, after centuries of pain and suffering, the good townsfolk of TradingView have been given a single Keltner Channel indicator that will grant them FREE access to MORE THAN ONE Keltner Channel.
With "The Killer Whale" indicator, Joe has once again saved all the peasants—those who cannot add 10,000 indicators to our charts—from the dirty tyrants who arrogantly rule over us with disdain.
And, now, not only can you have more than one Keltner Channel with this single indicator, but you can have UP TO FOUR! For FREE!
Yes, I know, it seems too good to be true. But, install and enjoy your newfound freedom!
Options:
Keltner Channel length and source
Multiplication Factor for each channel
SMA or EMA
ATR Length
Border and fill colors for each channel
Now, go, therefore, and Keltner to your heart's content. May The Killer Whale be with your charts forever!

ChannelMomentumBreakerChannelMomentumBreaker
This indicator is based on an original idea which is derived from Dow Theory: "Asset prices incorporate all available information". The driving influence behind this indicator is to consider only Meaningful changes in behaviour in a time independent system.
The way it works is simple and as follows:
The indicator decides on a singular price point called the Pivot Price which will be used as a baseline/calibration point
It then generates its own OHLC candles based on a 1-1 mapping from the real time candles to the "virtual" candles
The ratio between the top tails and bottom tails of these virtual candles will determine if there is a meaningful change in behaviour
The result is reflected in the histogram for conveniency.
The indicator can be considered as time-frame agnostic but works most optimally when derived from smaller time-frames (e.g. its detection of meaningful changes will be better when used in a 1-minute candle time-frame as opposed to a 3-minute time-frame).
Colour scheme:
------------------
The virtual candles follow a two-colour convention:
Gray - Considered a safe zone for entry
Red - Considered less safe
These virtual candles must be analysed in conjunction with the histogram.
Histogram colour scheme:
Red - Signifies less than mid-level change in behaviour
Yellow - Signifies change in behaviour that is not strong enough or too late with respect to when the "up" trend began
Gray - Signifies no meaningful change in behaviour has occurred for a long time
Lime - Signifies meaningful change in behaviour has occurred recently
White - Signifies a meaningful change in behaviour has occurred recently and quickly
Blue - Signifies risky change in behaviour
Teal - Signifies a virtual bar open is greater than the previous virtual bar
In general, the upper half of the histogram is considered as a preferred zone for long entry and vice versa for the bottom half.
Crossover background colour scheme:
Red - Transition from positive behaviour -> negative behaviour (This is triggered when consecutive bars are crossing a certain low threshold )
Green - Transition from negative behaviour -> positive behaviour (This is triggered when consecutive bars are crossing a certain high threshold )
Input parameters:
Fast Acceleration Length and Slow Acceleration Length are used to control the sensitivity of the crossover mechanism on the histogram.
How to use:
The picture depicts the virtual (gray/red) candles and histogram.
The Blue rectangle shows the virtual bars and a full transition from negative behaviour to positive behaviour.
The Red rectangle shows when meaningful negative behaviour is occurring, where it may be suitable to begin preparing for an upwards trend (reversal of behaviour).
The Green rectangle shows when meaningful positive behaviour has occurred, and you can get ready to enter a trade.
A confirmed green bar in histogram is a sign that meaningful positive behaviour has occurred and the trade can be taken above the high confirmed bar.
In the below snapshot - The Green cross hair shows the recommended entry point for a long trade.
snapshot:
Input Parameters
Fast MA Length - Fast threshold for crossing Meaningful changes in behaviour
Slow MA Length - Slow threshold for crossing Meaningful changes in behaviour
Display Imaginary bars - Toggle On/Off for displaying virtual candles
Regression Length - Histogram sensitivity (The Shorter value the more sensitive for changes )
Virtual Bars Smoothing Length - Length threshold for virtual bars smoothing (Increasing/Decreasing the value will impact when we consider Meaningful changes in behaviour)
Limitations:
In some cases when stock is not making a Meaningful change in behaviour for long time both the virtual bars and the histogram will be flat.
In such cases, consider changing to a higher time frame or changing the sensitivity settings.

VWAP High/Low ChannelIn short, the VWAP High/Low Channel is based on VWAP "newsession" on swing high/low, with a basis of the two.
The VWAP High/Low channel seems to act like Bollinger bands or Donchain Channels when squeezing for a breakout, while also acting as a pivot after a breakout.
Robust Channel [tbiktag]Introducing the Robust Channel indicator.
This indicator is based on a remarkable property of robust statistics , namely, the resistance to the presence of data points that deviate significantly from the established trend (generally speaking, outliers ). Being outlier-resistant, the Robust Channel indicator “remembers” a pre-existing trend and thus exhibits a very peculiar "lag" in case of a sharp price change. This allows high-confidence identification of such price actions as a trend reversal, range break, pullback, etc.
In the case of trending and range-bound market conditions, the price remains within the channel most of the time, fluctuating around the central line.
Technical details
The central line is calculated using the repeated median slope algorithm. For each data point in a lookback window of a user-specified Length , this method calculates the median slope of the lines that connect that point to all other points inside the window. The overall median of these median slopes is then calculated and used as an estimate of the trend slope. The algorithm is very efficient as it uses an on-the-fly procedure to update the array containing the slopes (new data pushed - old data removed).
The outer line is then calculated as the central line plus the Length -period standard deviation of the price data multiplied by a user-defined Channel Width Factor . The inner line is defined analogously below the central line.
Usage
As a stand-alone indicator, the Robust Channel can be applied similarly to the Bollinger Bands and the Keltner Channel:
A close above the outer line can be interpreted as a bullish signal and a close below the inner line as a bearish signal.
Likewise, a return to the channel from below after a break may serve as a bullish signal, while a return from above may indicate bearish sentiment.
Robust Channel can be also used to confirm chart patterns such as double tops and double bottoms.
If you like this indicator, feel free to leave your feedback in the comments below!
