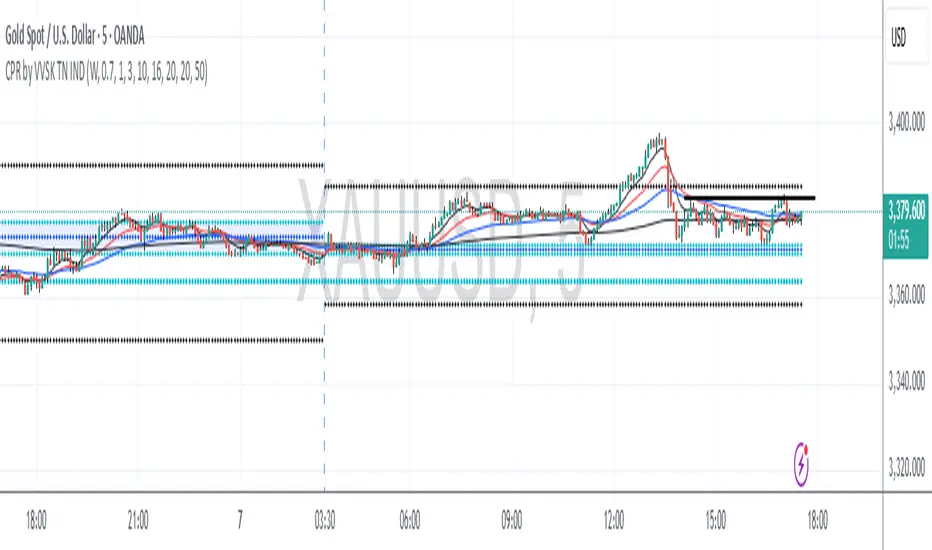
Session Dynamics & Pivot Overlay (Arjo)## **OVERVIEW**
The **Session Dynamics & Pivot Overlay (Arjo)** is a visual analysis tool that displays session-based price ranges, anchored volume-weighted averages, daily pivot levels, and smoothed trend conditions on the chart. It highlights how price interacts with custom sessions, midpoint levels, and dynamic ranges, providing a structured visual layout that helps users observe market behavior over time without implying any form of prediction or trading signal.
## **CONCEPTS**
This indicator incorporates several widely used analytical concepts:
- **Session Ranges:** Identifies user-defined time windows and visually displays their high, low, and midpoint behavior throughout the session.
- **VWAP (Morning Session):** Shows volume-weighted average price calculations for a defined morning period, assisting with visual comparison between price and weighted averages.
- **Daily Pivot Levels:** Displays R1–R2, S1–S2, central pivot, and associated levels derived from prior daily price data.
- **Trend Smoothing:** Uses SuperSmoother filtering and an additional EMA to highlight whether the smoothed trend is rising or falling.
- **EMA + ATR Bands:** Plots a 20-period EMA with upper and lower ATR-derived bands to help visualize short-term price displacement relative to average true range.
All of these elements are presented solely for structural and comparative chart analysis.
## **FEATURES**
- **Custom Session Visualization:** Automatically draws session boxes, capturing the evolving high, low, and midpoint throughout the defined intraday window.
- **Dynamic Midline Calculation:** A midpoint line is updated continuously during the session to visually anchor price within the session’s range.
- **Morning Session VWAP:** Displays a dedicated VWAP line for the morning window with adjustable source and configuration options.
- **Daily Pivot Lines:** Automatically plots pivot, BC/TC, R1–R2, and S1–S2 levels with customizable colors, widths, and line styles.
- **Trend-Responsive Pivot Display:** Optionally toggles visibility of R2 or S2 depending on the direction of the smoothed trend.
- **EMA + ATR Zones:** Renders a 20-EMA and ATR-based support/resistance zone using filled regions for enhanced visual clarity.
- **Full Customization:** Multiple color, transparency, line-style, and display options allow users to adapt the presentation to their charting preferences.
- **Overlay Compatible:** Designed to work directly on price charts without obstructing candles or other overlays.
## **HOW TO USE**
Users can interact with the indicator entirely through the settings panel:
- Adjust session timings to match preferred market hours or custom internal zones.
- Enable or disable the display of pivot levels, VWAP, or the ATR/EMA zone.
- Customize colors and line styles to improve visibility according to the chart background or personal preference.
- Observe how price behaves relative to the session box, midpoint, VWAP, and pivot levels for contextual understanding.
- Utilize the smoothed trend condition to see when the indicator chooses to display certain pivot extensions.
These elements help users interpret chart structure, volatility, and intraday behavior in a visually organized manner.
## **CONCLUSION**
The ** Session Dynamics & Pivot Overlay (Arjo) ** indicator offers a consolidated view of session structure, pivot levels, VWAP, and smoothed trend conditions. Its purpose is to improve visual clarity and assist users in understanding market context without issuing directives or trade suggestions. It functions as an educational tool that enhances chart interpretation and supports structured analysis.
---
## **DISCLAIMER**
This indicator is for educational and visual analysis purposes only. It does not provide trading signals, financial advice, or guaranteed outcomes. Users should conduct their own research and consult a licensed financial professional when necessary. All trading decisions are solely the responsibility of the user.
Happy Trading (Arjo)
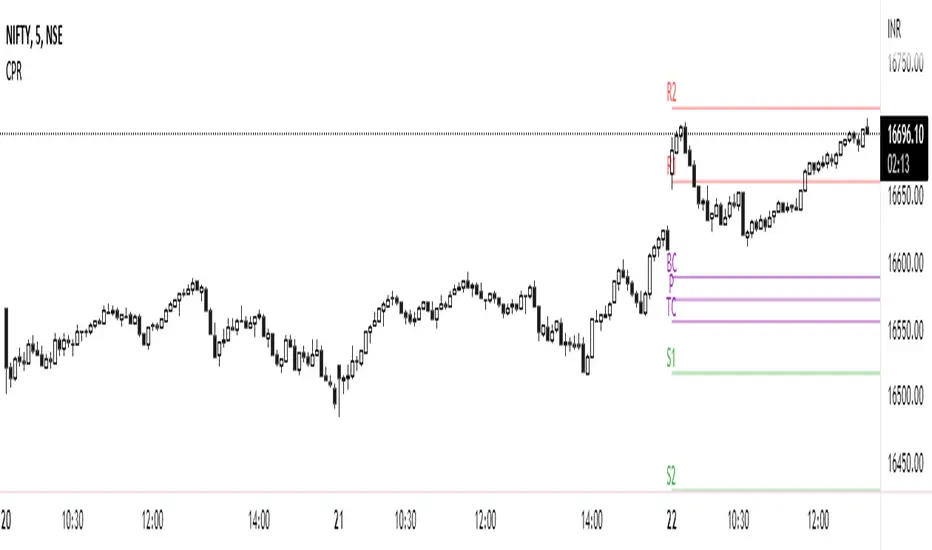
CPR

Clean CPR v2.0Clean CPR v2.0 – Multi-Timeframe CPR & Bias Dashboard
Author: @jsm
// modified from "CPR (Central Pivot Range)" script by ajithcpas and Simple CPR by finallynitin
1. Overview
Clean CPR v2.0 is an intraday + swing CPR toolkit designed to keep the chart visually clean while still giving a full “context dashboard” on the right side.
The script combines:
Classic / Fibonacci / Camarilla CPR with multi-timeframe options
Previous-session CPR & zones
Developing CPR + Dev R1 / Dev S1
Initial Balance & custom session ranges
A sentiment dashboard (Monthly / Weekly / Daily CPR)
CPR width & CPR-type classification with emojis
A >21-EMA “status pill”
Optional Moving Averages and a Day-Open Anchored VWAP
2. Main CPR Engine
What it plots (depending on your inputs):
Central Pivot Range (CPR): BC, TC, PP
Pivot SR levels (R1–R5 / S1–S5)
Choice of Traditional, Fibonacci, Classic, Camarilla formulas
Ability to hide CPR-based SR (for a very clean look)
Multi-timeframe CPR source (Daily, Weekly, Monthly, Quarterly, Half-yearly, Yearly, or Auto)
Extras:
Historical SR pivots (optional)
Adjustable number of CPRs to look back
Label side (Left / Right) and line width controls
3. Previous Session Structure
Optional plotting of the previous session’s structure:
Previous High / Previous Low
Previous CPR (PH / PL zones)
Shaded zones between: PH ↔ R1, PL ↔ S1
Clean labels with prices on the right, aligned to the current day
This gives a quick view of “yesterday’s battle zone” relative to today’s price.
4. Developing CPR & Dev R1 / Dev S1
For intraday traders, the script includes a Developing CPR module:
Dev CPR band for the current session
Optional Dev R1 and Dev S1 levels
Implementation details:
Only the latest Dev CPR / Dev R1 / Dev S1 labels are kept on screen – old labels are cleaned up so you don’t get a vertical stack as time moves.
Option to extend developing CPR lines further into the session.
5. Initial Balance (IB) & Custom Ranges
The script can show:
Initial Balance high/low (first X minutes)
IB extension lines and range
Additional user-defined custom session windows
This is useful for breakout / range traders around the opening range.
6. >21 EMA Status Box
On the right side you can enable a compact >21EMA info box:
Uses Daily 21 EMA (requested via security() so it’s consistent across intraday timeframes).
A dot + label show the relationship between close and 21 EMA:
7. Dashboard – Monthly / Weekly / Daily CPR Context
A compact dashboard table appears on the right (position & size configurable).
7.1 Location vs CPR (M / W / D)
For each timeframe:
It classifies the close as Above / Inside / Below its CPR band.
7.2 Sentiment Header – “Trust the Bulls / Bears / Patience”
The dashboard header follows Daily CPR location:
If Daily is above its CPR → header: “Trust the Bulls” (green background)
If Daily is below its CPR → header: “Trust the Bears” (red background)
If Daily is inside its CPR → header: “Have Patience” (neutral grey)
8. CPR Width & CPR Type (with Emojis)
8.1 CPR Width – Daily
Daily CPR width (% of price) is classified as:
🎯 Super Narrow
📏 Narrow
➖ Medium
📐 Wide
Useful for identifying potential trend / expansion days vs balanced sessions.
8.2 CPR Type – 3-day Structure
Based on the last three daily CPRs, the script categorises CPR structure as:
Ascending – 3-day rising CPR
Descending – 3-day falling CPR
Inside – today’s CPR within yesterday’s
Outside – today’s CPR outside yesterday’s
Asc Rev – bullish reversal pattern
Desc Rev – bearish reversal pattern
Overlapping – messy / overlapping CPRs
9. Moving Averages (MA 1–5)
Optional Moving Average panel Up to 5 MAs, each configurable:
Type: SMA, EMA, SMMA (RMA), WMA, VWMA
10. Day-Open Anchored VWAP
Optional Day-Open VWAP module. Resets VWAP at each new trading day’s open.
This is helpful for intraday mean-reversion and VWAP-based trade locations.
11. Recommended Use & Notes
Best used on indices and liquid futures where CPR, previous session zones and VWAP have strong interaction.
Works on any timeframe; for the full effect, try intraday charts (3-15 min) with:
Dashboard enabled
Daily CPR as the base
Dev CPR + Day-Open VWAP for intraday structure
21EMA box and one or two MAs for trend confirmation.
Disclaimer:
This script is for educational and informational purposes only. It does not constitute financial advice or a recommendation to buy or sell any security. Always test on paper / demo and combine with your own analysis and risk management.

Clean CPR for Intraday, Swing trading✅ Clean CPR for Intraday & Swing Trading (NSE-Optimized)
Simple, Accurate, No-Clutter CPR levels for NIFTY, BANKNIFTY, FINNIFTY & Stocks
Perfect for Indian intraday & swing traders who want clean charts, reliable zones, and fast decision-making without overcomplicated indicators.
✅ 📌 Short Summary
This indicator plots Previous Day High/Low, CPR, Support & Resistance, and high-probability shaded zones (PH↔R1 & PL↔S1). It’s built specifically to help Indian traders identify reversal zones, breakout levels, and trend direction quickly — without chart noise or unnecessary lines.
✅ 🔍 What This CPR Indicator Does
A clean, beginner-friendly version of CPR built for practical trading in NSE markets.
1️⃣ Previous Day High & Low (PH / PL)
Plots yesterday’s high & low with price labels
These act as powerful reference levels used heavily in Indian intraday setups
Helps spot opening range breakouts, rejections, and pullback entries
2️⃣ Central Pivot Range (CPR)
CPR gives the market structure for the day
Price above CPR → Bullish bias
Price below CPR → Bearish bias
Narrow CPR → Possible trending day
Wide CPR → Likely sideways market
This is especially useful in NIFTY, BANKNIFTY, which reacts strongly to CPR width.
3️⃣ Support & Resistance Levels (R1 / S1)
Plots the first major resistance and support levels
You can plot R1 to R5, S1 to S5
Each Line can be same or different color as per your choice
4️⃣ Smart Shaded Zones (High-Probability Areas)
These shaded blocks highlight the most important reversal zones:
✅ Resistance Zone → Area between PH and R1
✅ Support Zone → Area between PL and S1
These zones often act as:
Bounce areas
Reversal regions
Ideal trade entry/exit points
Especially powerful when combined with opening range & volume spikes.
5️⃣ Current Day Open Line
Shows the opening price of today, a key reference for:
Trend confirmation
Intraday bias
Opening drive setups
6️⃣ Clean Design — No Clutter
Old historic zones are automatically removed
Only the useful previous session zones remain
All prices shown as whole numbers (no decimals)
Clear labels, clean zones, easy to read even on mobile
✅ Why This Is Perfect for Indian Traders
This indicator is optimized for:
NIFTY Futures / Options
BANKNIFTY Futures / Options
FINNIFTY
NSE Stocks
Index scalping & options trading
Indian intraday traders rely heavily on:
Previous Day High/Low
CPR width
R1/S1 reactions
Day Open behavior
PH↔R1 reversal zones
PL↔S1 support zones
This tool highlights all of them automatically, without crowding your chart.
✅ Who Should Use This
✔ New traders
✔ Intraday scalpers
✔ Swing traders
✔ Option buyers/sellers
✔ Anyone who wants a clean CPR layout without confusing extras
✅ Benefits
Clear bullish/bearish bias
High-precision reversal zones
Better entries/exits
Faster chart reading
No overthinking — the zones show themselves

Simple CPR for intraday index tradingSimple CPR is an indicator that displays the Central Pivot Range (CPR) and Support-Resistance pivots. It offers granular customization across CPR, Floor pivots, Developing CPR, and Session High/Low levels.
Original concept from Larry Williams, Mark Fisher & Frank Ochoa
Modified from " CPR (Central Pivot Range)" script by ajithcpas
What is CPR (Central Pivot Range)?
The Central Pivot Range (CPR) is calculated from the previous period’s High (H), Low (L), and Close (C). It forms three levels:
• Pivot (P) = (H + L + C) / 3
• Top Central (TC) = ( P - BC) + P
• Bottom Central (BC) = ( H + L)/2
Together, these levels form a central zone representing the market’s “value area.” Price trading above the CPR typically indicates bullish sentiment, while trading below the CPR reflects bearish bias. A narrow CPR often precedes strong trending moves, whereas a wider CPR signals potential consolidation.
How Pivot Levels are Calculated
Beyond CPR, the indicator supports multiple pivot calculation models, including Traditional, Classic, Fibonacci, and Camarilla
For example, in the traditional model:
• R1 = ( 2 × P ) − L
• S1 = ( 2 × P ) − H
• Higher levels (R2, R3…) scale proportionally by the prior range (H-L).
These levels serve as dynamic intraday support-resistance zones and breakout targets.
Key Features
⦿ Multi-Formula CPR : Select Traditional, Classic, Fibonacci, or Camarilla pivots.
⦿ Multi-Timeframe Control : Auto-detect or manually set CPR timeframe (Daily → Yearly).
⦿ Complete Pivot Suite : Extending to five resistance and five support levels (R1–R5, S1–S5) with optional midpoints (R0.5, R1.5, R2.5, R3.5, R4.5, S0.5, S1.5, S2.5, S3.5, S4.5).All levels can be individually toggled on or off, giving traders complete control over the level of chart detail they prefer.
⦿ Full Customization : Independently toggle lines, fills, price labels, and level names.
⦿ Developing CPR & S/R : Real-time projection of next-session CPR, R1, and S1 with separate visibility controls.
⦿ Session High/Low Tracking : Plot Previous-Session High (PH) & Low (PL) with optional labels and prices.
⦿ Look-Back Flexibility : Display any number of historical CPR/pivot periods.
⦿ Styling Precision : Choose line width, style (solid, dashed, dotted), and individual colors.
⦿ Optional Fills : Visualize the CPR zone or CPR–R1/S1 bands with semi-transparent shading.
⦿ Optimized Performance : Efficient array-based drawing for smooth chart performance even with a long history.
Use Case
CPR analysis helps identify trend bias, volatility contraction/expansion, and key support-resistance zones. This indicator is ideal for intraday indices traders who need a structured yet customizable price-action framework.
Disclaimer
This script is for educational and technical analysis purposes only. It does not constitute financial advice or a recommendation. Always perform independent analysis and manage risk appropriately before placing trades.

CPR by Hexaurum LearningCPR (Central Pivot Range) Indicator Summary
Formula:
The CPR consists of three levels calculated from the previous period's price data:
Central Pivot (P) = (High + Low + Close) / 3
Bottom Central (BC) = (High + Low) / 2
Top Central (TC) = (High - Low) / 2 + Central Pivot
Note: TC can also be written as: 2 × Pivot - BC
The CPR range is the area between TC and BC (shown as a box in the indicator).
Key Features:
Multiple Timeframes: Daily, Weekly, and Monthly CPR levels
Developing CPR: Real-time CPR that updates as the current period forms
Fixed CPR: Static CPR from the completed previous period
Benefits & Trading Applications:
Trend Identification
Narrow CPR = Strong trending move likely (breakout expected)
Wide CPR = Consolidation or range-bound market
Support & Resistance
CPR acts as a strong support/resistance zone
Price tends to respect these levels for reversals or bounces
Breakout Trading
Price breaking above TC = Bullish signal
Price breaking below BC = Bearish signal
The narrower the CPR, the more explosive the breakout
Intraday Direction
If price opens above CPR = Bullish bias for the day
If price opens below CPR = Bearish bias for the day
Price within CPR = Neutral/range-bound
Multiple Timeframe Analysis
Higher timeframe CPR (Weekly/Monthly) provides major S/R zones
Daily CPR helps with precise entry/exit points
Confluence of multiple CPR levels increases reliability
Risk Management
Clear levels for stop-loss placement (beyond TC or BC)
Defined risk-reward zones for position sizing
Popular Strategy: Trade the CPR breakout with volume confirmation, using BC/TC as stop-loss levels.

D, W, M_CPR _ By VAZHGA VALAMUDAN SKcpr for daily, weekly, monthly levels and daily weekly monthly high low with ema 8,20,50,200"
CPR by DSKThis CPR (Central Pivot Range) indicator is designed to provide multi-timeframe insights and simplify trend analysis for traders of all levels. Key features include:
1. Dynamic CPR Levels
Automatically adapts and displays CPR levels based on the current chart timeframe (Daily, Weekly, or Monthly).
Useful for identifying intraday or swing trading opportunities.
2. Market Sentiment Summary Table
A compact summary table indicates the market bias (Bullish/Bearish) using the relative position of the price to the Daily, Weekly, and Monthly CPR Pivots.
Helps you instantly assess the prevailing trend across key timeframes.
3. Target Achievement Status
The summary also highlights if any CPR-based targets or key levels have been hit, offering valuable confirmation for trade setups and exits.
This indicator is ideal for traders seeking a quick, visual overview of market structure and trend strength using the well-known CPR method.

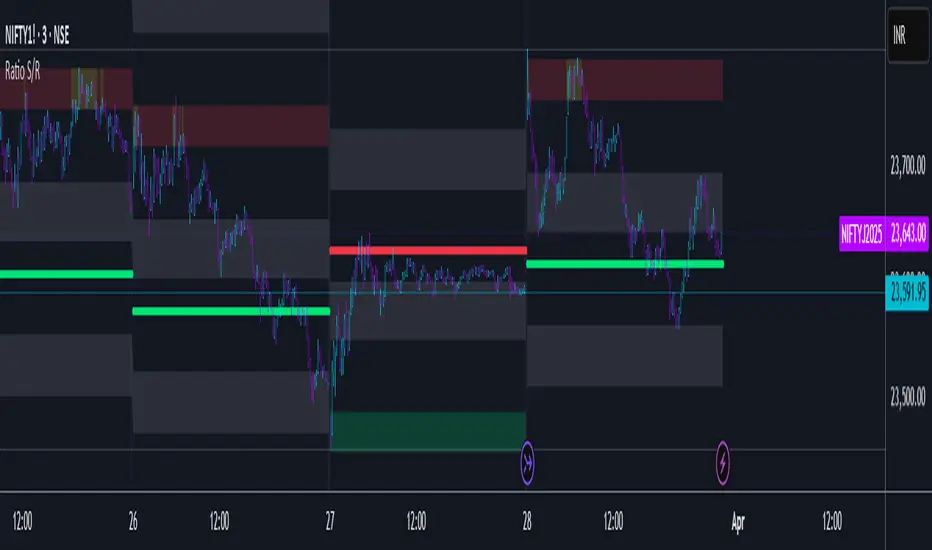
Ratio S/RRatio S/R - Intraday Support & Resistance Levels
Introduction
This script identifies key intraday support and resistance (S/R) levels where price tends to reverse frequently. It is designed specifically for intraday trading and aims to help traders find high-probability reversal zones.
The logic behind the script revolves around logarithmic returns, historical volatility, and ratio-based price levels. The script dynamically calculates price ranges using standard deviation-based volatility and applies preset ratio levels to determine potential support and resistance zones.
How It Works
Dynamic Range Calculation
The script calculates the price range based on the previous day’s logarithmic return volatility.
The range is then used to project different levels of price movement.
Reference Price
You can choose whether the reference price is from today’s open or yesterday’s close (oporcl setting).
This helps adapt the levels based on market behavior.
Ratio-Based Levels
The script applies specific ratios to the calculated range:
0.0833 (Minor Reversal Zone)
0.25 & 0.38 (Primary Reversal Zones)
0.62 & 0.75 (Significant Reversal Zones)
1.0 & 1.25 (Extreme Reversal Zones)
These levels act as potential support and resistance points.
Disclaimer: This is just for educational purpose . Trading is risky activity and how you use this tool is your own responsibility. The publisher of this tool does not make any claims.
CPR by NKDCentral Pivot Range (CPR) Trading Strategy:
The Central Pivot Range (CPR) is a widely-used tool in technical analysis, helping traders pinpoint potential support and resistance levels in the market. By using the CPR effectively, traders can better gauge market trends and determine favorable entry and exit points. This guide explores how the CPR works, outlines its calculation, and describes how traders can enhance their strategies using an extended 10-line version of CPR.
What Really Central Pivot Range (CPR) is?
At its core, the CPR consists of three key lines:
Pivot Point (PP) – The central line, calculated as the average of the previous day’s high, low, and closing prices.
Upper Range (R1) – Positioned above the Pivot Point, acting as a potential ceiling where price may face resistance.
Lower Range (S1) – Found below the Pivot Point, serving as a potential floor where price might find support.
Advanced traders often expand on the traditional three-line CPR by adding extra levels above and below the pivot, creating up to a 10-line system. This extended CPR allows for a more nuanced understanding of the market and helps identify more detailed trading opportunities.
Applying CPR for Trading Success
1. How CPR is Calculation
The CPR relies on the previous day's high (H), low (L), and close (C) prices to create its structure:
Pivot Point (PP) = (H + L + C) / 3
First Resistance (R1) = (2 * PP) - L
First Support (S1) = (2 * PP) - H
Additional resistance levels (R2, R3) and support levels (S2, S3) are calculated by adding or subtracting multiples of the previous day’s price range (H - L) from the Pivot Point.
2. Recognizing the Market Trend
To effectively trade using CPR, it’s essential to first determine whether the market is trending up (bullish) or down (bearish). In an upward-trending market, traders focus on buying at support levels, while in a downward market, they look to sell near resistance.
3. Finding Ideal Entry Points
Traders often look to enter trades when price approaches key levels within the CPR range. Support levels (S1, S2) offer buying opportunities, while resistance levels (R1, R2) provide selling opportunities. These points are considered potential reversal zones, where price may bounce or reverse direction.
4. Managing Risk with Stop-Loss Orders
Proper risk management is crucial in any trading strategy. A stop-loss should be set slightly beyond the support level for buy positions and above the resistance level for sell positions, ensuring that losses are contained if the market moves against the trader’s position.
5. Determining Profit Targets
Profit targets are typically set based on the distance between entry points and the next support or resistance level. Many traders apply a risk-reward ratio, aiming for larger potential profits compared to the potential losses. However, if the next resistance and support level is far then middle levels are used for targets (i.e. 50% of R1 and R2)
6. Confirmation Through Other Indicators
While CPR provides strong support and resistance levels, traders often use additional indicators to confirm potential trade setups. Indicators such as moving averages can
help validate the signals provided by the CPR.
7. Monitoring Price Action At CPR Levels
Constantly monitoring price movement near CPR levels is essential. If the price fails to break through a resistance level (R1) or holds firm at support (S1), it can offer cues on when to exit or adjust a trade. However, a strong price break past these levels often signals a continued trend.
8. Trading Breakouts with CPR
When the price breaks above resistance or below support with strong momentum, it may signal a potential breakout. Traders can capitalize on these movements by entering positions in the direction of the breakout, ideally confirmed by volume or other technical indicators.
9. Adapting to Changing Market Conditions
CPR should be used in the context of broader market influences, such as economic reports, news events, or geopolitical shifts. These factors can dramatically affect market direction and how price reacts to CPR levels, making it important to stay informed about external market conditions.
10. Practice and Backtesting for Improvements
Like any trading tool, the CPR requires practice. Traders are encouraged to backtest their strategies on historical price data to get a better sense of how CPR works in different market environments. Continuous analysis and practice help improve decision-making and strategy refinement.
The Advantages of Using a 10-Line CPR System
An extended 10-line CPR system—comprising up to five resistance and five support levels—provides more granular control and insight into market movements. This expanded view helps traders better gauge trends and identify more opportunities for entry and exit. Key benefits include:
R2, S2 Levels: These act as secondary resistance or support zones, giving traders additional opportunities to refine their trade entries and exits.
R3, S3 Levels: Provide an even wider range for identifying reversals or trend continuations in more volatile markets.
Flexibility: The broader range of levels allows traders to adapt to changing market conditions and make more precise decisions based on market momentum.
So in Essential:
The Central Pivot Range is a valuable tool for traders looking to identify critical price levels in the market. By providing a clear framework for identifying potential support and resistance zones, it helps traders make informed decisions about entering and exiting trades. However, it’s important to combine CPR with sound risk management and additional confirmation through other technical indicators for the best results.
Although no trading tool guarantees success, the CPR, when used effectively and combined with practice, can significantly enhance a trader’s ability to navigate market fluctuations.

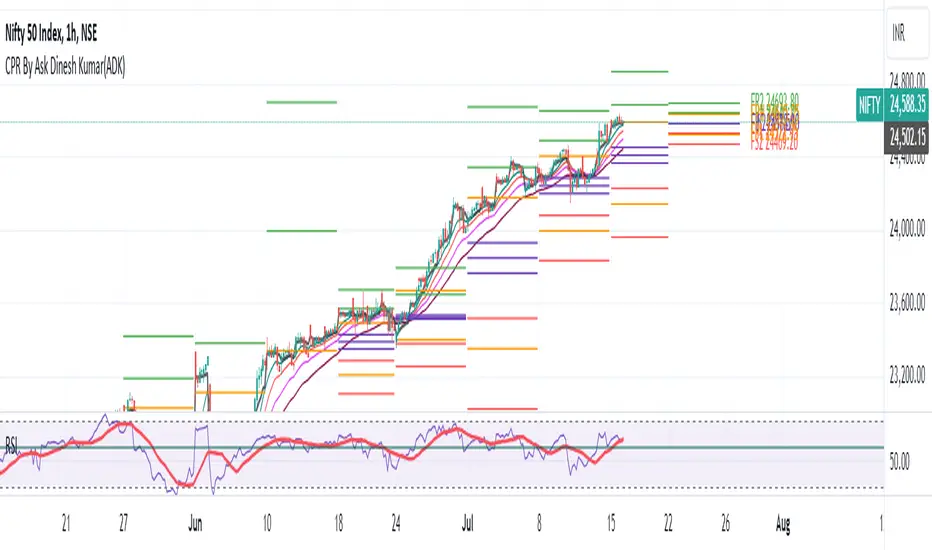
CPR By Ask Dinesh Kumar(ADK)Simple CPR Indicator to increase probability of profitable trades:
The Central Pivot Range (CPR) is a trading tool used by traders to identify potential support and resistance levels in the market. Here's a simplified explanation of how traders can potentially profit using the Central Pivot Range with 10 lines:
1. *Understanding CPR*: CPR consists of three lines: the pivot point (PP), upper resistance level (R1), and lower support level (S1). Additionally, traders often add five more of profitable tradeslines above and below the PP to create a 10-line CPR.
2. *Identify Trend*: Determine the prevailing market trend. If the market is bullish, traders will look for buying opportunities near support levels. If the market is bearish, they'll seek selling opportunities near resistance levels.
3. *Entry Points*: Look for entry points near the support (S1) or resistance (R1) levels within the CPR. These levels can act as potential turning points where price may reverse.
4. *Risk Management*: Set stop-loss orders to manage risk. Stop-loss orders should be placed slightly below support levels for long positions and slightly above resistance levels for short positions.
5. *Profit Targets*: Determine profit targets based on the distance between entry point and the next support or resistance level. Some traders use a risk-reward ratio to ensure potential profits outweigh potential losses.
6. *Confirmation*: Use additional technical indicators or price action patterns to confirm potential entry or exit points within the CPR.
7. *Monitor Price Action*: Continuously monitor price action around the CPR levels. Traders should be prepared to adjust their positions if price breaks through support or resistance levels convincingly.
8. *Trade Management*: Once in a trade, actively manage it by adjusting stop-loss orders, trailing stops, or taking partial profits as price moves in the desired direction.
9. *Market Conditions*: Consider broader market conditions, such as economic indicators, geopolitical events, or news releases, which can impact price movements and the effectiveness of CPR.
10. *Practice and Analysis*: Practice using CPR on historical price charts and analyze past trades to refine strategies and improve decision-making skills.
Remember, trading involves risks, and no strategy guarantees profits. It's essential to thoroughly understand the concepts behind CPR and practice disciplined risk management to increase the likelihood of successful trades.
How does central pivot range work:
Sure here's a concise explanation of how the Central Pivot Range (CPR) works in 10 points:
1. *Calculation*: CPR is calculated using the previous day's high (H), low (L), and close (C) prices.
2. *Pivot Point (PP)*: The central point of CPR is the average of the previous day's high, low, and close prices: PP = (H + L + C) / 3.
3. *Upper Resistance Levels (R1, R2, R3)*: These are potential price levels above the pivot point where resistance may occur. They are calculated by adding a multiple of the range (H - L) to the pivot point: R1 = (2 * PP) - L, R2 = PP + (H - L), R3 = PP + 2 * (H - L).
4. *Lower Support Levels (S1, S2, S3)*: These are potential price levels below the pivot point where support may occur. They are calculated similarly to resistance levels but subtracting multiples of the range from the pivot point: S1 = (2 * PP) - H, S2 = PP - (H - L), S3 = PP - 2 * (H - L).
5. *Trading Signals*: Traders use CPR to identify potential support and resistance levels where price may reverse or stall.
6. *Range Bound Markets*: In range-bound markets, traders may buy near support levels (S1, S2, S3) and sell near resistance levels (R1, R2, R3).
7. *Breakout Trading*: When price breaks through a CPR level convincingly, it may indicate a potential trend continuation or reversal, providing breakout trading opportunities.
8. *Volume and Momentum*: Traders often look for confirmation from volume and momentum indicators when price approaches CPR levels.
9. *Intraday Trading*: CPR can be applied to intraday timeframes as well, providing shorter-term traders with potential trading levels for the day.
10. *Dynamic Indicator*: CPR is dynamic and recalculates daily based on new price data, allowing traders to adapt their strategies to current market conditions.
Understanding how to interpret CPR levels and integrate them into a trading strategy can help traders identify potential entry and exit points in the market.
Pivot Points with MID LevelsThis indicator shows the Standard Pivot Points level based on daily values that can act as support and resistance. It is used by a variety of traders around the world. You can select which time frame Pivot Point Levels you'd like. Daily, weekly etc... Perfect for swing trading or day trading.
Pivot Points- Shows 3 levels of resistance, the Pivot Point and 3 levels of support
(R3, R2, R1, PIVOT POINT, S1, S2, S3
MID Levels- The MID levels are 50% retracement from the pivot point level above it and below
Example- R3, MID, R2, MID, R1, MID, PIVOT POINT, MID, S1, MID, S2, MID, S3
With this indicator you will also have the option to show the Previous days High and Low that are also important levels. On gap up/down days it is always interesting to see if price will close the gap, hence the important level to note.
PDH= Previous Days High
PDL= Previous Days Low
I have added a feature that you can now select specific color to each level and the line style for each level to help understand which levels are being show by personal needs.
Happy Trading

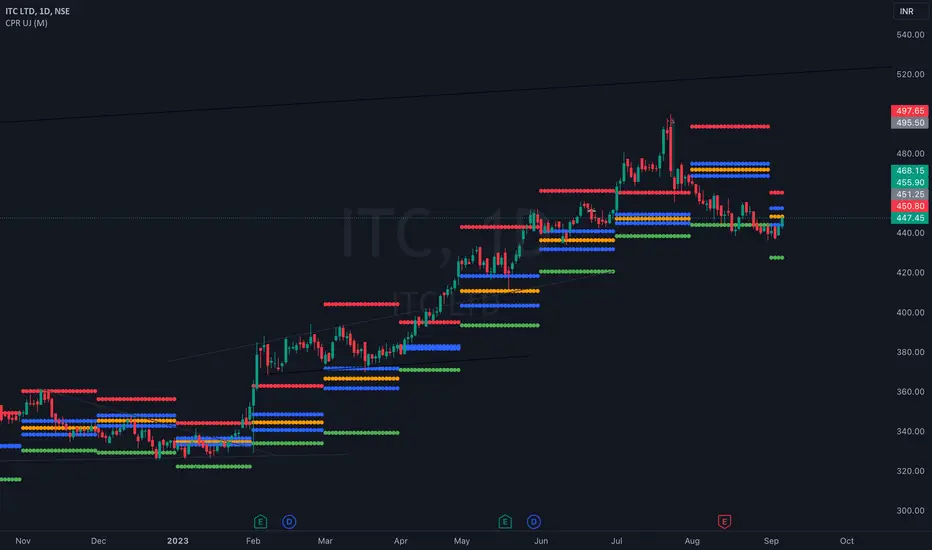
CPR UJHi i am UJ, This is Central Pivot Level which includes Daily , Weekly , Monthly Range You have to choose the range in indicator setting.
Upper red line is resistance , Lower green line is support you can buy if resistance broken , sell if support is broken go with price action or SMC confirmation which ever strategy you use indicator only indicates it wont work 100% , your accuracy will improve if you combine indicator with strategy.
CPR (Central Pivot Range)Central Pivot Range is a trend and volatility forecasting tool. It is calculated from previous session's (day, week, or month) high, low, close values. It works on the idea that every trading session must be the result of its previous trading session.
Pivot, top pivot and bottom pivot values form the CPR. If the CPR for each trading session is getting higher (and also the price is trading above it) then it denotes bullish bias and vice versa for bearish. And the width of the CPR (i.e., distance between top and bottom pivot) denotes the volatility of the session.
If the CPR width is narrow, we can expect a trending or volatile trading session. If it's wide, then we can expect a range bound or sideways trading session.
Support and Resistance levels can be used as a profit booking zone or to add/reduce position sizing.
In this Indicator you have the following:
1. CPR with traditional support and resistance levels (S1-S5 & R1-R5).
2. Developing CPR for next trading day, week, and month.
3. Customizable lookback period, line width.
4. Option to show/hide labels, prices, SR levels, developing CPR.

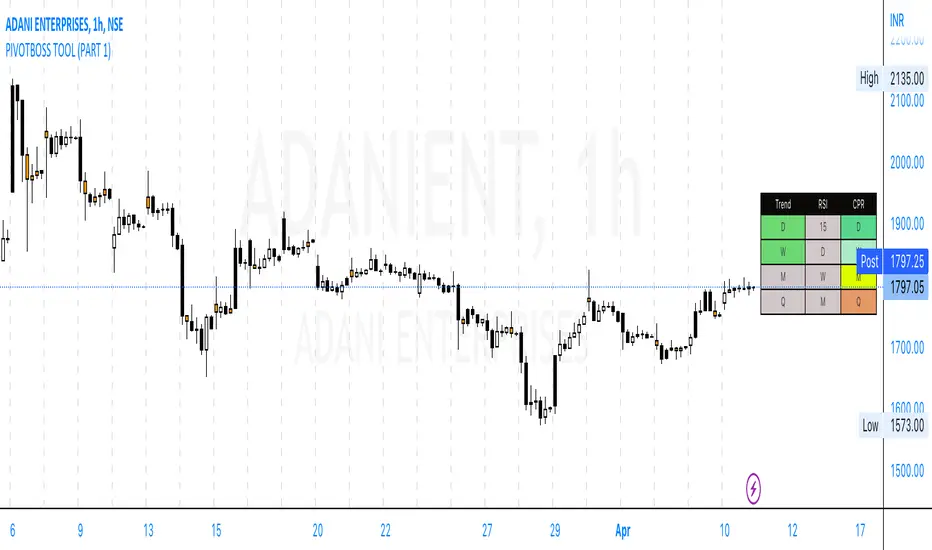
PivotBoss Tool (PART 1)Hello Everyone,
This indicator is being published on TradingView to help traders solve their multiframe analysis issue and at the same time get additional information of different timeframe like - Strength, Momentum and Central Pivot Range relationships all under one single frame.
This indicator is based on the concepts of Secrets of Pivot Boss by Mr.Frank Ochoa and strives to provide more insightful information of pivot points and other general indicators being used by traders on day-to-day basis in the simplest format possible so that traders of all kinds can relate to the same.
Below is the brief information of the indicator table you see in the layout of the above chart -
-This is the most interesting part of the indicator where the user gets to the Pivot Trend, RSI strength and Central Pivot Range (CPR) relationship all under one table which comes to be very handy during Intraday trading and Swing/Positional Trading.
#Pivot Trend
This column gives the user the information regarding price movement near to pivot points across multiple timeframes in a single frame which gives the user the accessibility to track the trend in different time frames, to make the information readily available colour code are included in the table which is customisable in the hands of the user and below is the explanation for the same -
- GREEN (Above H3)
- GREY (Between H3-L3)
- RED (Below L3)
#RSI
This column gives the user the information regarding price movement near to RSI values across multiple timeframes in a single frame which gives the user the accessibility to track the momentum in different time frames, to make the information readily available colour code are included in the table which is customisable in the hands of the user and below is the explanation for the same -
- GREEN (Above 70)
- GREY (Between 30 to 70)
- RED (Below 30)
#Central Pivot Range (CPR) Relationship
This column gives an idea of the trend direction and intensity which is exactly formulated according the concepts of PivotBoss Book and it also states the relationship of CPR's with customisable colour codes in the indicator settings, to make the information readily available colour code are included in the table which is customisable in the hands of the user and below is the explanation for the same -
There are generally six possible relationships for CPR compared to previous CPR where the timeframe can be variable but the relationship identification stays constant which is depicted as below -
- GREEN
1) Dark Green denotes "Higher Value CPR Relationship"
2) Light Green denotes "Overlapping Higher Value CPR Relationship"
- RED
3) Dark Red denotes "Lower Value CPR Relationship"
4) Light Red denotes "Overlapping Lower Value CPR Relationship"
- GREY
5) Denotes "Outside Value CPR Relationship"
- YELLOW
6) Denotes "Inside Value CPR Relationship"
This is a very basic tool created to identify Strength, Momentum and Central Pivot Relationship (CPR) across different timeframes so that the user is able to identify the broader aspect of the stock in a single frame and thus can execute his trading skills with optimum efficiency.
This indicator will be updated with time and depending on community's feedback and requirements.
Credits -
- Mr. Frank Ochoa (Concepts and ideas from the book 'Secrets of PivotBoss' )
- TradingView (Providing a platform to traders to simply their trading through 'PineScript')
Regards,
Mukkull
CPR - Central Pivot Range (by Alex L.)CPR or Central Pivot Range is a tool for identifying a trend, its volatility and its future targets for the price levels (in up or down directions).
What this indicator offers:
- Main purpose of this indicator is to display levels of support/resistance in a given trend as potentially good levels of entering into position or existing from a position. Entry levels are RED, resistance levels are in GREEN.
- You have the ability to view daily, weekly, monthly pivot levels, depending on what kind of trader you are.
- Unique to this indicator - you have the ability to view YEARLY pivot levels.
- Unique to this indicator - you have the "Pivots History" option to either show all history or just the recent piriod to make your chart clean of "noise".
- Unique to this indicator - you can view "future" pivot levels based on current price.
- You have the ability to view "future pivots" which can be useful as entry or exit levels for the current trend.
- You have the ability to view one, two, three or four pivor levels concurrently depending on how much information you want on your chart.
- You have the option to use "Compact View" to further reduce "noise" and make your chart event more clean.
- Open source.
Some guidelines:
- When current Central Pivot Range is higher than previous Central Pivot Range then the stock is in an uptrend and vice versa.
- Wide Central Pivot Range usually means the stock is in a "sideways trend" and volatility is low.
- Tight Central Pivot Range usually means the stock has a very low volatility and is about to explode (up or down). Switching to a higher timeframe can often give hints to what direction the stock is likely to go.
Default settings:
- Pivot Levels : "Two Pivot Levels"
- Filter/Hide Pivots: "Hide Pivot+BC+TC"
- Pivots History: "Few Months Back"
'V' Show Monthly Pivots
'V' Show Future Pivots
Calculations of pivot levels formula is according to book "Secrets of a Pivot Boss" by Franklin O. Ochoa.
Quote from the book: "The way to make money is to make it. The way to make big money is to be right at exactly the right time."
Open source.
Enjoy!

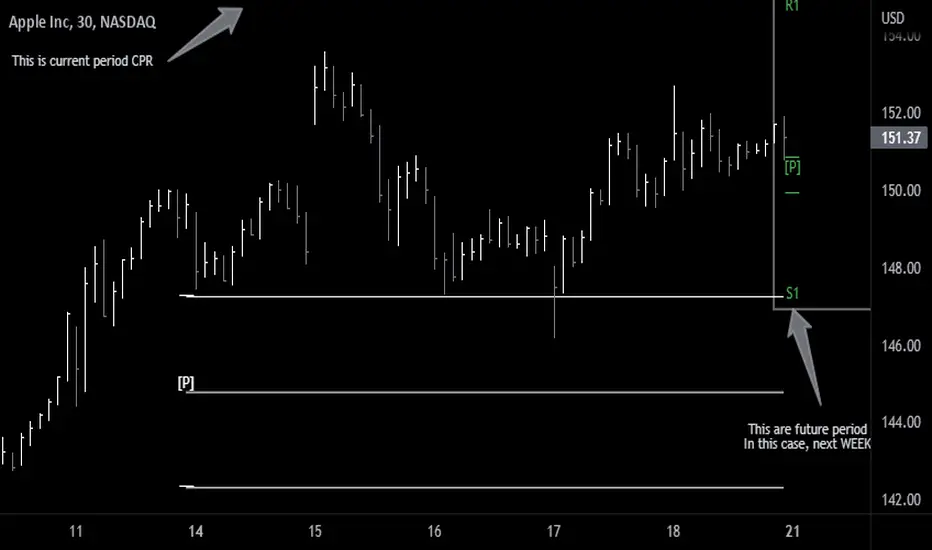
Future Pivots CPR - All Timeframes
Simple idea that allows you to display tomorrow CPR/ Standard Floor Trader Pivots based on the high, low and close of today session. Likewise, it works for higher timeframes taking into account the high, low, close of the period (e.g. weekly, monthly, year).
Just be aware that -regardless of the timeframe- if the period is still in development, the indicator will constantly/ live update the values until the period is closed!! This indicator is meant to be used when preparing for the next trading period. If you want to use it live, I'd suggest using the function of this indicator which allows to display only current/closed pivots-
Similar to other script I published, this indicator lower timeframes (Daily and Weekly) will work with lower timeframe bars, this is the Minutes and Hour bars. Conversely, higher timeframe CPR/Pivots will work better with timeframes/charts from Daily and above.
Available tick/untick functions:
- Select timeframe
- Show current CPR & Support/Resistance
- Show tomorrow CPR & Support/Resistance
- Display historical CPR (CPR only)
- Show extended support and resistance lines (S2,S3,R2,R3) for current and future pivots.
Amit Advance CPRthis indicator shows the CPR along with the pivots for the next day and in the live market. It would be easy to see the favorite stocks CPR in advance.

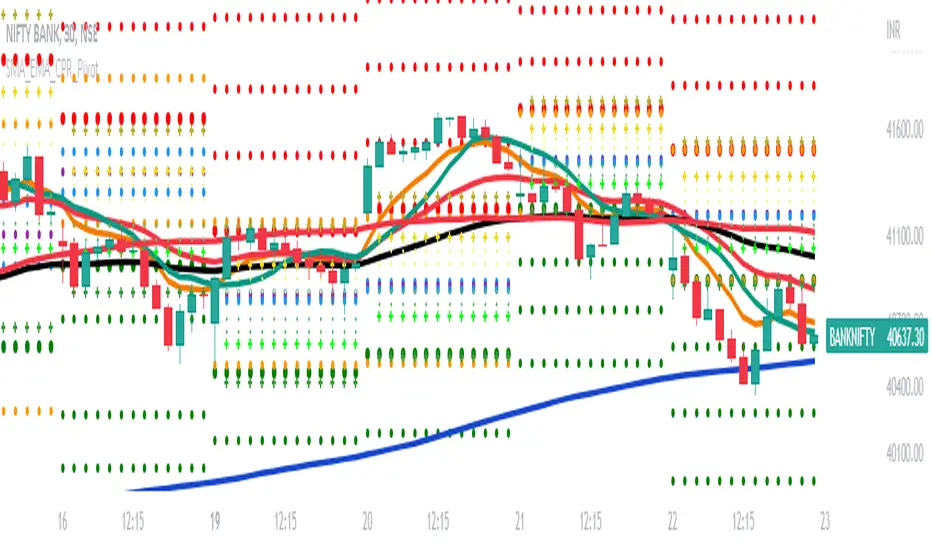
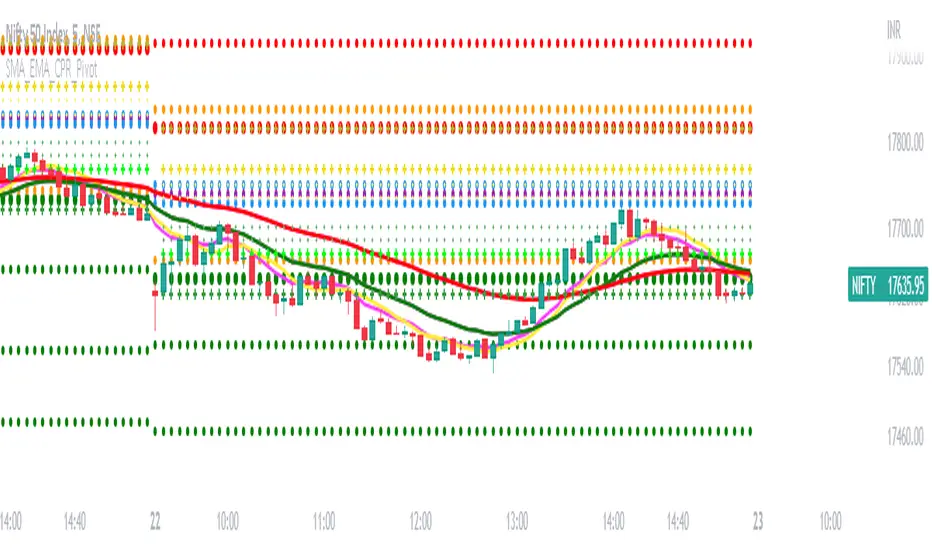
SMA_EMA_CPR_PivotThis Script can do multiple jobs in single indicator.
Like -:
Plot 3 SMA as per your inputs.
Plot 3 EMA as per your inputs.
Plot CPR Levels.
Plot Pivot Levels.
Plot Previous Day High Low.
Indicator can used in Intraday stock trading, Positional Trading and options trading.
Please Enjoy.
CPR with MAs, Super Trend & VWAP by MackraniThis script will allow to add CPR with Standard Pivots and 4 Indicators.
Standard Pivot has 9 levels of support and 9 levels of resistance lines. It has CPR , 3 levels of Day-wise pivots , 3 levels of Weekly pivots and 3 Levels of Monthly Pivots .
In Addition to the CPR and Pivot , this script will allow user to Add 4 more Indicators - SMA , EMA , VWAP and SuperTrend as well.
All the Support and resistance levels can be enabled / disabled from settings. It will allow to select multiple combinations of support and resistance levels across 3 levels at any of the 3 time-frames individually and combined.
All 4 Indicators can be can be enabled / disabled from settings. This will allow the indicators to be plotted individually and combined along with any combination of CPR & Pivots .
These number of combinations will allow user to visualize the charts with desired indicators, pivot support & resistance levels on all or any of the 3 time frames.
For Ease of access, listed few points on how the script works..
- CPR and day-wise level 1 & 2 (S1 & R1) enabled by default and can be changed from settings
- Day-wise Level 2 & 3 (S2, R2, S3 & L3) can be enabled from settings
- Weekly 3 levels and Monthly 3 levels can be enabled from settings
- CPR & pivot levels colored in blue lines
- All support levels colored in Green
- All resistance levels Colored in Red
- Day-wise pivot , support & resistance are straight lines
- Weekly pivot , support & resistance are cross (+) lines
- Weekly pivot , support & resistance are circle (o) lines
- SMA , EMA , VWAP and SuperTrend Enabled by Default
- SMA Colored in Orange
- EMA Colored in Red
- EMA Colored in Teal
- SuperTrend Colored in standard Red & Green with triangle arrows
- Any combinations can be selected from settings-> Inputs & style

SMA_EMA_CPR_PivotThis Script can do multiple jobs in single indicator.
Like -:
Plot 3 SMA as per your inputs.
Plot 3 EMA as per your inputs.
Plot CPR Levels.
Plot Pivot Levels.
Plot Previous Day High Low.
Indicator can used in Intraday stock trading, Positional Trading and options trading.
Please Enjoy.
CPR PRICE ACTION TODAY AND TOMMOROWThis script is based on the Secret of Pivot Boss book by Frank Ochoa. Suitable for Intraday Trading.
You can view the Daily timeframe CPR / support/resistance.
You can view the Weekly timeframe CPR / support/resistance.
You can view the Monthly timeframe CPR / support/resistance.
You can also view Previous Day High/Low.
You can also view Previous Week High/Low.
You can also view Previous Month High/Low.
You can also turn it on/off as per your wish.
IPB_JPMUPS_2022Introduction :
This indicator serves two purposes
a) It is a multi dimensional floor pivot indicator, which takes its concepts from Secrets of Pivot Boss book of Frank Ochoa. Most of the indicators suggested in the book are packed in one indicator.
b) It also has an inbuilt intraday strategy which identifies trend, direction and momentum based on CPR (Central Pivot Range) concepts and accordingly comes up with trading signals.
How this indicator is different from the published ones :
A). Role as an indicator
This indicator has all the CPR (Central Pivot Range) indicators packed together which provides a ready made solution for CPR based trading. The following are the salient features of this indicator :
1) This indicator plots daily CPR using previous day high, low and close. It also plots Support and Resistance levels based on floor pivots formula.
Moreover, it also plots developing CPR which is based on current day's high, low and close. Apart from that it also plots CPR for next day session as well which is useful for EOD analysis.
2) This indicator plots weekly CPR using previous week high, low and close. It also plots developing CPR which is based on current week's high, low and close.
3) This indicator plots monthly CPR using previous month high, low and close. It also plots developing CPR which is based on current month's high, low and close.
4) This indicator plots pivot EMA which is called PEMA. It uses three different EMAs which are customisable and uses them to plot a moving average web based on pivot points of each candle, which is called as PEMA. This also facilitates PEMA plotting for higher time frame (daily time frame) as well.
5) This indicator plots daily time frame moving average in intraday chart which can be used as a key zone during trading. The period is customisable.
B) Role as a strategy
This indicator also functions as an intraday trading strategy called JPMUPS (JP stands for author's nickname. MUPS stands for Manoj Ultimate Pivot Strategy). This strategy attempts to identify trend, direction and momentum and when all these three align together it gives buy and sell signals. The concepts are as under:
Trend identification :
Whenever a trend is established, the developing CPR starts to widen. Hence this strategy uses the width of the developing CPR and compares it with the MA of the width to identify the trend. If the width of the developing CPR crosses the 34 period MA (can be customised), it assumes a trend is developing.
Direction identification:
Whenever a direction is established, the CPR components, namely BC and TC shifts its position. Hence this strategy uses this concept to identify the direction. It computes MACD sort of histogram of the BC and TC difference and whenever the histogram slops upwards, it assumes bullish direction and vice versa.
Momentum identification :
Whenever momentum is established, the developing CPR starts sloping upwards. Hence this strategy uses this concept to identify the momentum. It computes RSI of the developing CPR and if the RSI is above the 34 period MA (can be customised) of RSI , it assumes momentum is establishing and vice versa.
When all the above are aligned together, it gives buy or sell signals suitably.
How to use it :
a) Indicator usage :
1) CPR zones are key zones which predominantly acts as support and resistance zones. Looking at the price action at these zones, one can look for trading opportunities in live market.
2) Developing CPR acts as pull back zones and is very useful in live trading and also EOD analysis for spotting opportunities by combining price action.
b) Strategy usage :
1). Strategy signals are only indicative. Users are strongly advised not to use the strategy blindly. Users are advised to go though the CPR concepts thoroughly and use this strategy signals only as a supplement for further decision making / analysis.
Markets meant for :
1). This indicator and Strategy is predominantly designed for I ndian stock markets . However it can be customised for other markets as well by changing the timings of the markets in the parameters.
Market conditions meant for :
1). This indicator is meant for all types of market conditions as its predominant role is to plot the key support and resistance zones using CPR concepts.
2). The strategy is mainly found to be effective in trending markets and predominantly indices like Nifty and Bank Nifty . Hence Users are advised to use this only as an indicative feature and not blindly trade based on signals. The strategy is found to be less effective in lower time frames like 1min / 3min, etc. 15 min time frame provides fair performance. However it doesnt mean that it will continue to perform in the same manner in the future.

ViVen - EXP - Signals with AlertsHi Friends,
Here the trading made easy with Signals...
The main purpose of this indicator is to identify the Support and Resistance levels well in advance to make ourselves ready for the Entries with confidence..
With this indicator we will be able to identify the Market Structure and Trend to initiate our trades.
Multi Timeframe Concepts are considered in some cases to capture the Golden Zones.
Details of the Indicator:
Method of Trading – Intraday, Positional or Swing – Indices, Stocks and Commodity Markets
Golden Zones : When two or more indicator levels are confluences at one price point which will act as Strong Support and Resistance in the Market. That is called Golden Zone.
CPR & Pivot (Daily / Weekly / Monthly) – Based on the previous Timeframe values, it will automatically calculates the Support and Resistance values for the upcoming Sessions.
BUY / SELL Levels (W-Refers the Weekly levels) – Possible Reversal in the market we can expect at this price level. Depends on the Time frame (Daily/Weekly)
Bull BO / Bear BO (W-Refers the Weekly levels) – Possible Breakout level, If breakout happens price will move to reach the Target 1 and 2 Points based on which side the price breaks ( BULLISH / BEARISH ). We can initiate our BUY/SELL Entries.
Target 1 & Target 2 – Once the Price breaks the Breakout (Bull BO / Bear BO) levels, it will try to reach the Target Points where we can book our profits.
Tomorrow Levels - This will help us to enable the next day trading session Support and Resistance Levels in advance to do pre-analysis to prepare for the Entry and Exits.
Colored Candles : Lime Green and Violet colored candles will indicate the Possible Trend Reversals.
Triangles : Orange and Violet triangles will indicate the Confirmation of Trend Reversal.
BUY / SELL Signal – Considering the momentum and the Trend change it will suggest the possible entry time.
Dashboard :
1. Weekly Trend : This will indicate how the current week trend is going to be – Trending / Sideways
2. Today – Current Session expectation in the Market ( Bullish / Bearish )
3. Sentiment – Indicates the Traders mind set (Positive/Negative Side)
4. Range - This will indicate how the current Day trend is going to be – Trending / Sideways
5. MB / MA Trend – This identifies the major trend (Is the Stock / script in Up Trend or Down Trend)
6. Other Parameters – Will indicates the present situation in the market
7. RSI Values – This is to know and understand the momentum of the particular script
Levels Name Explanations:
1. DPP – Daily Pivot Point
2. WPP – Weekly Pivot Point
3. WTC – Weekly Top Central Pivot
4. WBC – Weekly Bottom Central Pivot
5. PDH – Previous Day High
6. PDL – Previous Day Low
7. PWH – Previous Week High
8. PWL – Previous Week Low
9. PMH – Previous Month High
10. PML - Previous Month Low
11. WR1, WR2 – Weekly Resistance Levels 1 & 2
12. WS1, WS2 – Weekly Support 1 & 2
13. 5m 200 EMA – 5 Minutes 200 Period Exponential Moving Average
14. 15m 200 EMA – 15 Minutes 200 Period Exponential Moving Average
15. 1H 200 EMA – 1 Hour 200 Period Exponential Moving Average
16. 1H 200 SMA – 1 Hour 100 Period Simple Moving Average
17. 1D 200 EMA – Daily TF 100 Period Exponential Moving Average
Settings:
To turn ON and OFF any of these levels if it does not require, Go to Indicator Settings and disable the specific levels.
Alerts:
You can enable the Buy / Sell signal Alerts by creating new alert.
To Access the Indicator:
If you want to know more about the indicator & to access for your trading please check the link in the signature below.
If you have any doubts please mention it in the comment section.
Looking forward your valuable comments and feedbacks to improve further in accuracy of our Trading.
Thanks!!
