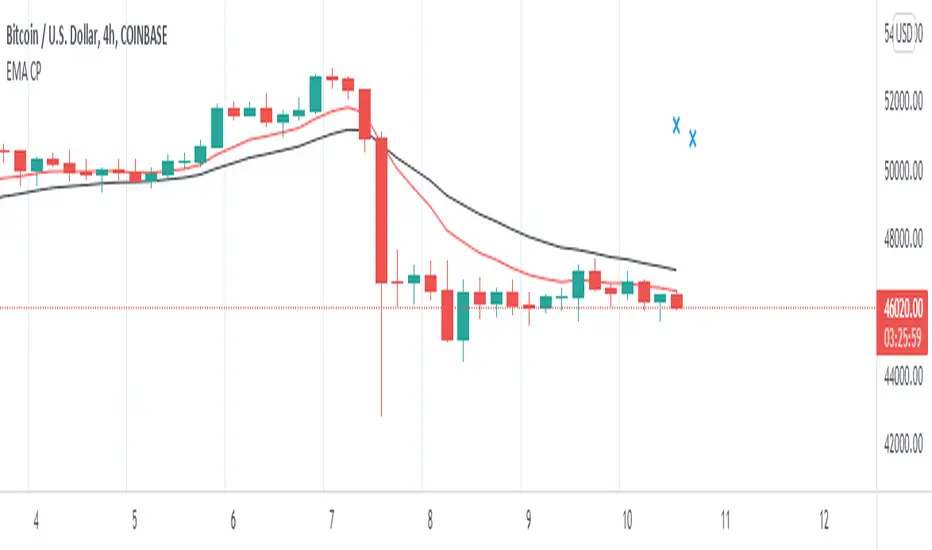
2 EMA Meeting PointThis script will calculate when the next candle needs to close for the moving averages to cross .
If you use EMAs that are far away, the convergence point may be ridiculously far away from the chart. I recommend using ' Scale Price Chart Only ' with this script.
I think you can use this to organize your watchlists if you trade crossovers. If your cross is completely out of the chart, its symbol can be down below, because the cross is unlikely to happen in the next candle.
Good luck!
Ema-cross
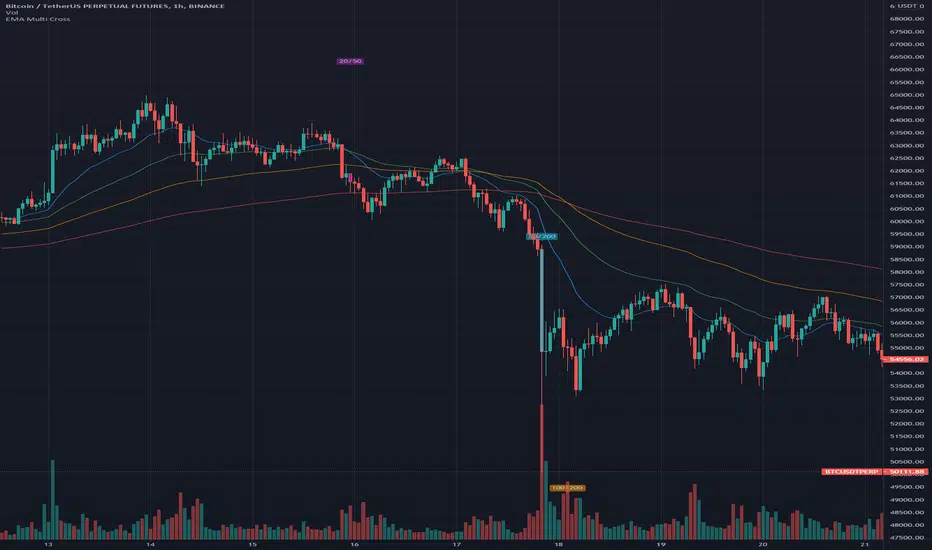
EMA Multi CrossThis is just a very simple EMA indicator that shows the 20, 50, 100, and 200 Exponential Moving Averages and plots some shapes when the lines cross from the 20 & 50, the 50 & 200, and the 100 & 200.
I know there are many EMA indicators out there, but I couldn't find one that let me edit the colors, values, and toggle the crossings. Maybe some of you will find usefulness in having some of these extra options too.
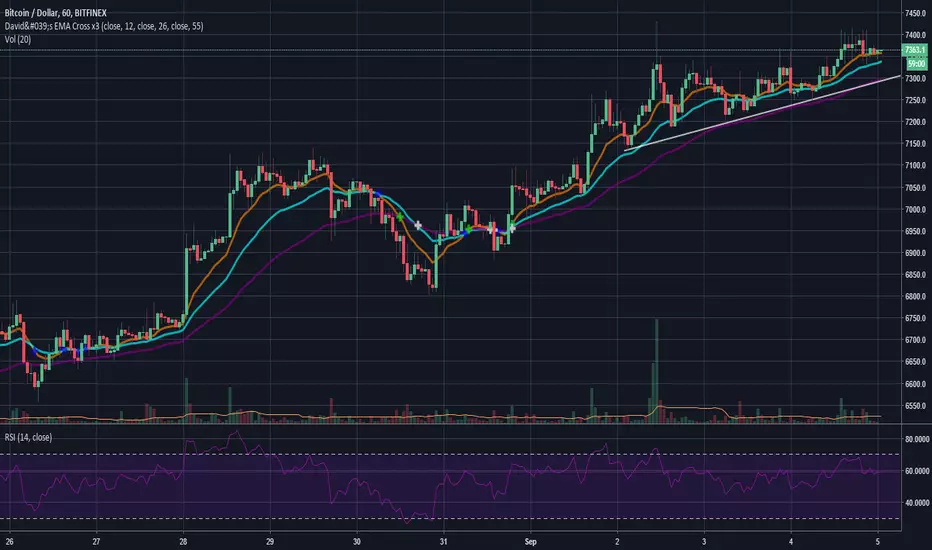
I use this occasionally on the Bitcoin 1 hour charts to see how the long-term trend is going.
Here are some ways to read EMA lines:
Slope: A rising moving average generally reflects a rising trend, while a falling moving average points to a falling trend.
Crosses: Seeing when a slower moving average crosses over/under a faster moving average can be an indication of a trend. If a shorter moving average remains above the longer moving average after they cross, the uptrend is considered intact. The trend is seen as down when the shorter moving average is below the longer moving average.
I prefer the slope of the two since crosses can cause some false positives if you are relying on it for trades.

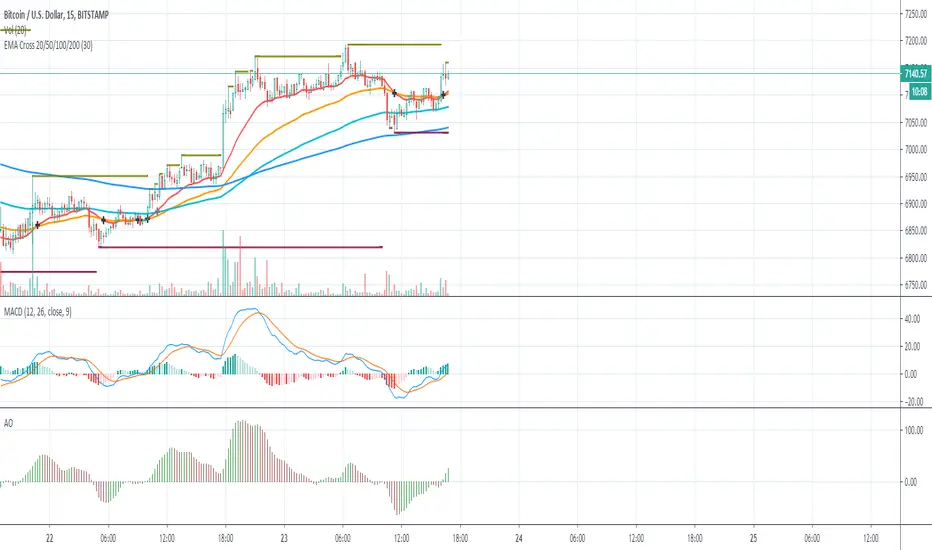
EMA Cross 20/50/100/200EMA Cross 20 50 100 200
Easy identify cross between 20 and 50
Easy identify cross between 20 and 100
Cross between 20 and 50 is good signal for buy and sell.
Cross between 20 and 100 is confirmation signal for buy and sell.
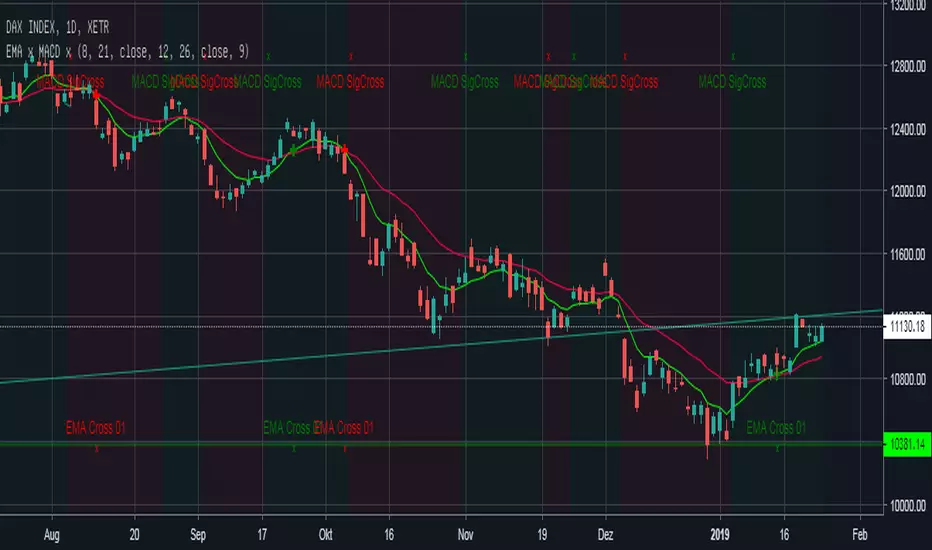
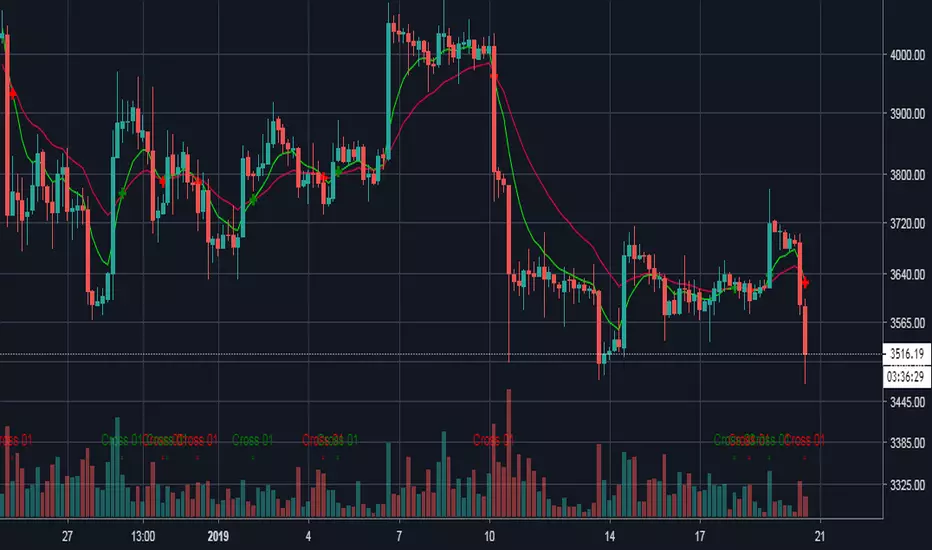
EMA Cross + MACD Signal Cross overlay Einfacher EMA-Cross Indikator mit Indikation der Crosses auf EMA-Linie und am Chart-Bottom +
MACD-Cross wird default an: location.top angezeigt zusätzlich zeigt die Hintergrundfarbe an ob der MACD über (grün) oder unter (rot) seinem Signal liegt.
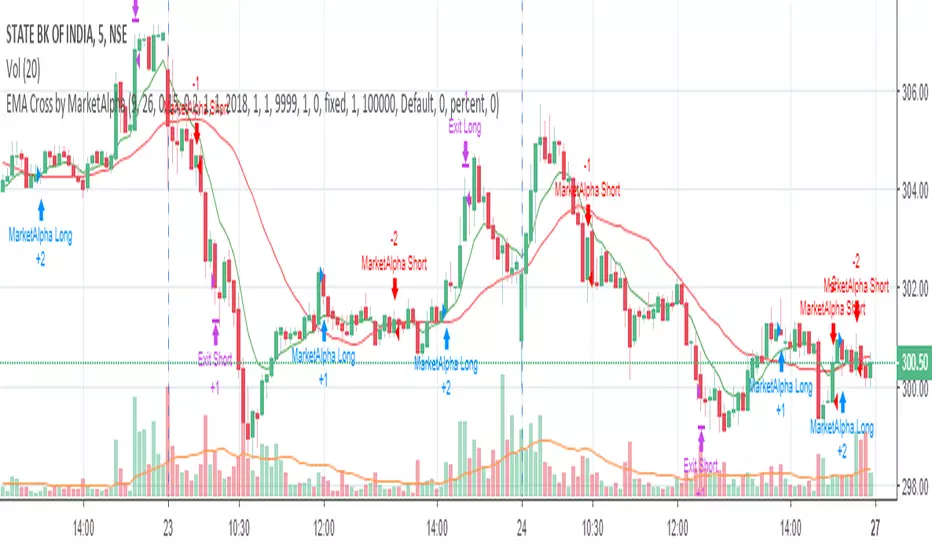
EMA Cross by MarketAlphaSignals are generated when EMA(FastLength) and EMA(SlowLength) cross each other.
Below are the additional user parameters:
1. User defined backtesting period
2. User defined Target and StopLoss percentage points
EMA_Cross_Trading_JHVer3.0
- EMA14 and EMA50 Cross detection
- HA 1st profit taking
- Overshoot detection
- Candle shape and Wick analysis

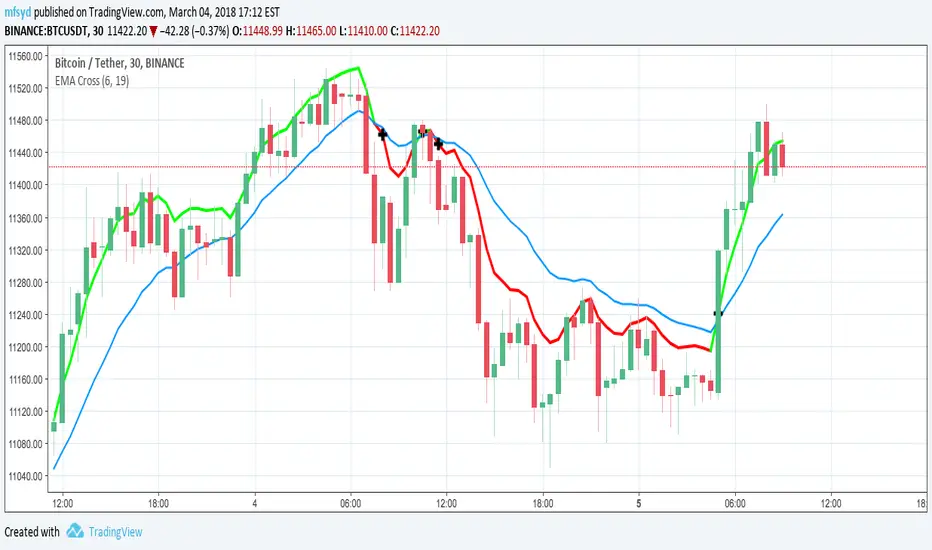
EMA CrossA single Indicator that has two EMA inputs (currently using 9, 16 for my crypto trading)
On a cross the color of the Fast movign EMA changes , and a cross gets indicated at the cross point.
This can then be used to set alerts moving up and down