Fibonacci Retracement (S)-Silver
The Automatic Fib Retracement - Silver -0.24% script indicates the 50-61.8% pullback region.
The lines of the upper and lower pivots, the support and resistance areas are also highlighted.
Customisable Fib Length - Time period over which max and min pivots are chosen.
Offsetfib - Automatically offsets the pivots and sell zone as your entry position
will be some time after the upper and lower pivots are set.
Works well when used in combination with an oscillator which highlights Divergence.
A strategy based off buying the 50-618 with a defined stop loss and target can be the basis of your strategy.
This tool will automatically plot those points but a defined Risk Management strategy will always be needed.
Works best in Bearish trends but will work on all timeframes (Bearish correction in an uptrend also possible).
Previous pivots shown but be careful to identify which of the several pivots you are using.
Start at a larger timeframe and move down. (Entries consistent on several timeframes are golden)
Pivots and retracements are dynamic. Be sure to note your entry and targets.
Entry

Fibonacci Retracement (L)-BronzeThe Automatic Fib Retracement - Bronze script indicates the 50% pullback line and upper 50% region.
The lines of the upper and lower pivots, the support and resistance areas are also highlighted.
Customisable Fib Length - Time period over which max and min pivots are chosen.
Offsetfib - Automatically offsets the 50% region and pivots as your entry position
will be some time after the upper and lower pivots are set.
Works well when used in combination with an oscillator which highlights Divergence.
A strategy based off buying the 50% with a defined stop loss and target can be the basis of your strategy.
This tool will automatically plot those points but a defined Risk Management strategy will always be needed.
Works best in Bullish trends but will work on all timeframes (Bullish correction in downtrend also possible).
Previous pivots shown but be careful to identify which of the several pivots you are using.
Start at a larger timeframe and move down as necessary.
Pivots and retracements are dynamic. Be sure to note your entry and targets.

MadLad v0.01 (Buy/Entry Signals)This script is a very rough, very early release of a project called madlad (www.twitter.com).
Currently being used on BITSTAMP:XRPUSD 5 Min Heiken Ashi.
It's a very early concept. It is also very aggressive , therefore it spams buy signals. The buy symbols do not mean enter, they are simply potential entry points.
You can see this especially during heavy drops, I would generally wait for the end of the shading to make an entry. Aqua shading is simply confluence with another indicator.
Feel free to mess around with some of the settings, however most are just placeholders and do little to nothing.
I will eventually update this to remove some of the spammy buy signals. If you use this with some other indicators, it will definitely help remove a bit of the spammy-ness.
In the meantime though, if anyone is able to come up with their own solutions on avoiding bad trades while using the "buy" signals, feel free to DM me and or post in the comments.
Follow www.twitter.com
There we will be posting updates and entry/exits in realtime! For free, no signal group BS or anything, this comes at the cost of signals not always being correct so always trade at your own risk!

VWAP Anomaly V1I made some late reading yesterday and discovered the importance of the VWAP indicator, above all the idea that when the current price exits it it will always bounce back. Therefore I decided to build an indicator which detects when the current price escapes the VWAP margin. The indicator shows this three things:
1) When the current price exits the VWAP margin.
2) The strength of a VWAP trend
3) VWAP bounce point (Blue dots which can be used as support or resistance)
By using the VWAP Anomaly V1 indicator, you can know if you find yourself in a reversal zone, and get a great entry point. Please, do have in mind no indicator is perfect, by using other indicator with the VWAP Anomaly Indicator your chances of success increase by a significant level. NOTE: Follow my predictions under your own risk

MM-Burj Khalifa IndicatorThis indicator uses several signals to visualize a "perfect candle" to enter a trade.
It colors the background to identify the zones of interest (multiple configurable high or low RSI zones). Underlying is a trendbar with the current MACD direction.
The indicator is using signals of:
--MACD
--RSI
--PVT
--ATR
--AD and DMI+/DMI-
When all 7 criterias are met it highlights the candle.
It also creates different colums with different height and width, so that you can see which signal is OK and which is maybe missing. When all signals are on GO you'll see a Burj-Khalifa-like figure. If not all signals are on GO you'see crippled versions.
To be clear:
it's not intended to detect trends or supertrends or reversals. It's purpose it's just to decide if this current candle is really going in the right direction.
The Burj-Khalifa indicator could help to confirm the entry point of an trade which was already planned.

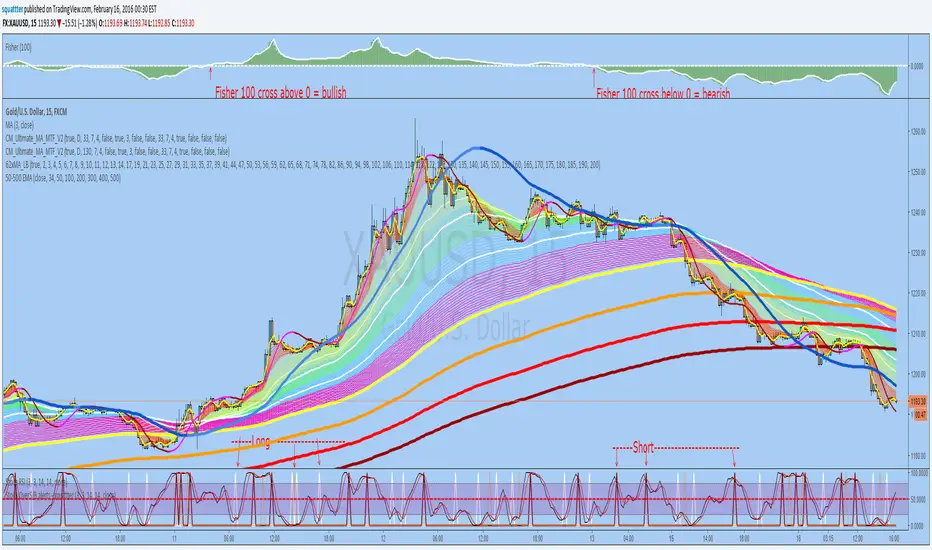
StochRSI overSold/Bought alerts - by squattterDepending on the new trend - Fisher 100 crossing 0;
Set an alert on each Long/Short "crossing down", 0.8 (or anything below 0.99), "on condition"

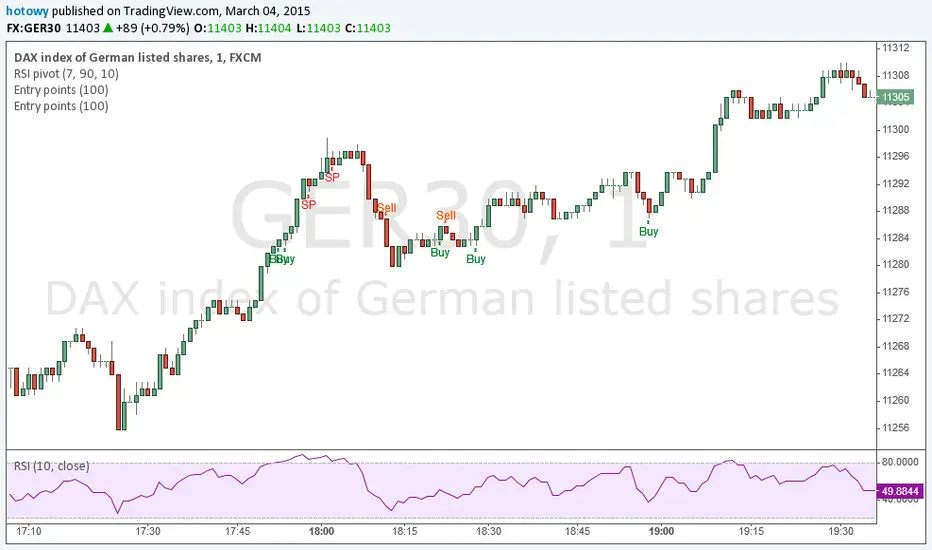
Entry pointsThis great and simple indicator based on EMA generates information about entry points at close of the candle. First signal is the best entry point but you can re-enter at the next. IMPORTANT: this script does not generate exit signals and those shoud be find using money management rules or else. Perfectly catches long runs in trends at all underlayings (forex, stocks, indexes, commodities) at all timeframes. Period=100 works best independently on timeframe but I encourage you to try other. Lower period gives more incorrect signals and shorter runs, higher period gives you late entry and less. Ofcourse it gives false signals from time to time but fortunately it makes a correction very fast. Try it! Good luck and good traiding!