Volume ExternalShows the volume of a specified exchange and pair. They should be entered in the format EXCHANGE:PAIR, e.g. BINANCE:ETHUSDT.
You can add multiple indicators of this to do volume analysis of multiple pairs on the same chart.
Exchange

VolumeChart BTC Volume Powered by BotBoys [v09/11/2018]Btc global volume by volumeChart team (BotBoys).
Takes volumes of all exchanges with BTC.
It includes Europe, EEUU, Asia and South-America.

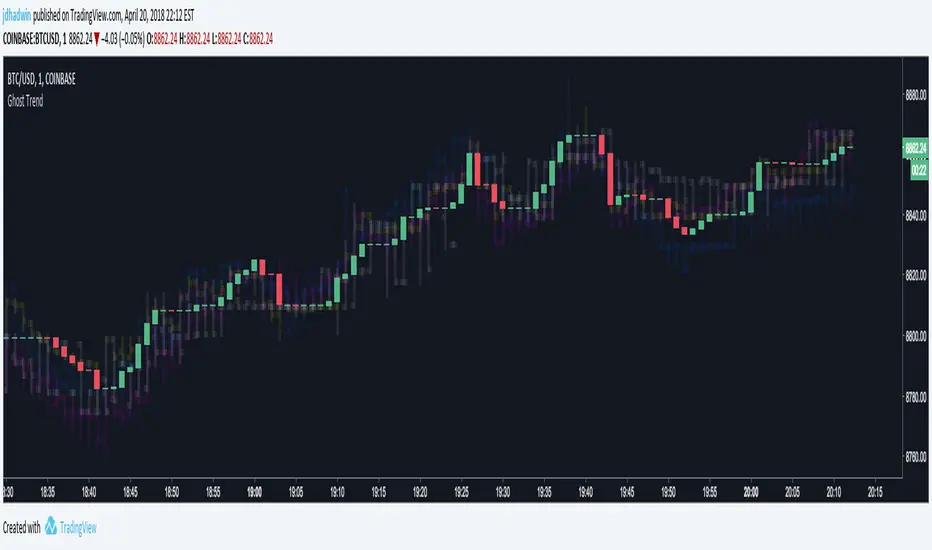
Ghost TrendUse ghosted charts from multiple exchanges to visualize global market trends for your trading pair BEFORE the trend comes to your exchange. Use Ghost Averaging to find what Bitcoin is ACTUALLY doing across up to four exchanges, by averaging all four exchanges into a single ghost. As for the name, Ghost Trend just sounded way cooler than Arbitrage Helper!
Hone your skills and you may even find yourself able to avoid crashes moments BEFORE they happen, or able buy right BEFORE a take-off. Ghosts sometimes show moves earlier than the exchange you're using. But be careful, sometimes ghosts are nasty little deceivers 8o
Instructions:
First time ghosting? Start out with a 1 minute Bitcoin chart on Coinbase ( ), then check out the Ghost Trend settings.
Start small, pick just one alternate exchange (say Bitfinex ) and play with the Ghosted Open/High/Low/Close settings. Certain combinations will display bars by default, others will display plotted lines. Make it work for you.
Next, pick a second exchange and you'll see a second ghost. Now comes the fun part. Click "Average Ghosted Pairs". Now you're looking at the two averaged together. You can even average Coinbase back into the Ghosted Average if you want. Add up to four, and most importantly, have fun.
DON'T FORGET TO SET THE CORRECT CHART RESOLUTION!!! Everything goes haywire if you mismatch Ghost Trend's resolution with your current chart.
Lots of fun to be had on the 1 minute chart, but it's especially useful to use Ghost Averaging with Open and Close unchecked and High and Low checked, when on greater resolution charts. ;) Happy arbitraging!
If you'd like to incorporate Ghost Trend into your script, you know where to find me.
~jdhadwin
BTC World Volume (Multi-Exchange)Release: 2018-03-29
__________________________
WHAT IT DOES
Bitcoin is listed on multiple exchanges. Many people have called for a single global index that would quote BTC volume across all exchanges: this script is such a virtual volume aggregate of the 17 largest fiat exchanges on TradingView (listed in the script comments, and in Format > Inputs for you to select). It includes USD, EUR, JPY, KRW and USDT sources.
It will, independently for each tick, quote the volume from all selected exchanges and display a stacked representation, freely inspired from CoinMarketCap charts; also a Moving Average. Each fiat/continent has its own general color, to be able to quickly glance at where volume is coming from, e.g. BitMEX or Asia. (colors are based on Google's Material Design).
By default:
Grey: BitMEX
Green: USD
Yellow: Tether (USDT)
Red: Asia (JPY, KRW)
Blue: Europe (EUR)
No more "on Coinbase this" or "on Bitstamp that", you've now got a global overview! It becomes easy to debunk a few common myths.
See CoinMarketCap for reference.
Note: Bitmex is not taken into account in CoinMarketCap (afaik) since it's trading a derivative asset (XBTUSD contracts), but it usually amounts to ~50% of the overall BTC volume in USD value. The 16 other exchanges quote their volume in BTC, and they represent 30~40% of the overall BTC volume. I believe the whole is good enough to smooth out exchanges variations, and get a fair representation of real-time activity.
__________________________
HOW TO USE IT
Just add it to your chart, it will appear as a separate indicator. By default, it appears as stacked colored "areas". There is also a total volume Histogram, which is transparent by default: you can tweak that in Format > Style.
The darker and lighter backgrounds are respectively indicative of a downward price candle (open > close), or an upward price candle (close > open). They are unrelated to volume and simply help interpreting the indicator.
You can check/uncheck exchanges in the Format > Inputs tab to remove/add some of them from computation. All are enabled by default.
You can check/uncheck exchanges in the Format > Style tab to hide them (usually you would hide all or none).
You can edit colors and transpareny as well for each exchange.
You can edit "Volume histogram" transparency to have it show (it's a simpler representation than areas).
Moving Average: You can select the type (SMA, EMA, DEMA or TEMA) and length.
__________________________
Please leave feedback below or pm me directly for bugs and suggestions.

BTC World Price: Multi-Exchange VWAPBTC World Price: Multi-Exchange VWAP
__________________________
WHAT IT DOES
What you see above are not Bitmex candles, but this indicator's.
Bitcoin is listed on multiple exchanges. Many people have called for a single global index that would quote BTC price and volume across all exchanges: this script is such a virtual aggregate (formerly: Multi-Listed , Volume-Weighted Average Price ).
It will, independently for each tick, for any time-frame:
- Quote the price (O, H, L, C) and volume from Bitfinex (USD), Binance (USDT), bitFlyer (Yen), Bithumb (S. Korean Won), Coinbase (USD), Kraken (EUR) and even Bitmex (USD Contracts).
- Weight each price with the corresponding volume of the exchange.
- Quote the FOREX conversion rate in USD for each currency (USDJPY etc.)
- Finally return global average price (candles) in USD.
- Additionally provide (H+L)/2 etc. values.
No more "on Coinbase this" or "on Bitstamp that", you've now got a global overview!
See CoinMarketCap: Markets for reference. I've included alternative exchanges in the comments at the top of the script.
__________________________
HOW TO USE IT
Basically just add it to your chart and use the indicator's candles instead of the chart's main ticker.
By default, BTC World Price will display candles only, but you can also display OHLC & averages (in whichever style you want).
You may indeed want to hide the main symbol (top-left corner, click the 'eye' button next to its name), or switch it to something else than candles/bars (e.g. line).
Make sure "Scale Price Chart Only" is disabled if you want to use the auto-zoom feature. (if other indicators are messing your zoom, you can try to select "Line with Breaks" or "Area with Breaks" to allow these to overflow from the main window)
By clicking the triangle next to the indicator's name, you can select "Visual Order" (e.g "Bring to Front").
You can select regular Candles or Heikin-Ashi in Options.
In the Format > Inputs tab, you can select which exchanges to quote. By default, all of them are enabled.
The script also exposes the following typical values to the backend, which you can use as Price Source for other indicators: (e.g. MA, RSI, in their "Format > Input" tab)
Open Price (grey)
High Price (green)
Low Price (red)
Close Price (white)
(H + L)/2 (light blue)
(H + L + C)/3 (blue)
(O + H + L + C)/4 (purple)
They are all hidden by default (by means of maximum transparency).
In the Format > Style tab, you can change their color, transparency and style (line, area, etc), as well as uncheck Candles and Wicks to hide these.
If you are using "Indicator Last Value" and want to clear the clutter from all these values, simply uncheck them in Style. They will still be available as Price Source for other indicators.
You can also choose to scale it to the left, right (default) or "screen" (no scaling).
Once you're satisfied with your Style, you may click "Default"> "Save as default" in the botton-left. Everytime you load the indicator, it will look the same. ("Reset Settings" will reset to the script's defaults)
__________________________
Please leave feedback below in comments or pm me directly for bugs and suggestions.

Simple Spread Simple spread between two tickers. Click format to set inputs for tickers. ex: "COINBASE:BTC:USD"

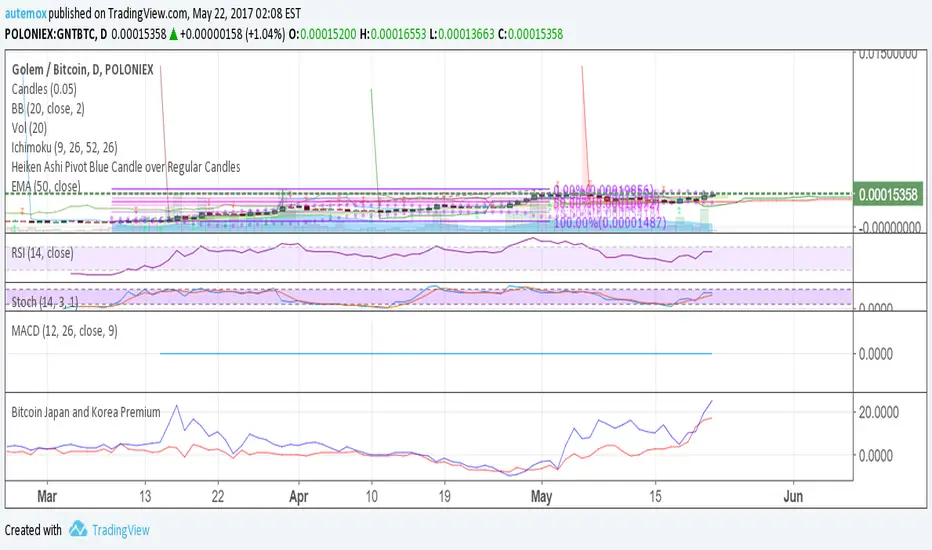
Bitcoin Japan and Korea PremiumRed line is the % premium to buy bitcoin in Japan. Blue is the % premium to buy bitcoin in korea.
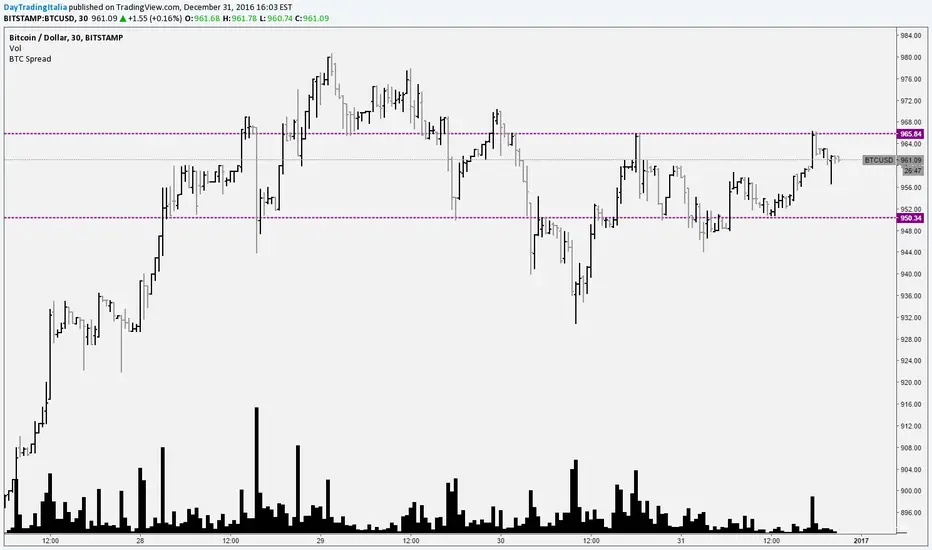
Bitcoin SpreadIt selects the min/max price for btc/usd from a set of exchanges and shows them on the chart. It is possible to add or remove exchanges by editing the source code
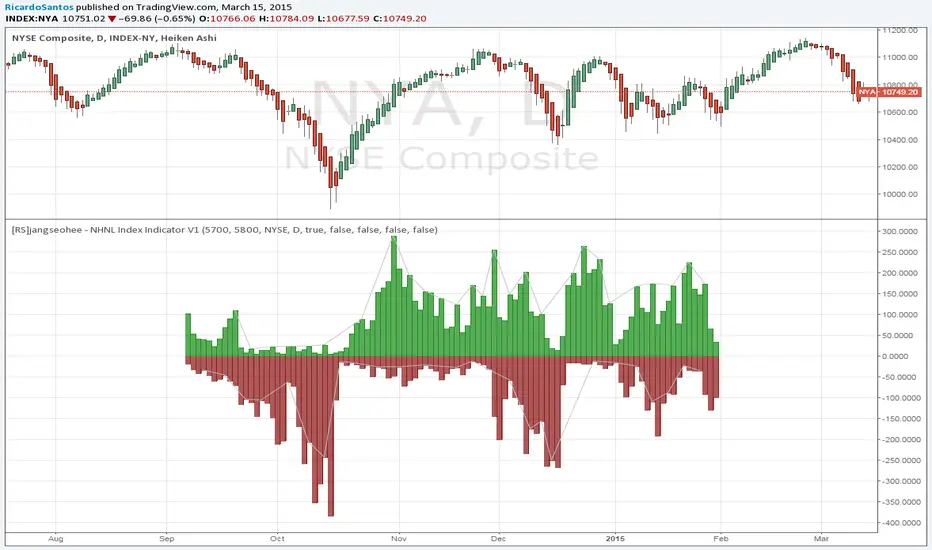
[RS]jangseohee - NHNL Index Indicator V1request for jangseohee: added option for different exchanges, added option to remove data before X point and after Y point in time using candle numbers.