[longshorti] Auto Fibonacci Grid (Long/Short) 🌟 Auto Fibonacci Grid (Long/Short) — Smart Retracement Tool
The Auto Fibonacci Grid (Long/Short) is an advanced trading utility designed to automate the process of identifying key Fibonacci retracement levels for both bullish and bearish swings. This indicator provides traders with precise zones for potential entries during market corrections.
✨ Key Features and Originality:
True Auto-Detection: The script automatically analyzes the market impulse within the lookback window to determine if the current grid should be calculated for a Bullish (Long) or Bearish (Short) scenario.
Impulse Filtered Alerts: A custom alert system triggers only when the price enters your designated key zone and when the underlying market impulse exceeds a user-defined Minimum Impulse Percentage. This is crucial for filtering out false signals generated by weak, consolidating movements.
Dynamic Correction Zones: Define any range of Fibonacci levels (e.g., 0.5 to 0.618) to be highlighted as your Key Zone (Buy or Sell Zone), with dedicated color schemes for Long and Short setups.
Visual Tracking: Fills between levels dynamically change color to indicate the impulse direction and track which zones have already been successfully tested by the price action.
🧠 How It Works:
The indicator scans the last N bars (Fixed Window Lookback) to identify the Low and High of the swing. It then compares the bar indices to determine the final direction. The calculateFibPrice function internally adapts to project correction levels from the High down (for Long) or from the Low up (for Short), ensuring the grid is always applied correctly to the impulse.
⚙️ Settings Overview:
The script includes comprehensive settings for:
Grid Mode: Auto Detect, Force Bullish, or Force Bearish.
Impulse Filter: Set the minimum percentage (0% = Off) required for alerts to trigger.
MFI/RSI Settings: Used for additional signal confirmation (internal logic).
Display & Style: Full control over line colors, fill colors, and text sizes.
Fibo

Dynamic Pivot Fibonacci v1.3Advanced Fibonacci Levels & Time Zones
This indicator provides a comprehensive suite for Fibonacci analysis, focusing on both price and time. It is designed for technical analysts who require a highly configurable tool to identify key levels of support, resistance, and temporal market rhythm.
📊 Core Price Level Features
The indicator's primary function is to draw Fibonacci price levels based on one of two user-defined calculation methods:
Pivot-Based Calculation: Automatically detects high/low pivot points using configurable Pivot Left and Pivot Right lookback periods.
Memory-Based Calculation: Identifies the highest high and lowest low over a specified Memory Length (lookback period).
🎨 Display & Customization
13 Configurable Levels: Users can enable, define, and color up to 13 distinct price levels.
Background Fill: Optional color filling between levels for enhanced visual clarity.
Line Extension: Full control over line drawing, including extending lines to the left, right, or both (either indefinitely or for a limited number of bars).
Historical Deletion: Option to automatically delete previous Fibonacci lines when a new range is detected.
⏳ Additional Analysis Tools
Fibonacci Time Zones: Renders vertical time markers based on the Fibonacci sequence, projected from the selected pivot points. This feature is designed to help identify potential turning points in time.
Trend Analysis (SMMA): Includes an optional module to display multiple Smoothed Moving Averages (SMMA) and an aggregate trend line, assisting in contextual market analysis.
🇮🇷 توضیحات فارسی
سطوح پیشرفته فیبوناچی و مناطق زمانی
این اندیکاتور مجموعهای جامع برای تحلیلهای فیبوناچی، با تمرکز همزمان بر قیمت و زمان، ارائه میدهد. این ابزار برای تحلیلگران فنی طراحی شده است که نیازمند ابزاری با قابلیت تنظیمات بالا جهت شناسایی سطوح کلیدی حمایت، مقاومت و ریتم زمانی بازار هستند.
📊 ویژگیهای اصلی سطوح قیمتی
عملکرد اصلی این اندیکاتور، ترسیم سطوح قیمتی فیبوناچی بر اساس یکی از دو متد محاسباتی قابل تعریف توسط کاربر است:
محاسبه مبتنی بر پیوت (Pivot-Based): به صورت خودکار نقاط پیوت سقف و کف را بر اساس دورههای بازبینی (Lookback) قابل تنظیم (Pivot Left و Pivot Right) شناسایی میکند.
محاسبه مبتنی بر حافظه (Memory-Based): بالاترین سقف و پایینترین کف را در یک طول حافظه (دوره بازبینی) مشخص، پیدا میکند.
🎨 نمایش و سفارشیسازی
۱۳ سطح قابل تنظیم: کاربران میتوانند تا ۱۳ سطح قیمتی مجزا را فعال، تعریف و رنگآمیزی کنند.
پُر کردن پسزمینه (Fill): قابلیت اختیاری پُر کردن فضای بین سطوح با رنگ، برای افزایش وضوح بصری.
امتداد خطوط: کنترل کامل بر ترسیم خطوط، شامل امتداد دادن به سمت چپ، راست یا هر دو طرف (به صورت نامحدود یا برای تعداد کندلهای معین).
حذف سطوح گذشته: گزینهای برای حذف خودکار خطوط فیبوناچی قبلی به هنگام شناسایی یک محدوده جدید.
⏳ ابزارهای تحلیلی جانبی
مناطق زمانی فیبوناچی (Fib Time Zones): نشانگرهای زمانی عمودی را بر اساس دنباله فیبوناچی ترسیم میکند که از نقاط پیوت منتخب، پروجکت (project) شدهاند. این ویژگی برای کمک به شناسایی نقاط عطف احتمالی در بستر زمان طراحی شده است.
تحلیل روند (SMMA): شامل یک ماژول اختیاری برای نمایش چندین میانگین متحرک هموارشده (SMMA) و یک خط روند کلی، جهت کمک به تحلیل زمینه بازار.

FV-Fibonacci+vegas# 功能简介
集成斐波那契自动绘制和vegas均线策略。
当前大版本3.0(基于1.0~2.0功能筛选做的精简版本,去除使用性不高功能,后续主要围绕菲薄纳妾功能做优化)
# 斐波那契
- 斐波那契策略主使用斐波回调(0.328~0.618) + 扩展(2~2.618) 重叠给出信号作为买区。
## 核心功能:
- 颈线1突破:告警和信号线标注辅助手动拉斐波那契,也可以设置自动绘制fibo线条和标签
- 目标区2实现:告警和box绘制显示
- 重叠区信号:斐波回调(0.328~0.618) + 扩展(2~2.618) ,其他重叠信号可选
# vegas
- vegas双通道策略:默认使用ema 12/144/169/576/676
## 核心功能:
- ema12收高收低通道:红色(空)蓝色(多)信号v显示和告警
- 单边突破:趋势保持单边趋势突破时显示信号和告警
- 通道支持:潜在通道支撑信号
# 拐点
- 拐点突破信显示号和告警
- 拐点吸铁石:潜在为实现预期黄色标记,失效灰色标记
# 其他
- 敬请探索
---- English version introduction ----
# Feature Overview Integrates automatic Fibonacci plotting and Vegas moving average strategy.
Current major version 3.0 (a streamlined version based on features from 1.0~2.0, removing less useful features; future optimizations will primarily focus on the Fibonacci plotting functionality).
# Fibonacci
- The Fibonacci strategy primarily uses the overlap of Fibonacci retracement (0.328~0.618) + extension (2~2.618) to provide buy signals.
## Core Functions:
- Neckline 1 Breakout: Alerts and signal lines assist in manually drawing Fibonacci lines; automatic Fibonacci line drawing and labeling can also be set.
- Target Zone 2 Implementation: Alerts and box drawing display.
- Overlapping Zone Signals: Fibonacci retracement (0.328~0.618) + extension (2~2.618); other overlapping signals are optional.
# Vegas
- Vegas Dual-Channel Strategy: Defaults to EMA 12/144/169/576/676
## Core Functions:
- EMA12 High/Low Channel: Red (Short) and Blue (Long) signal display and alerts.
- One-Sided Breakout: Displays signals and alerts when a one-sided trend breaks out.
- Channel Support: Potential channel support signals.
# Inflection Points
- Inflection point breakout signals and alerts.
- Inflection Point Magnet: Potentially expected to be achieved is marked in yellow; failure is marked in gray.
# Others
- Please explore.

Fibo RSIThis is a customized Relative Strength Index (RSI) indicator designed to replicate TradingView’s default RSI while adding additional reference levels for deeper market analysis.
🔹 Features:
RSI length set to 8 by default (user adjustable).
Calculates RSI using the standard ta.rsi() function.
Plots the RSI line in a clean, separate panel.
Adds 7 key levels for analysis: 0, 20, 30, 50, 70, 80, 100.
Levels are drawn as thin, solid straight lines for a cleaner look (instead of default dashed).
🔹 Use cases:
Identify momentum shifts with enhanced precision.
Use intermediate levels (20, 30, 50, 70, 80) as potential support/resistance zones.
Ideal for traders who want a Fibonacci-like structure in RSI analysis.

SMC ToolBox [WinWorld]👋 INTRODUCTION
SMC ToolBox indicator is not just a simple indicator, but rather a collection of SMC-related algorithms, that our teams has found to make the most profound impact on determination process of the most high-quality liquidity zones and points of interests ( further – POIs ), hence the name of the indicator – Tool Box (and it also sounds cool :) .
From candle patterns to complex orderflow detection algorithm, ToolBox indicator will help any trader with search for useful tools, solving the needs from confirming position entry levels to trend-following and mean reversion opportunities.
❓ WHY DID WE BUILD THIS?
This indicator was initially built for our team's internal use for the sole purpose of gathering all actively used non-structure-related algorithms* in one place, so we could have only the tools that are truly needed at hand at any point of time. After we showed this tool to our trading partners, they were surprised about how light, fast and useful ToolBox was and they advised us on sharing this with our community and, after giving it a proper thought, we decided to follow their advice.
Funnily enough , after researching TradingView's open-source script library, we haven't found even one instance of even remotely alike indicators, so it fair to say that we are one of the first people to release this kind of SMC-related indicator bundles on the market and we strongly that TradingView's community will find this tool of use.
🤷♂️ WHY SHOULD YOU CARE AT ALL?
Frankly speaking, we are not the first people to build our own algorithms of such popular indicators like Equal Highs and Lows (EQHL), Previous Day High Low (PDHL), Orderflow (OF) and etc., but we are definitely one of the first teams to implement these indicators with the help of algorithms, that are actually used by the most professional traders on YouTube and other social media trading influencers. Simply taking trades from our SCOBs, OFs, EQHLs and etc. won't print you millions overnight, but what these algos will do is help you with being aware of is potentially laying ahead of you with a very clean probability.
Why does it matter? It simple: better market awareness gives you an edge over other trades, which use old algorithms, which are clearly outdated, so beating such traders in the long run is just a game of time for you, so good algorithms do matter. Each indicator inside ToolBox is there to help you develop this market awareness and forge your edge bit by bit.
Now let's talk about what is inside the ToolBox.
🔍 OVERVIEW
At the moment of publishing ToolBox contains 8 indicators, so say "Hello" to:
Price Border Bands (further – PBB) ;
Ordeflow (further – OF) ;
Equal Highs & Lows (further – EQHL) ;
Previous Day High & Low ( further – PDHL) ;
Single Candle Order Block (further – SCOB) ;
Institutional Funding Candle (further – IFC) ;
Engulfing Candle (further – EC) ;
Inside Bars (further – IB) .
Some of them you may know, some of them you may not, so let's review each of them one by one.
📍 INDICATOR: Price Border Bands (PBB)
Price Border Bands indicator is a simple yet useful algorithm, based on Triangular Moving Average (TMA), which helps determine extreme price spikes, which on average act as meaningful mean reversion opportunities. It also is a good an effective "verifier" of POIs and zones of interest (further – ZOI) .
We advise on using this indicator this way:
Look for price going beyond upper or lower band of PBB;
Look for price reaching POI or ZOI;
Start searching for your entry point.
The most common sign of potential price reversal, which PBB searches for, is intense price spike, which signals about "liquidity clearing" or, in simple terms, manipulation .
Manipulation of the price inside the POI or price being "stopped" by POI is a screaming sign of the potentional following reversal. See the example of such situation on the screenshot below:
Additionally we need to talk about trend filter inside PBB, which colours the bars on the chart under certain conditions. If bars on the chart are being coloured in gray – this is your sign to stop trading on this asset? because there is risk to catch an uncomfortably big price spike, which might turn the '+' of your position's PnL in to '-'. See the example of PBB highlighting bar's of risky price zone in gray colour on the screenshot below:
In order to continue trading you need to wait for bars to stop being coloured in gray OR confirm the fact that price made Change of Character (ChoCh) in reverse to the previous direction of price, which was marked as risky by PBB.
And last but not least: if you see POI being reach by price inside the bands of PBB, then consider this POI weak and avoid trading it. See the example of weak POI inside PBB bands on the screenshot below:
📍 INDICATOR: Orderflow (OF)
Orderflow indicator is an algorithm, which detects Sell-to-Buy (furthert – STB) or Buy-to-Sell (further – BTS) manipulations, using the algorithm of impulse & correction price movement detection, taken from one of our previously built indicators – Impulse Correction SCOB Mapper (ICSM) .
Let's explain the terms from above:
Impulse – series of bars, each bar of which consecutively updated previous bar's high and then last candle broke previous bar's low ;
Correction – series of bars, each bar of which consecutively updated previous bar's low and then last candle broke previous bar's high ;
STB – a type of price manipulation, which can be described as a correction of price inside global upward movemnt;
BTS – a type of price manipulation, which can be describd as a impulse of price inside global downward movement.
Unlike traditional order blocks, which are often narrower and more selective, Orderflow zones cover a wider price range and present a higher probability of mitigation. This makes them more reliable for entries in ovaerage in comparison to classic orderblocks.
Let's review examples of bullish and bearish orderflows on the screenshots below:
Bullish orderflows (STBs) (blue boxes with "OF" text inside)
Bearish orderflows (BTSs) (orange boxes with "OF" text inside)
The usage of ZOIs, detected by OF algorithm, is pretty straightforward: take trades against the ordeflow block, that price has reached. Even though we don't recommend relying on Orderflow blocks as sole producers of signals, you can use them as such in way, that can be described like this:
Place stop-loss (SL) beyond the furthest border of OF block (bottom of the bullish OF or top of the bearish OF), that price has reached;
Aim for >2:1 RR ratio and place your take-profit (TP) accordingly.
You can see the example setups of OF blocks as signal producers on the screenshots below:
Examples of LONG trades, taken from price reaching bullish OF block.
Examples of SHORT trades, taken from price reaching bearish OF block.
Summarising, Orderflow can be described as a tool that helps determine the STB and BTS price manipulations, which are great price ZOIs and can be used both as confirmation tools for your exisiting signals and sole signal producers, in which case such they needed to be handled extra mindfully and preferrably bonded with other tools for additional confirmation. We personally recommend using Ordeflow as confirmation tool, because ZOIs, detected by Orderflow, are usually the price ranges, around which traders tend to place their stop-losses, which only gives more strength to these zones for supporting the price and helps traders with "trading from support/resistance" strategies gain additional edge.
📍 INDICATOR: Equal Highs & Lows (EQHL)
EQHL indicator is an algorithm, which scans the extremums of impulse and correction movements, detected by our ICSM indicator , and marks ones which are roughly or equaly placed on the same price levels. Equal highs (further – EQH) and equal lows (further – EQL) are local liquidity pools, where stop orders and resting orders cluster; price often gravitates to these zones for liquidity “top-ups,” after which a reaction or continuation to the next liquidity source may occur. Basically, EQHL algorithm highlights clusters of equal extremes as navigational anchors for “collect → react → confirm” scenarios.
Talking about usage, we advise to not take swept or reached EQHLs as entries by themselves. Evaluate them alongside HTF structure, Inducement (IDM), orderblocks (OB), orderflow (OF), candle pattern context (e.g., IFC/EC) on the LTF and etc. Intended usage scenario of this algorithm is something like this:
Price reaches EQH/EQL;
Price hangs around the reached EQH/EQL;
Another tool (for example, OF or OB) signals about price reversals from the level of reached EQH/EQL;
Trader starts looking for an entry.
See the examples of EQHLs, which algorithms maps on the chart, on the screenshots below:
Equal Lows (EQLs)
Equal Highs (EQHs)
📍 INDICATOR: Previous Day High & Low (PDHL)
PDHL indicator is an algorithm, princples of work of which can be derived from its name: algorithm tracks previous day's high and low and displays it on the chart.
Previous day's high and low are fundamental POIs in any financial market, which are traded not only by SMC traders, but by many other traders, especially by traders, which consider these POIs are one of the most crucial, because they usually highly liquidity-rich and can signal about wondeful reversal opportunities.
We expect traders to use PDHL algorithm as confirmation tool when trading by mean reversion strategies. Usage of PDHL as signal source is advised against, but traders are free to experiment nevertheless.
PDHL algorithm shows two types of PDHLs on the chart: active PDHL (solid line) and swept PDHL (dashed line) . You can the examples of PDHLs, detected by our algorithm, on the screenshot below:
📍 INDICATOR: Single Candle Order Block (SCOB)
SCOB indicator is an algorithm, which marks a very specific POIS, which are based on of the most simple yet highly profound SMC and candle pattern principles and are usually a good alternative for classic orderblocks.
Principles of SCOB detection are very simple:
Price sweeps previous candle's extremum (high/low). So called "liquidity sweep" ;
Immediately after step 1 price forms a fair value gap (FVG).
You can see basic examples of bearish and bullish SCOBs on the screenshot below:
As a matter of fact, SCOB can be used both as a confirmation tool and source of signals. However! To be a source of signals, SCOB is most suitable to be used while trading on lower timeframe (LTF), while trading on a higher timeframe (HTF) on average requires to look at SCOB as a POI rather than as independent source of signals. That being said, we would like additionally to point out, that due to the nature of SCOB being an orderblock, this tool by its nature is best suitable as confirmation tool and we expect traders to use it as such, but either way this indicator is quite multifunctional and can be used by each trader for a more specific purposes.
SCOBs, which are detected by our algorithm, are painted on the chart either as coloured candles (SCOBs without inside bars) or coloured boxes (SCOBs with inside bars) . You can see examples of SCOBs, which were detected by our SCOB algorithm, on the screenshot below:
📍 INDICATOR: Institutional Funding Candle (IFC)
IFC is a candle, which is a more strict version of SCOB. Our algorithms detects an IFC, if SCOB satisfies these conditions:
SCOB candle has large shadow (more than 50% of candle's body);
SCOB candle has large range ( | high - low | is more than a certain value, which is base on ATR).
That's basically it! Being simple as that, IFC represents itself as a high-trust SCOB, which on average has larger chance of reversing price when IFC candle is reached by it and our practice shows that it is indeed the case. IFC candles are usually go hand in hand with large price and volume spikes, which are believed to be caused by large institutional players, who trading eager to catch retail trader's stop orders, which they usually place around POIs like IFC and SCOB.
We expect traders to use IFC as a tool for entry confirmation bias, especially when considering IFC from HTF.
You can see IFC, which our algoritms detects on the chart, on the screenshot below:
📍 INDICATOR: Engulfing Candle (EC)
An Engulfing Candle is a candle, which occurs when the current candle’s body engulfs the prior candle’s body, showing a short-term shift in demand/supply balance. In SMC context, it is most useful around POIs/liquidity as a contextual confirmation element. The indicator marks bullish and bearish EC without implying a “must reverse” outcome – it’s a focus cue, not a promise.
As with any other alike tool, this algorithm should not be used as sole source of signals, but rather as a confirmation tool. ECs near support/resistance zones or POIs are typically more impactufl than those inside choppy consolidations. Structural and LTF price impulse confirmation usually enhances existing position bias in a positive way.
You can see examples of engulfing candles on the screenshots below:
Bullish engulfing candles
Bearish engulfing candles
📍 INDICATOR: Inside Bars (IB)
Inside Bars are bars, which are contained inside the range of high and low prices of the bars preceding them. This algorithm was designed to showcase periods of potential price consolidation/volatylity compression and quite often precedes price movement towards closest liquidity POIs and ZOIs. When price finally breaks out of its previous range, it usually provides good opportunities for entering trades using breakout strategies (especially ones, that are based on SMC principles) .
You can see examples of IBs, which are detected by our algorithm on the chart, on the screenshot below:
That was a long list of features, now let's talk about settings now.
🔔 WHAT ABOUT ALERTS?
At the moment of publishing this indicator includes alerts for all algorithms, which are included inside, except for Inside Bars (IB) algorithm .
⚙️ SETTINGS
At the moment of publishing most of the settings in this indicator are about styling for indicator's visuals, because by design most of the included algorithms (excluding PBB) don't rely on inputs of any technical kind. Let's review them.
ToolBox | General Styling
Text Size – (Tiny, Small, Normal, Large) – defines text size of indicator's visuals, which use text-based visuals.
Price Border Bands | Main Settings
Show Price Border Bands – toggles on/off the display of PBB;
Half Length – defines amount of bars, used for calculation of the PBB's TMA;
Price Source – defines price source for PBB's TMA;
ATR Multiplier – affects the width of PBB's bands;
ATR Period – affects the amount of bars for ATR calculation.
Orderflow (OF) | Settings
Bullish OF – toggles on/off the display & colour of bullish OF;
Bearish OF – toggles on/off the display & colour of bearish OF;
Show border – toggles on/off the display of OF blocks' border.
Single Candle Order Block (SCOB) | Settings
Show SCOB – toggles on/off the display of SCOB;
Bullish – toggles on/off the colour of bullish SCOB;
Bearish – toggles on/off the colour of bearish SCOB.
Equal High/Lows (EQHL) | Settings
Show EQH/EQL – toggles on/off the display of PDH/PDL;
EQH – toggles on/off the colour of EQH;
EQL – toggles on/off the colour of EQL.
Institutional Funding Candle (IFC) | Settings
Show IFC – toggles on/off the display of IFC;
Bullish – toggles on/off the colour of bullish IFC;
Bearish – toggles on/off the colour of bearish IFC.
Previous Day High & Low (PDHL) | Settings
Show PDH/PDL – toggles on/off the display of PDH/PDL;
Show PDH/PDL – toggles on/off the display of the past history of swept PDH/PDL;
Show previous day divider – toggles on/off the display of dashed gray line, which separates new day from previous one;
Bullish – toggles on/off the colour of bullish IFC;
Bearish – toggles on/off the colour of bearish IFC.
Engulfing Candle (EC) | Settings
Show engulfing candles – toggles on/off the display of EC;
Bullish – toggles on/off the colour of bullish EC;
Bearish – toggles on/off the colour of bearish EC.
Inside Bars (IB) | Settings
Show inside bars – toggles on/off the display of IB;
Bullish – toggles on/off the colour of bullish IB;
Bearish – toggles on/off the colour of bearish IB.
Alerts | POI
Alert Frequency – (Once Per Bar, Once Per Bar Close) – defines alert frequency of the indicator's alert for all POIs;
* all other buttons from this group of settings toggle alerts on/off.
PBB;
OF;
SCOB;
EQH;
EQL;
IFC;
PDH;
PDL;
EC.
🏁 AFTERWORD
SMC ToolBox indicator is designed to be the ultimate swiss knife, which might bring you quantifiable results when trying to crack the market's secret of where the liquidity is placed. This indicator doesn't produce any particular signals not it gives any financial advice, but it helps you deepen understanding about potential existing liquidity zones and price points by employing principles of SMC algorithms, which are most commonly used by retail traders on a daily basis.
You can view this indicator as a Christmas candy box: you pick only the candles (indicators) you need and want. We expect any trader to use this indicator by exactly same way: you should take onlt the things you need to enhance your strategy, not worrying about what to do with other indicators, fi they don't suit you.
Lastly, we would like to share our team's recommendations (they are optional, of course) on how to use certain POIs from ToolBox:
Use PBB as a filter for validating POis. Pay close attention to the rule "don't trade POIs, which are located inside the bands of PBB" (described above in "INDICATOR: PBB") ;
Use Orderflow to find short-term and mid-term trading opportunitions for trend-following strategies, using OF blocks as resistance in bearish trend and support in bullish trend;
Use EQHL and PDHL indicators when trading by mean-reversion strategies on intraday timeframes. These indicators will be especially of use to forex, stock and crypto traders;
Use SCOB and IFC indicators when trading by mean-reversion strategy to find short-term reversal opportunities;
Use ECs and IBs as confirmation/denial tools for your entry ideas. We recommend avoiding trading If price is currently going inside HTF's IB range.
We have no doubts that SMC ToolBox indicator will be of use to any trader, who employs and desire to employ SMC principles in his strategy. We will be waiting for your feedback, meanwhile you can ask your questions in the comments :)
Sincerely,
WinWorld team.

Script_Algo - Fibo Correction Strategy🔹 Core Concept
The strategy is built on combining Fibonacci retracement levels, candlestick pattern confirmation, and trend filtering for trade selection. It performs well on the 1-hour timeframe across many cryptocurrency pairs. Particularly on LINKUSDT over the past year and a half, despite the not very optimal 1:1 risk/reward ratio.
The logic is simple: after a strong impulse move, the price often retraces to key Fibonacci levels (specifically, the 61.8% level). If a confirming candlestick (pattern) appears at this moment, the strategy looks for an entry in the direction of the main trend.
🔹 Indicators Used in the Strategy
ATR (Average True Range) — Used to calculate the stop-loss and take-profit levels.
EMA (9 and 21) — Additional moving averages for assessing the direction of movement (not directly used in entry conditions, but the logic can be expanded to include them).
SMA (Trend Filter, 20 by default) — The trend direction filter. Trades are only opened in its direction.
Fibonacci Levels — The 61.8% retracement level is calculated based on the high and low of the previous candle.
🔹 Entry Conditions
🟢 Long (Buy):
Previous Candle:
Must be green (close higher than open).
Must have a body not smaller than a specified minimum.
The upper wick must not exceed 30% of the body size.
→ This filters out "weak" or "indecisive" candles.
Current Candle:
Price touches or breaches the Fibonacci 61.8% retracement level from the previous range.
Closes above this level.
Closes above the Trend Filter (SMA) line.
A position is opened only if there are no other open trades at the moment.
🔴 Short (Sell):
Previous Candle:
Must be red (close lower than open).
Must have a body not smaller than a specified minimum.
The lower wick must not exceed 30% of the body size.
Current Candle:
Price touches or breaches the Fibonacci 61.8% retracement level from the previous range.
Closes below this level.
Closes below the Trend Filter (SMA) line.
A trade is opened only if there are no other open positions.
🔹 Risk Management
Stop-Loss = ATR × multiplier (default is 5).
Take-Profit = ATR × the same multiplier.
Thus, the default risk/reward ratio is 1:1, but it can be easily adjusted by changing the coefficient. Although, strangely enough, this ratio has shown the best results on some assets on the 1-hour timeframe.
🔹 Chart Visualization
Fibonacci level for Long — Green line with circles.
Fibonacci level for Short — Red line with circles.
Trend Filter line (SMA) — Blue.
🔹 Strengths of the Strategy
✅ Utilizes a proven market pattern — retracement to the 61.8% level.
✅ Further filters entries using trend and candlestick patterns.
✅ Simple, transparent logic that is easy to expand (e.g., adding other Fib levels, an EMA filter, etc.).
🔹 Limitations
⚠️ Performs better in trending markets; can generate false signals during ranging (sideways) conditions.
⚠️ The fixed 1:1 risk/reward ratio is not always optimal and could be refined.
⚠️ Performance depends on the selected timeframe and ATR parameters.
📌 Summary:
The strategy seeks corrective entries in the direction of the trend, confirmed by candlestick patterns. It is versatile and can be applied to forex pairs, cryptocurrencies, and stocks.
⚠️ Not financial advice. Pay close attention to risk management to avoid blowing your account. The strategy is not repainting — I have personally verified it through real testing — but it may not necessarily replicate the same results in the future, as the market is constantly changing. Test it, profit, and good luck to everyone!

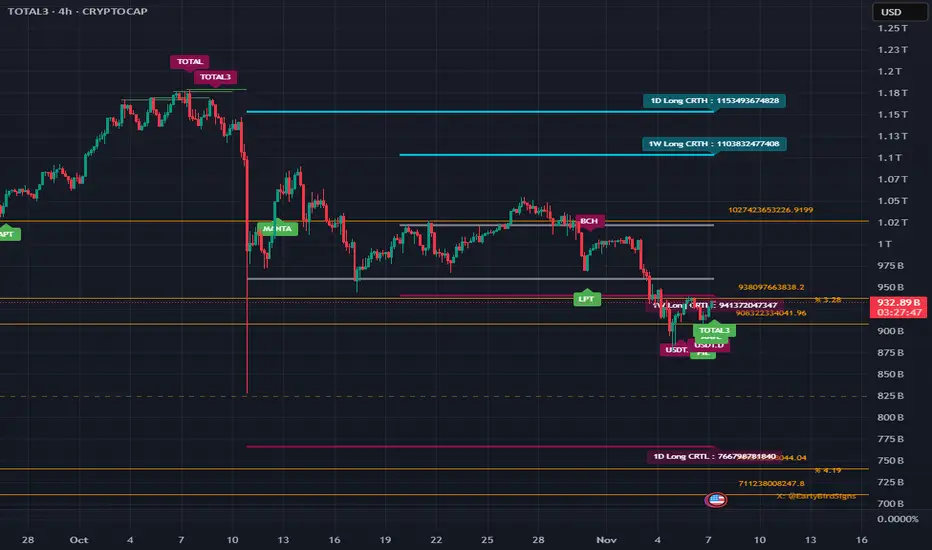
GoldenPocket & CRT IndicatorWith this script, you will be able to see Golden Pocket Fibonacci Levels and Candle Range Theory Highs, Lows and EQs.
You can set lookback bar numbers to define Fibonacci highs and lows.
You can set CRT High Time-frame.
Simple and effective script. Please let me know if you have any comments and support me if you like it.
VSA Volume + Fibonacci (Volunacci)Overview
This indicator combines Volume Spread Analysis (VSA) with Fibonacci levels to identify key price zones based on volume behavior. It helps traders determine potential support and resistance levels influenced by volume strength.
How It Works
Volume Calculation
The indicator calculates volume levels based on the selected timeframe.
It identifies high volume spikes and low volume dips, which are critical for detecting supply and demand shifts.
It uses a simple moving average (SMA) of volume to smooth fluctuations.
Fibonacci Levels Integration
When a high-volume event is detected, the indicator records the highest high and lowest low of that candle.
It then plots Fibonacci retracement and extension levels to highlight potential price reaction zones.
Negative Fibonacci levels are included to identify possible deep retracements.
Visual Features
The indicator adapts to both light and dark themes for better visibility.
Fibonacci lines are color-coded based on key retracement and extension levels.
A table displaying key Fibonacci levels and their corresponding prices is provided for quick reference.
Why Is This Indicator Useful?
It helps traders spot accumulation and distribution phases by analyzing volume at key price points.
The combination of VSA and Fibonacci allows traders to confirm trend strength and identify potential reversal points.
Works well for trend-following strategies, scalping, and breakout trading.
How to Use This Indicator?
Use it to confirm breakouts or reversals at Fibonacci levels when volume supports the move.
Watch for high-volume spikes near key Fibonacci zones—these can signal strong trend continuation or reversal.
Use the displayed Fibonacci table to quickly assess price reaction levels.
Credits
This script was inspired by the Hidden Gap’s VSA Volume indicator by HPotter and has been enhanced by integrating Fibonacci-based analysis.
Bounce Price Detector ~ By mohx_404꧁༺ 𝓑𝓸𝓾𝓷𝓬𝓮 𝓟𝓻𝓲𝓬𝓮 𝓓𝓮𝓽𝓮𝓬𝓽𝓸𝓻 𝓘𝓷𝓭𝓲𝓬𝓪𝓽𝓸𝓻 ༻꧂
* Hi everybody here's the ★彡 𝓑𝓸𝓾𝓷𝓬𝓮 𝓟𝓻𝓲𝓬𝓮 𝓓𝓮𝓽𝓮𝓬𝓽𝓸𝓻 𝓘𝓷𝓭𝓲𝓬𝓪𝓽𝓸𝓻 彡★ indicator and how to use it :
彡彡彡彡彡彡彡彡彡彡彡彡彡彡彡彡彡彡彡彡彡彡彡彡彡彡彡彡彡
First : Depending on Pivot (HH,LL), the two possible price Correction appears on chart if the price under the Correction levels it would be a Resistance levels and to entry there candle must close above the levels, you can use Replay Mod to get the previous price Correction levels
And Here's Some Example : The price make a new HH,LL and new levels appears on chart but the price didn't confirm a bounce signale and close above the first level
So in next candle the price brake the levels and drop down :
Then a new HH,LL and new levels appears on chart and the price back to the lower levels as a Resistance Levels but when it's close above the levels and test it again it become a Support levels and price bounce again
Here's another example when price go above the levels , test it and bounce again
About The levels : depending on Fibonacci golden rate
░▒▓█ 𝐍𝐨𝐭𝐞 : You could change the pivots the value 10 for low time frame and
scalping for higher time frame you could increase the pivots value or keep it as you want █▓▒░

Fibonacci Plot [ABA Invest]]ABOUT
This Fibonacci tool is easier than the usual Fibonacci drawing. with this, we can use Fibonacci drawing by choosing 2 different candles as starting point and ending point
INPUT SETTING
Fibonacci type: we can choose the type
option 1--> Fibonacci standard: display multiple levels constructed using the starting price point, ending price point, and multiple Fibonacci ratios. These levels can be used as support and resistance
option 2--> Fibonacci musang displays multiple levels constructed using the starting price point, ending price point, and multiple Fibonacci ratios. these levels can be used as taking profit level and also to know the ending of trendline
Drawing point: we can choose the type how we want the tools to draw our starting and ending point at candlestick
- wick to wick
- wick to body
- body to body

fibo_levelsLibrary "Fibo_levels"
Calculate Fibo levels from any 2 levels. Your need know only 2 price of 2 levels for calculate any level of Fibo: function 'fibo_lvl',
or calculate array of price Fibo levels : function 'fibo_lvls'
fibo_lvl(fibo_lvl1, price1, fibo_lvl2, price2, calc_level)
Parameters:
fibo_lvl1 : First of any level of fibo from 0 to 1 (example 0.236)
price1 : Price for 1th any level (example 2356.1)
fibo_lvl2 : Second of any level of fibo from 0 to 1 (example 0.382)
price2 : Price for 2th any level (example 2497.4)
calc_level : Price for level to calculate (example 0.5)
Returns: return price for calc_level fibo
fibo_lvls(bars, time1, time2, fibo_lvl1, price1, fibo_lvl2, price1)
Parameters:
fibo_lvl1 : First of any level of fibo from 0 to 1 (example 0.236)
price1 : Price for 1th any level (example 2356.1)
fibo_lvl2 : Second of any level of fibo from 0 to 1 (example 0.382)
price1 : Price for 2th any level (example 2497.4)
Returns: array of price for fibo levels : (0.0, 0.118, 0.236, 0.384, 0.5, 0.618, 0.786, 1.0, 1.27,-0.27,1.618,-0.618)

FibonacciLibrary "Fibonacci"
General Fibonacci functions. Get fib numbers, ratios, etc.
fib_precise(f, precision)
Get the precise Fibonacci ratio, to the specified number of decimal places
Parameters:
f : Fibonacci ratio (string, in form #.###)
precision : Number of decimal places (optional int, dft = 16, max = 32)
Returns: Precise Fibonacci ratio (float)
fib_n(n)
Calculate the Nth number in the Fibonacci sequence
Parameters:
n : Index/number in sequence (int)
Returns: Fibonacci number (int)
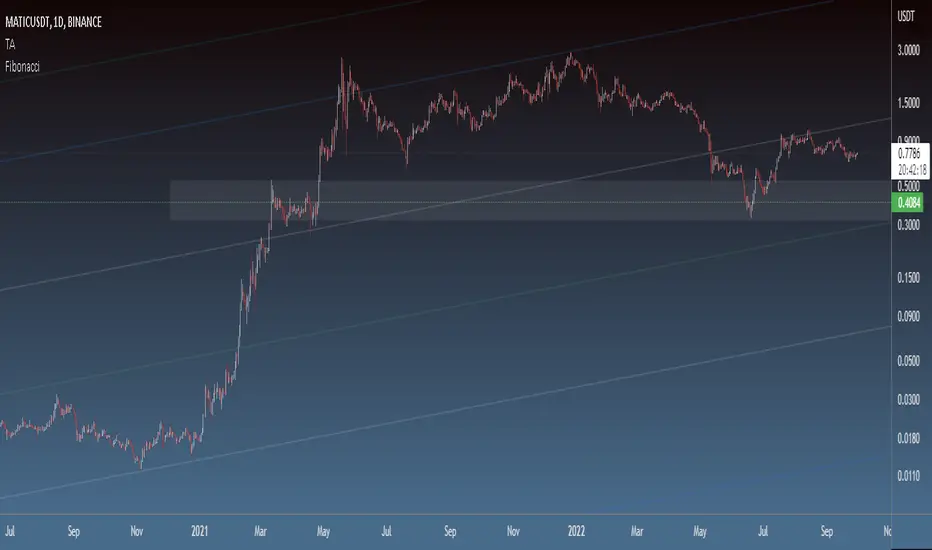
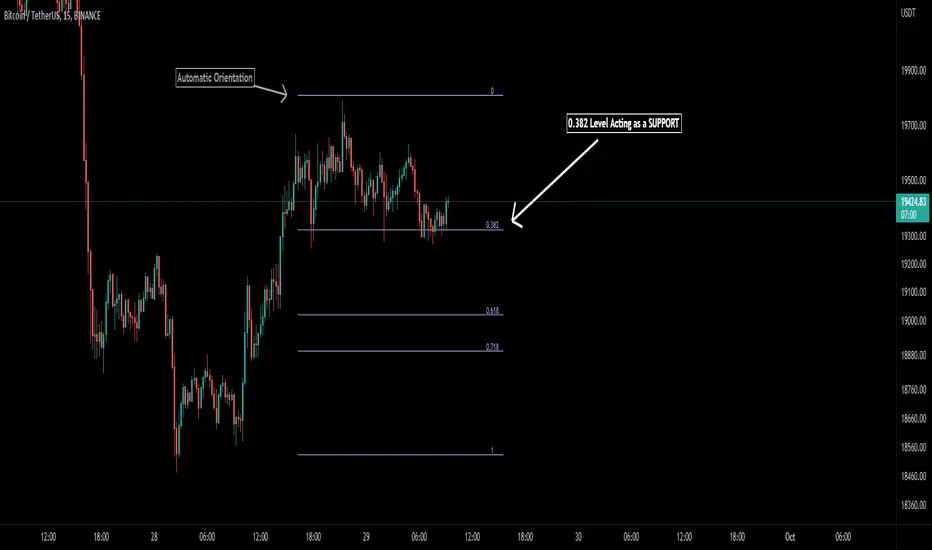
Auto Fibonacci [Misu]█ This indicator shows an automatic Fibonacci retracement levels.
This indicator is designed based on highs, lows, and trend interpretation to orientate the fibonacci retracement in the good direction.
Fibonacci analysis uses a logical sequence of numbers to predict trends and price action.
█ Usages:
The Fibonacci retracement is used to identify hidden support and resistance levels that an investor can use for entry, exit, and stop placement.
Depending on your usage, you can track breakouts above and below retracement levels to provide early entry points for major breakouts and breakdowns.
█ Features:
> Choose Fib levels
> Color Fib Levels all in one
> Color Fib Levels Individually
█ Parameters:
Deviation: A parameter used to calculate pivots.
Depth: A parameter used to calculate pivots.
UI Settings: Select Fibs levels and colors.
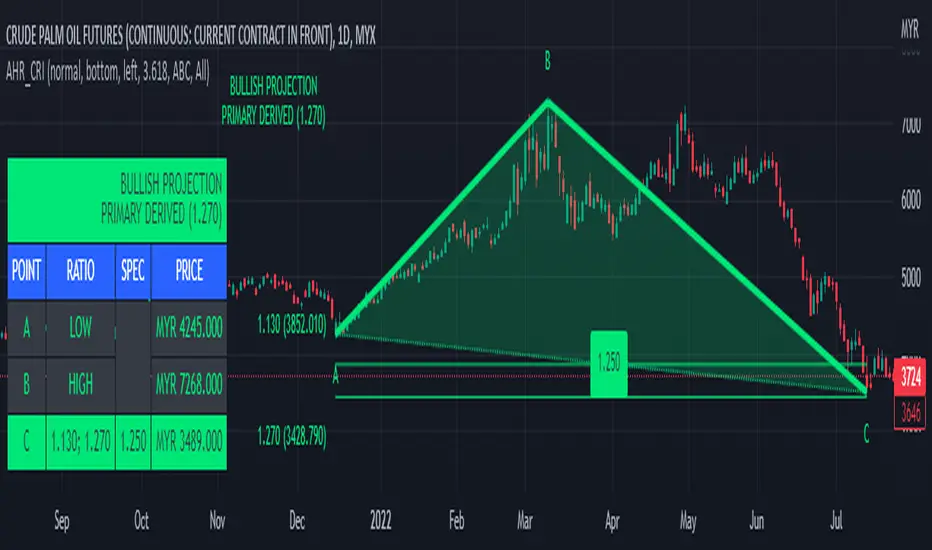
ABC 123 Harmonic Ratio Custom Range Interactive█ OVERVIEW
This indicator was designed based on Harmonic Trading : Volume One written by Scott Carney.
This is about harmonic ratios which expanded through retracement and projection.
Derivation is pretty much explained here such as Primary, Primary Derivation, Secondary Derivation and Secondary Derivation Extreme.
Derivation value depends on minimum retracement or maximum projection.
This derivation value utilize Fibonacci value which later expand to Harmonic Ratio.
█ INSPIRATION
Inspired by design, code and usage of CAGR . Basic usage of custom range / interactive, pretty much explained here . Credits to TradingView.
This build is based and visualized upon Harmonic Trading Ratios.
This build also was stripped down from XABCD Harmonic Pattern Custom Range Interactive .
█ CREDITS
Scott Carney, Harmonic Trading : Volume One (Page 18)
█ FEATURES
Table can positioned by any position and font size can be resized.
Labels can be either changed to alphabets or numbers.
█ HOW TO USE
Draw points from Point A to Point C.
Dont worry about magnet, point will attached depends on High or Low of the candle.
█ USAGE / TIPS EXAMPLES (Description explained in each image)
HarmonicDB█ OVERVIEW
This library was to showcase database for specifications of Harmonic Patterns using arrays.
█ CREDITS
Scott M Carney, author of Harmonic Trading : Volume Three
animal_db(x)
TODO: export animal_db
Parameters:
x : TODO: float value is set to default if not necessary
Returns: TODO:

FiboBars ExtendedA trend indicator FiboBars Extended , the main purpose of which is to confirm the trend and cut off market noise. In his logic, he uses the Fibonacci sequence.
Two settings are used to account for noise suppression accuracy:
Period - number of calculation bars
Level - Fibonacci number selection

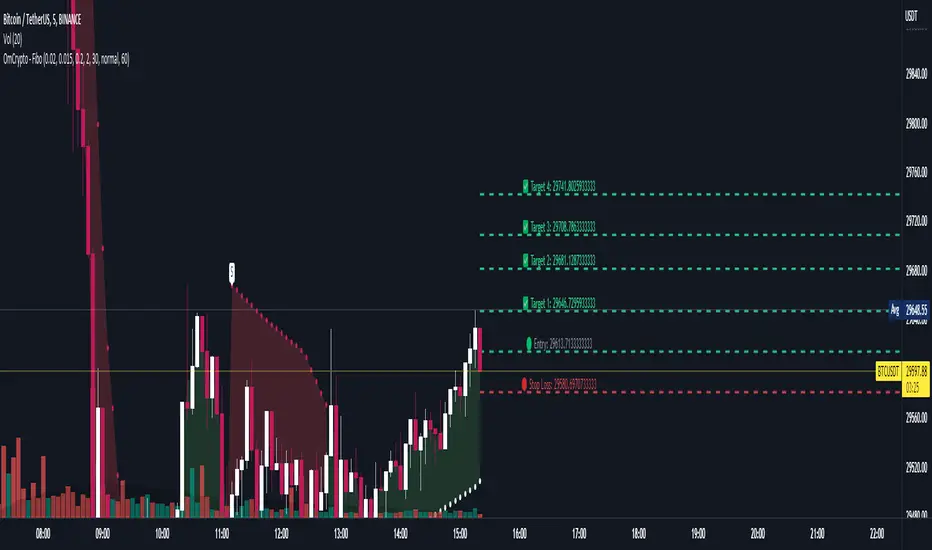
OmCrypto - PSAR with TargetOmCrypto - PSAR with Target
This script uses PSAR as it's main buy and sell signal with automatic target to take profit, entry and stop loss
It also supports alert so you can use it for bots
You can set your own period (timeframe) for the target lines in settings, default is 60 minutes (1h)
Harmonic Table Combo Point B█ OVERVIEW
This indicator was intended as educational purpose only and alternative way to show value in table as shown in Harmonic Pattern Possibility Table .
█ CREDITS
Credit to Scott M Carney, Harmonic Trading Volume 3: Reaction vs. Reversal.
█ USAGE EXAMPLE

Harmonic Pattern Possibility Table█ OVERVIEW
This indicator was intended as educational purpose only based on Harmonic Pattern Table (Source Code) and Ratio For Harmonic Points to show Harmonic Pattern Possibility.
█ INSPIRATION
This indicator was build upon realizing there are some overlap for B = XA among Alternate Bat, Bat, Crab and Gartley.
Hence, the values split up to showcase the possibility of non overlap ratio.
█ USAGE
Possible pattern, priority pattern and selected pattern may differs based value input.
Therefore C = AB, D = BC, D = XA and Stop Loss will change based value input and also selected pattern.
█ CREDITS
Credit to Scott M Carney, Harmonic Trading Volume 3: Reaction vs. Reversal.

Fibonacci Timing PatternThe Fibonacci Timing Pattern is a price-based counter that seeks to determine short-term and medium-term reversals in price action. It is based on the following set of conditions:
* For a bullish Fibonacci timing signal: The market must shape 8 consecutive close prices where each close price is lower than the close prices from 3 and 5 periods ago.
* For a bearish Fibonacci timing signal: The market must shape 8 consecutive close prices where each close price is higher than the close prices from 3 and 5 periods ago.
The signals of the pattern are ideally used in a sideways market or used in tandem with the trend (bullish signals are taken in a bullish market and bearish signals are taken in a bearish market).

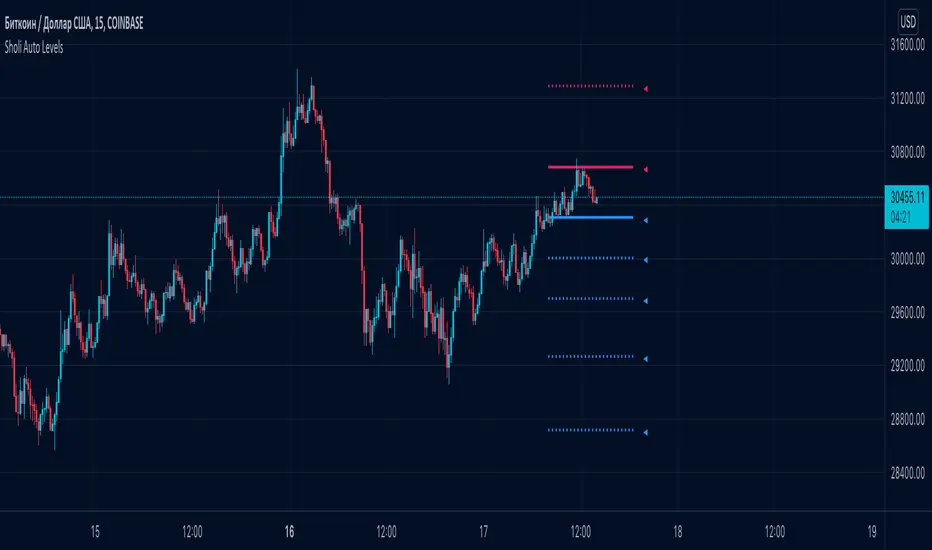
Sholi Auto Levels◾️ Auto levels are calculated for each timeframe separately. The script builds fibonacci levels once in a certain period for each of the timeframes. With the help of previously found support and resistance levels, high and low values, the indicator determines the most accurate distribution of fibonacci levels.
Extremely convenient for use in Technical Analysis. You can define rise or fall correction levels by the specified levels.
◾️ How to use?
Blue levels - support. Red - resistance. If you hover over the pointer near the level, you can see detailed information.
As a rule, the price moves at the indicated levels. It lingers on them and tries to break through or find support.
◾️ What is useful for you?
You will be able to build your own analytics based on clear levels that ideally determine the potential for movement in the market.
Ratio For Harmonic Points█ OVERVIEW
This indicator was intended as educational purpose only based on Harmonic Pattern Table (Source Code) to show indication of ratio for each Harmonic points from Point B until Stop Loss.
█ CREDITS
Credit to Scott M Carney, Harmonic Trading Volume 3: Reaction vs. Reversal.
█ USAGE EXAMPLE

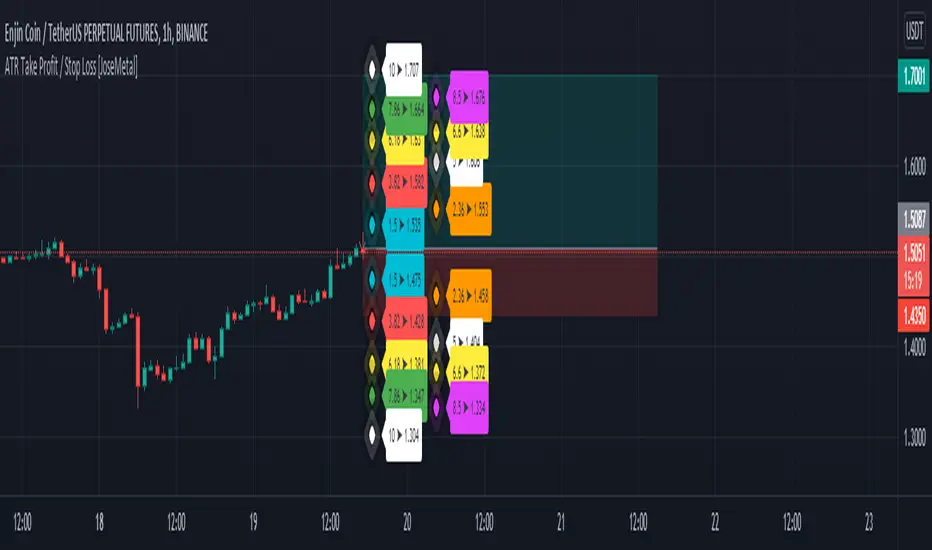
ATR Take Profit / Stop Loss [JoseMetal]============
ENGLISH
============
- Description:
This indicator is based on ATR to print current ATR multiple values for Take Profits or Stop Loss levels, it's real time, so you can use the replay feature to test it or calculate these levels anytime on any candle.
Therefore, levels are calculated by multiplying the ATR by the level multiplier.
- Visual:
Both a "diamond" and label with the ATR multiplier and price value are printed for each level.
Each level has a color for both, diamond and label to make it easier to read.
The levels are split in 2 columns for better visualization.
- Usage and recommendations:
Fibonacci's levels are used for default, but you can customize them as you like.
I usually take 3.82 level (red by default) as stop loss, and I take profit every 2 levels depending on the timeframe, is good to let a small part run until break even or ATR 10 (last level).
- Customization:
Custom ATR period, 10 is default.
Each level has custom multiplier and level.
Customizable offset for diamonds and labels.
Custom precision for prices (because it greatly depends on the asset you're working with).
============
ESPAÑOL
============
- Descripción:
Este indicador se basa en el ATR para mostrar múltiples niveles de Take Profits o Stop Loss, es en tiempo real, por lo que se puede utilizar la función de repetición para probarlo o calcular estos niveles en cualquier momento y en cualquier vela.
Por lo tanto, los niveles se calculan multiplicando el ATR por el multiplicador del nivel.
- Visual:
Tanto un "diamante" como una etiqueta con el multiplicador ATR y el valor del precio se imprimen para cada nivel.
Cada nivel tiene un color tanto para el diamante como para la etiqueta para facilitar su lectura.
Los niveles están divididos en 2 columnas para una mejor visualización.
- Uso y recomendaciones:
Se usan los niveles de Fibonacci defecto, pero puedes personalizarlos como quieras.
Yo suelo usar el nivel 3.82 (rojo por defecto) como stop loss, y tomo beneficios cada 2 niveles dependiendo de la temporalidad, es bueno dejar correr una pequeña parte hasta el break even o ATR 10 (último nivel).
- Personalización:
Periodo ATR personalizable, 10 es el predeterminado.
Cada nivel tiene multiplicador y nivel personalizables.
Desplazamiento (offset) personalizable para los diamantes y las etiquetas.
Precisión para decimales personalizada (porque depende mucho del activo con el que se trabaje).