RSI Scaling (UO)Plot price scaled by the RSI. Also, plot high and low of the scaled price so that the trend is visible as well as sell-high/buy-low points...
Before the prices change direction, RSI generally makes a double top/bottom... Or a lower high/higher low.
This is more emphasized on the scaled price. You can see the high/low band change direction
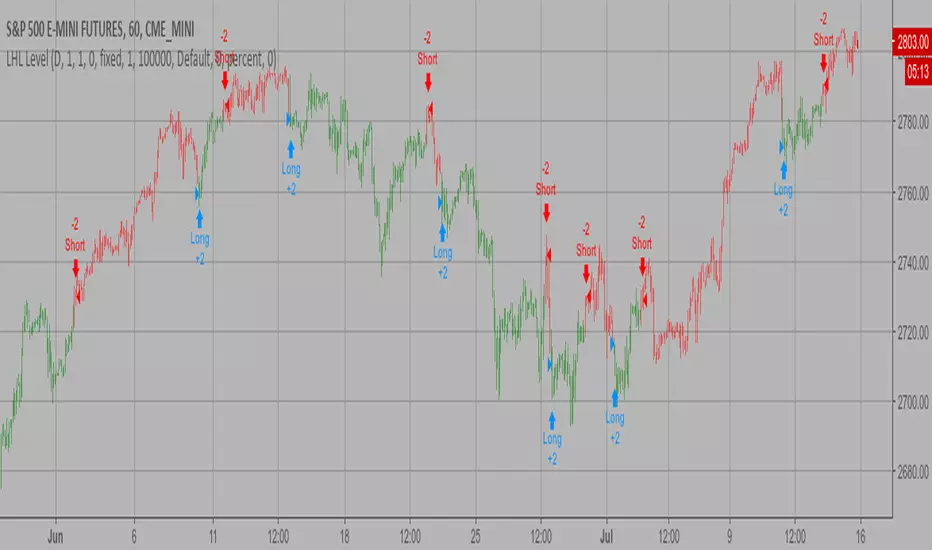
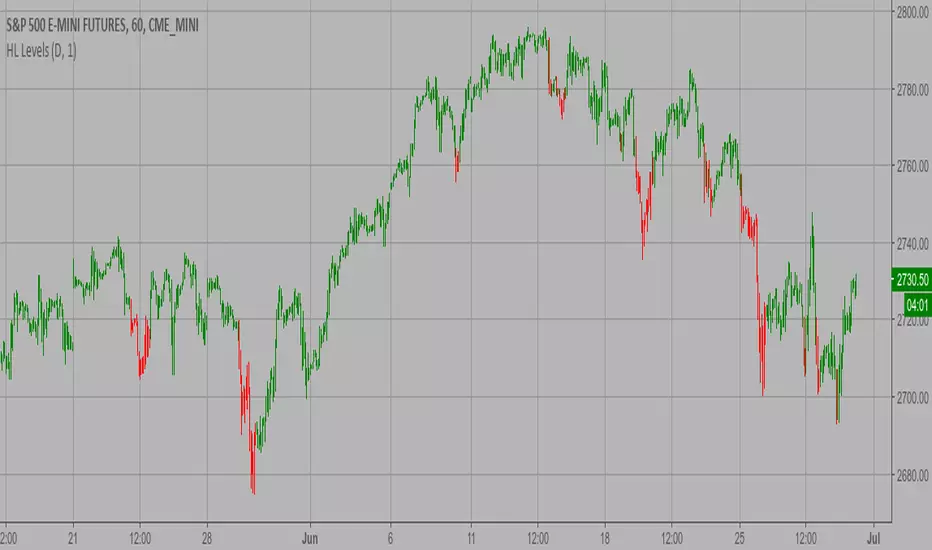
Highlow

PDF {pSAR /w HiLo Trends + Fib Retrace/Extension Levels}parabolic SAR /w HighLow Trends Indicator/Bar-color-marking + Dynamic Fib Retrace and Extension Level
~ * ~ * ~ * ~ * ~ * ~ * ~ * ~ * ~ * ~ * ~ * ~ * ~ * ~ * ~ * ~ * ~ * ~ * ~ * ~ * ~
Note:
In no way is this intended as a financial/investment/trading advice. You are responsible for your own investment decisions and trades.
Please exercise your own judgement for your own trades base on your own risk-aversion level and goals as an investor or a trader. The use of OTHER indicators and analysis in conjunction (tailored to your own style of investing/trading) will help improve confidence of your analysis, for you to determine your own trade decisions.
~ * ~ * ~ * ~ * ~ * ~ * ~ * ~ * ~ * ~ * ~ * ~ * ~ * ~ * ~ * ~ * ~ * ~ * ~ * ~ * ~
Please check out my other indicators sets and series, e.g.
LIVIDITIUM (dynamic levels),
AEONDRIFT (standard deviation bands),
FUSIONGAPS (MA based oscillators),
MAJESTIC (Momentum/Acceleration/Jerk Oscillators),
PRISM (pSAR based oscillator, with RSI/StochRSI as well as Momentum/Acceleration/Jerk indicators),
and more to come.
Constructive feedback and suggestions are welcome.
~ JuniAiko
(=^~^=)v~

Eagle Eye RSIAlternative version of Project Eagle Eye but for RSI, changing the length of RSI will also update ranges and lines.

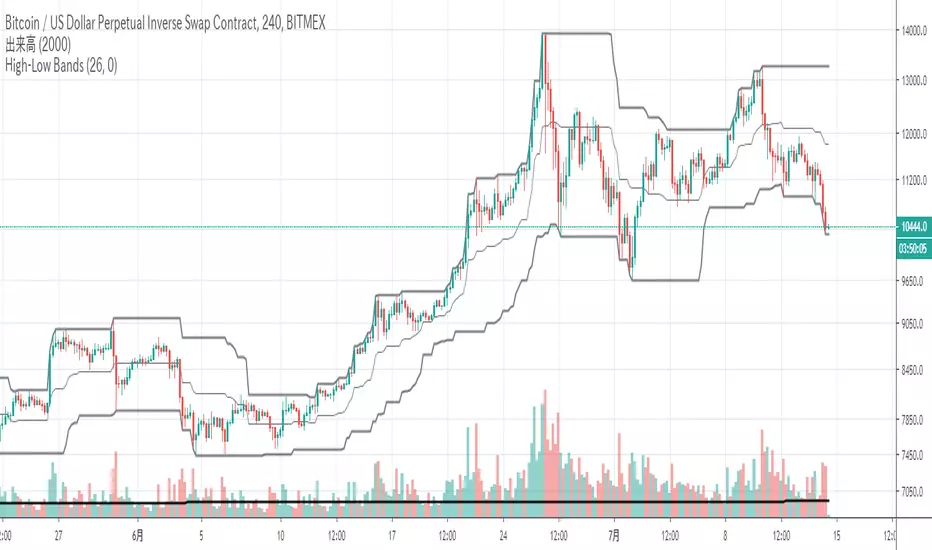
High Low BandsIt is just a high-low band. I published it because I could not find something good.
ただのハイローバンドです。何故か良いのが見つからないので公開しました。


Bars Counter + Daily/Weekly Highs/Low highlight.Hey!
This script is a remake from other's devs scripts.
The * makes a signal if there is a higher high or lower low , RED( I don't know why looks orange )/LIME for WEEKLY and AQUA/YELLOW for a 36 hs WINDOW.
You can change this parameter as u wish.
The bar counter is simple.
Let me know ur feedback.
MTF H/L RangeThis indicator will let you have multiple timeframe support and resistance levels on any timeframe!

Damping IndexThis indicator was originally developed by Curtis McKallip Jr. (Stocks & Commodities, V.10:7 (296-299): "The Damping Index").
It indentifies bars where the highs and lows are getting close and closer. A high Damping Index value means that the difference between the high price and low price is becoming lower and the security price is reaching equilibrium. A low Damping Index value means that the difference between the high and low prices is increasing.
Good luck and happy trading!

Nemesis Swing High Low Support/Resistance Pivot Points by ZekisNemesis Swing High Low Support and Resistance Pivot Points Channel
An indicator that project support and resistance, highs and lows and pivot points
There are a lot of strategies where it can be used, a little google or youtube search for more infos
I colored with black the channel and green when the price breaks the resistance and red when breaks the support for a better view
Values for support and resistance can be adjusted
*Soon i will add alerts for breakeouts
Enjoy!
@ Zekis

Hermes Scalping Study by ZekisA simple scalping indicator, based on Highs and Lows.
It's working in any timeframe, the only condition is ... volatility .
Values are already set, but you can change them according to your preferences and to your chart.
Alerts are enabled.
Enjoy!
@ Zekis

[RG9]BarsSinceHighLowThis indicators shows the number of bars since a higher than current high price and a lower than current low price.
The bars since a higher high is shown in red, as high values for this number can indicate a bearish reversal.
The bars since a lower lower is shown in green, as high values for this number can indicate a bullish reversal.
If there could be no higher high or lower low found in the search window, the value will be 0.
The inputs are the max number of bars back in the search window and the min number of bars back in the search window.
The min number parameter can be useful for removing noise from the last couple of bars.
The max number parameter can be useful for getting a bigger picture of the high and low data, but also drowns out shorter time frame data.
This indicator is useful for finding bottoms and tops, and can be used to catch reversals or identify pullbacks in order to buy a dip.

[RG9]High Low CandlesCandles based on the high and low of every bar.
Colors:
Green if higher high and higher low than last candle
Red if lower high and lower low than last candle
Gray if lower high and higher low than last candle
White if higher high and lower low than last candle

NewMexCapital Trading Pack 1 - BB, MA, TD, ICHIMOKUWe have compiled in one indicator some of the most reliable tools (BB, MAs, ICHIMOKU, TD, W/D high-low) that can be added on the chart (overlay = true).
This is very useful when for example you want to add multiple MA's (HMA, EMA, Zerolag MA, RMA, SineWMA etc) and you want to quickly switch between them. Available types of moving averages: Double EMA, EMA, Triple EMA, HullMA, RSI MA, Simple MA, Smoothed MA, Sine WMA, WMA, ZeroLag EMA, Volume WMA. You can also add offset and choose the source for each MA.
Bollinger Bands are now very customisable. You can choose the type of MA used for creating the bands, you can choose the source for that MA and you can choose different options for each band for example you can set the upper band to be calculated based on SMA 20 with HIGH as a source and the lower band to be calculated based on EMA 25 with LOW as a source. You can also define a buy or sell line above or below the line with "Buy Value" and "Sell Value" inputs. This upgrade is based on modhelius's advanced Bollinger Bands script.
Ichimoku, T.D., weekly/daily high low have the original code without any modifications. Ichimoku uses by default the settings for crypto.
This indicator is free to use.

Last High and Low Level Backtest This script shows a high and low period value.
SelectPeriod - Day or Week or Month and etc.
LookBackPeriods - Shift levels 0 - current period, 1 - previous and etc.
You can change long to short in the Input Settings
WARNING:
- For purpose educate only
- This script to change bars colors.
Last High and Low Level Strategy This script shows a high and low period value.
SelectPeriod - Day or Week or Month and etc.
LookBackPeriods - Shift levels 0 - current period, 1 - previous and etc.
WARNING:
- This script to change bars colors

High and Low Levels Backtest This script shows a high and low period value.
Width - width of lines
SelectPeriod - Day or Week or Month and etc.
LookBack - Shift levels 0 - current period, 1 - previous and etc.
You can change long to short in the Input Settings
WARNING:
- For purpose educate only
- This script to change bars colors.

High and Low Levels Strategy This script shows a high and low period value.
Width - width of lines
SelectPeriod - Day or Week or Month and etc.
LookBack - Shift levels 0 - current period, 1 - previous and etc.
WARNING:
- This script to change bars colors.
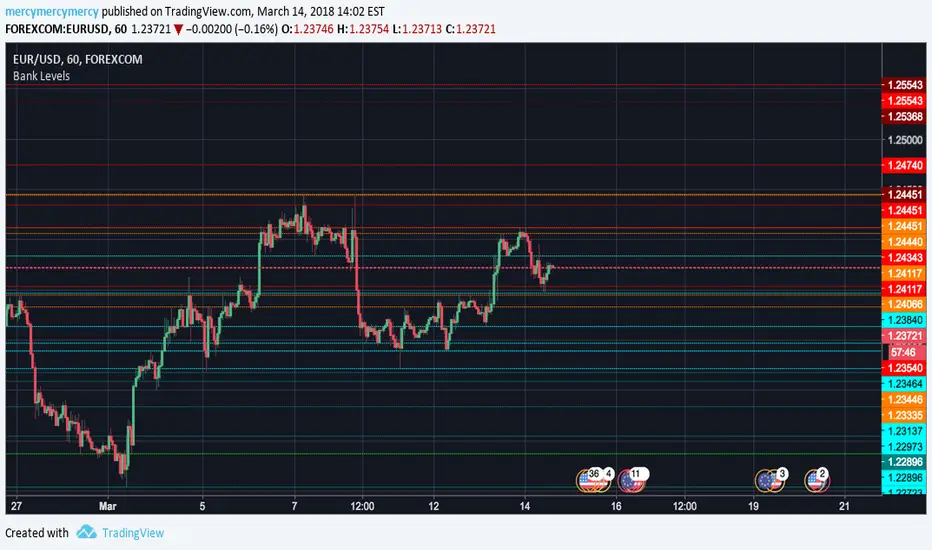
Bank Levels (Colored)Bank levels - highs and lows - of the previous day, week, and month only, colored in for visual effect. Includes history of past bank levels as opposed to my other bank levels script.
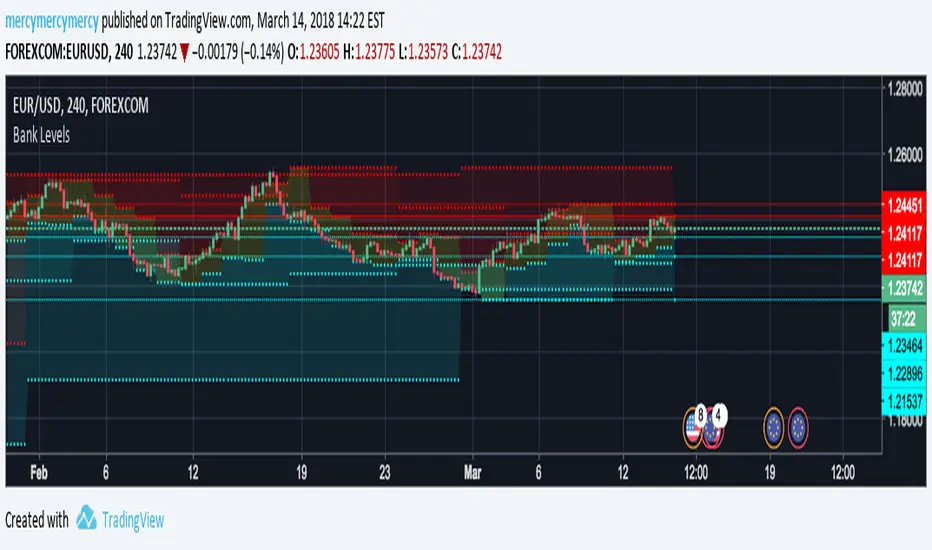
Bank Levels, 6 Previous, D W MIf you trade Forex this is the indicator you need above all. Most recent six highs and lows on the daily, weekly, and monthly (includes current day). Support and resistance isn't quite what it is...until when that's exactly how it often plays out on the lines. They are called bank levels for a reason. *Not every line will support or resist of course*
B3 AutoEdgeBreak FibonacciHere is the lazy person's Fibonacci retracement drawing machine. Keep the bars in range pretty big, but you can play around and see what it does. If too small, it gets in your way, and If oversized, your retracements will not properly work upward and downward according to action. So, if you notice that it's always retracing the same direction, then lower the first input.
Now on top of the coding being tricky because of massive history in T-view, trading the Fibs is not an easy task either. Experienced Fib traders will probably love my script, and those that are not good at Fibs will love the historical look of it, but feel helpless in real-time. It took me years to learn a reaction pattern to the Fib lines, and the one key piece of my memory: if a price-line test comes and fails in relation to your trade, get out!!! <- Not real advice, just experience talking.
I expect to be upgrading this particular script in the future. Enjoy!

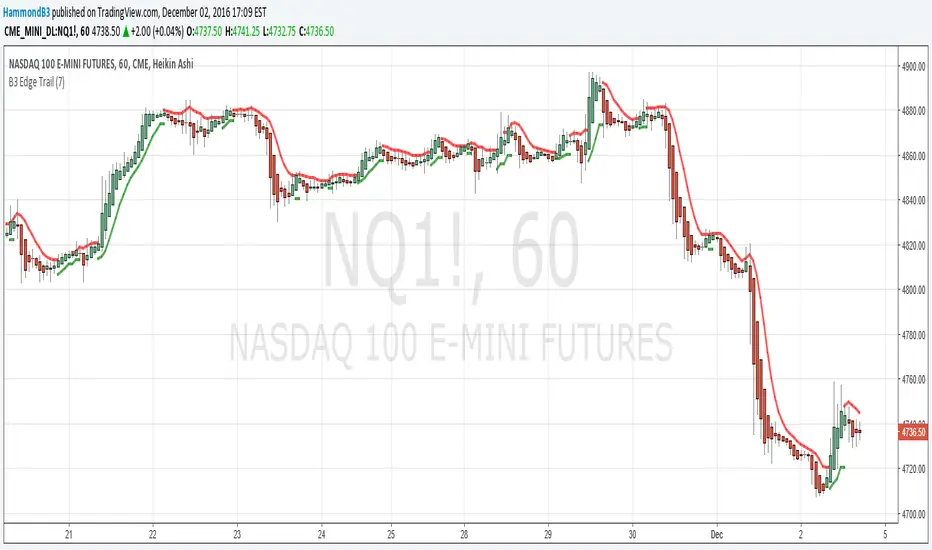
B3 Edge TrailB3 Edge Trail is similar to a SuperTrend or ATR stopline system. It is based on the average of the highs and lows, and when back-broken, the binary bias flips. Simple as pie to use, just set your input to whatever suits your chart. The more "bars back" length the less flipping, then if you lower that input number it will result in an increase in sensitivity.
Enjoy, and now that TradingView has made it easy to do, I will be offering access to the strategies I have made based on my indicators. These will be available on the web eventually.