MACD + CMF + EMA + Supertrend by TradeSmartHello everyone and welcome to our first script release!
This script is one of many upcoming scripts. This one is a test for us, how it works, how you guys like this kind of stuff, and for feedback what we should change/improve at.
SCRIPT IS OPTIMIZED FOR:
EUR/USD 30 MINUTE TIMEFRAME
Video of the Strategy:
Search for “MACD + CMF + 200 EMA + Supertrend Trading Strategy Tested 100 Times with Great Results!” on our channel.
In this video you can find the exact strategy we programmed, just one added feature: Supertrend trailing stop loss. (position gets closed once the price hits the Supertrend indicator)
Now you can modify the following:
MACD settings
Supertrend settings
EMA settings
CMF settings
We will update the script with more and more features.
The first update will be:
Modifiable risk to reward ratio.
I will make a video of how to use this indicator next week, explaining all the features and more!
Hope you like it! Don't forget to let us know what we should change or improve. Thanks, and have a great day!
STRATEGY ENTRY RULES
LONG
When CMF is above 0 and price is under EMA. Also MACD has made a double cross above the zero line (meaning one cross down and one cross up by the MACD line). Then go long!
Note:
MACD or Signal must return under 0 in order to start a new position
If either of the MACD lines touches the 0 line before entry, we skip the trade and wait for the next signal.
SHORT
When CMF is under 0 and price is under EMA. Also MACD has made a double cross under the zero line (meaning one cross up and one cross down by the MACD line). Then go short!
Note:
MACD or Signal must return under 0 in order to start a new position.
If either of the MACD lines touches the 0 line before entry, we skip the trade and wait for the next signal.
TAKE PROFIT
When price hits the exit price (calculated from stop loss with the risk ratio), then exit with 50% of the position. The other 50% will stay open until the price hits the supertrend or the base stop loss.
STOP LOSS
When price hits stop loss then exit the position. Stop loss is calculated from the Supertrend and it is a trailing one, meaning it changes based on the movement of the price.
QUANTITY TO BUY
The quantity to buy is based on the Risk Per Trade % attribute. This means that we can set how much money we want to risk on one trade. Meaning that if we lose that particular position, then a Risk Per Trade % value of our equity will be lost.
Example: if you set the Risk Per Trade % to 1 % and you have a 100$ account balance, then if you loose the trade you will loose 1$ max.
K-macd

EMA+MACDA simple script using EMA 25 and EMA 50 with MACD. Enter long when EMA 25 crossover ema 50 and MACD line > 0, enter short when EMA 50 crossover ema 25 and MACD < 0
MACD-Extendido-Estrategia por Neil--------------------------------
MACD-Extendida-Estrategia
--------------------------------
DESCRIPTION
Resource that identifies entry and exit operations using the indicator
Average Convergence and Divergence Movements ( MACD ) and 5 strategies
INTERESTING
Novel strategies are implemented such as:
1. Overbought and oversold band to avoid horizontal movements
2. Control inputs and outputs at positions opposite the histogram line
3. Make a profit (take profit) without prior purchase orders
HOW DOES IT WORK (STRATEGIES)
1) Overbought and oversold:
Allows you to define an overbought upper band
Allows you to define an oversold ower band
Operations that occur within the band are ignored
2) Place of next operation (either side):
Indicates that the next operation can occur on either side of the histogram
3) Place of next operation (opposite side):
Indicates that the next operation must occur on the opposite side of the histogram
4) Take profit:
It allows defining the deviation in favor to execute a take profit.
It does not place a buy order at a distant point, instead it looks back and if the shift meets the expected deviation, take profit is executed
5) Loss control (stop loss):
It allows to define the deviation against to execute a stop loss.
It does not place a stop order at a distant point, instead it looks back and if the displacement meets the expected deviation the stop loss is executed
How to use it:
Press the "Indicators" option, go to the "Public Librarian" segment, write the name "MACD-Extended-Strategy by Neil", double-click on the record in question and you will have it added in your work panel, now, just It remains to be used to identify the inputs and outputs and you can do it visually or by defining the automatic notification alerts.
--------------------------------
MACD-Extendida-Estrategia
--------------------------------
DESCRIPCION
Recurso que identifica operaciones de entradas y salida haciendo uso del indicador
Media móvil de Convergencia/Divergencia ( MACD ) y 5 estrategias
NOVEDADES
Se implementan estrategias novedosas como:
1. Banda de sobrecompra y sobreventa para esquivar movimientos horizontales
2. Control de entradas y salidas en posiciones contrarias a la línea del histograma
3. Toma de ganancias (take profit) sin ordenes de compra previa
COMO FUNCIONA (ESTRATEGIAS)
1) Sobrecompra y Sobreventa:
Permite definir una banda superior de sobrecompra
Permite definir una banda inferior de sobreventa
Operaciones que ocurren dentro de la banda son ignoradas
2) Lugar de próxima operación (cualquier lado):
Indica que la próxima operación puede ocurrir en cualquier lado del histograma
3) Lugar de próxima operación (lado opuesto):
Indica que la próxima operación debe ocurrir en el lado opuesto del histograma
4) Toma de ganancias (take profit):
Permite definir la desviación a favor para ejecutar una toma de ganancia.
No coloca una orden de compra en un punto distante, en su lugar mira hacia atrás y si el desplazamiento cumple con la desviación esperada se ejecuta la toma de ganancia
5) Control de pérdida (stop loss):
Permite definir la desviación en contra para ejecutar una parada de pérdida.
No coloca una orden de parada en un punto distante, en su lugar mira hacia atrás y si el desplazamiento cumple con la desviación esperada se ejecuta la parada de la pérdida
Como usarlo:
Presione la opción "Indicadores", ubíquese en el segmento "Libreria Publica", escriba el nombre "MACD-Extendido-Estrategia por Neil", haga doble clic sobre el registro en cuestión y lo tendrá agregado en su panel de trabajo, ahora, solo resta usarlo para identificar las entradas y salidas y puede hacerlo de forma visual o definiendo las alertas de notificación automática.

Full Crypto Swing Strategy ALMA Cross with MACDThis is a full crypto swing strategy designed.
From my testing it looks like it perform the best on timeframes 4h +.
The below example has been adapted to BNB/USDT, using the entire period since 2017 until present day, with a comission of 0.03% ( which is the comission for the futures on binance).
Its components are :
ALMA Fast
ALMA Slow
MACD Histogram
Rules for entry
For long, we have a crossover of the fast alma with the slow one and the histogram is ascending.
For short, we have a crossunder of the fast alma with the slow one and the histogram is descending.
Rules for exit
We exit based on a risk management system for TP and SL, or when we receive an opposite condition than the initial one.
Regarding risk management
0.05 = 5% movement
2 = 200% movement
0.001 = 0.1% movement
If you have any questions, let me know !

Ultimate MACD Strategy [PrismBot] [Lite]Included in this Ultimate MACD Lite Strategy:
✔️ Tweak a multitude of specific settings (MA lengths, R:R, SL distance etc)
✔️ Enable advanced setup filters
✔️ Use money management and risk calculations
✔️ Draw trade info directly to chart (eg. SL size in percent, win rate etc)
✔️ Use various filters (eg. time filter, date filter, MA slope angle etc)
✔️ Manage risk per position when auto-trading forex through AutoView
✔️ Choose from various alert conditions!
✔️ Sync to any bot or algorithmic trading system
Some details about this strategy:
LONG SIGNAL
When the MACD is below the zero line of the histogram, close is above the 200EMA, and the MACD line crosses above the signal line, longs are taken
SHORT SIGNAL
When the MACD is above the zero line of the histogram, close is below the 200EMA, and the MACD line crosses below the signal line, shorts are taken
A couple of options are given for how to calculator stop losses.
The Take profit is calculated by the risk of the stop loss. So a 1.5 take profit target is 1.5 times the stop loss added to the entry price.
There is also an option to filter out trades by the histogram deviation. This prevents crossovers that are too close to the histogram from being taken.
Please note I used the code for the PPO instead of the traditional MACD to make calculating these percentage deviations more consistent across multiple asset types.
You can easily enable and disable strategies using the checkbox.
This strategy incorporates a risk to reward system where the user can select between ATR and Percent based stop losses and take profit targets. This means that the user has much better control over money management when utilizing this strategy and it doesn't require you to babysit the strategy to ensure it's entering and existing strategies in an ideal place.
You can also enter custom messages for alerts for use with bots (set alerts to "alert() function calls only")

Crypto Scalper Divergence Macd Psar Ema 200This is a very efficient crypto scalper adapted to very short timeframes, however it can be optimized for other timeframes and assests as well.
Its components are
MACD
P SAR
EMA 200
Risk management
Rules for entry:
For short : we have an uptrend on PSAR , histogram is positive (divergence MACD) and close of a candle is below EMA 200
For long : we dont have an uptrend on PSAR, histogram is negative(divergence MACD) and close of a candle is above EMA 200
Rules for exit:
We exit when we either find a reverse condition than the entry one, or based on stop loss/take profit that are calculated on % movements of the price.
If you have any questions, let me know !

[VJ]Phoenix Force of PSAR +MACD +RSIThis is a simple intraday strategy for working on Stocks or commodities based out on PSAR, MACD , RSI and chop index . You can modify the start time and end time based on your timezones. Session value should be from market start to the time you want to square-off
Important: The end time should be at least 2 minutes before the intraday square-off time set by your broker
Comment below if you get good returns
Strategy: Entry Exits using PSAR and momentum and trend using MACD and RSI. A chop index is used as filtering
Indicators used :
Parabolic SAR is a technical indicator that is used to determine the price direction of stocks and it also draws attention to the traders when the price is changing
PSAR helps you:
Identify when a certain price trend is going to change direction
Indicate the most effective level at which to enter into the trade
Indicate the most effective exit point for the trade
Moving average convergence divergence (MACD) is a trend-following momentum indicator that shows the relationship between two moving averages of a security's price. ... Traders may buy the security when the MACD crosses above its signal line and sell—or short—the security when the MACD crosses below the signal line
RSI is intended to chart the current and historical strength or weakness of a stock or market based on the closing prices of a recent trading period.
Buying/Selling
When trading with the parabolic SAR, you would buy a market when the dots move below the current asset price and are green in colour. Alternatively, you would sell a market when the dots move above the current asset price and are red in colour. We use MACD , RSI to ensure that a right trade is picked when PSAR gives an indication. CI is used to stay away from the range bound market as much as possible.
Usage & Best setting :
Choose a good volatile stock and a time frame - 5m.
MA length : 200
RSI threshold : 50
MACD: 12,26,9
There is stop loss and take profit that can be used to optimise your trade
The template also includes daily square off based on your time.

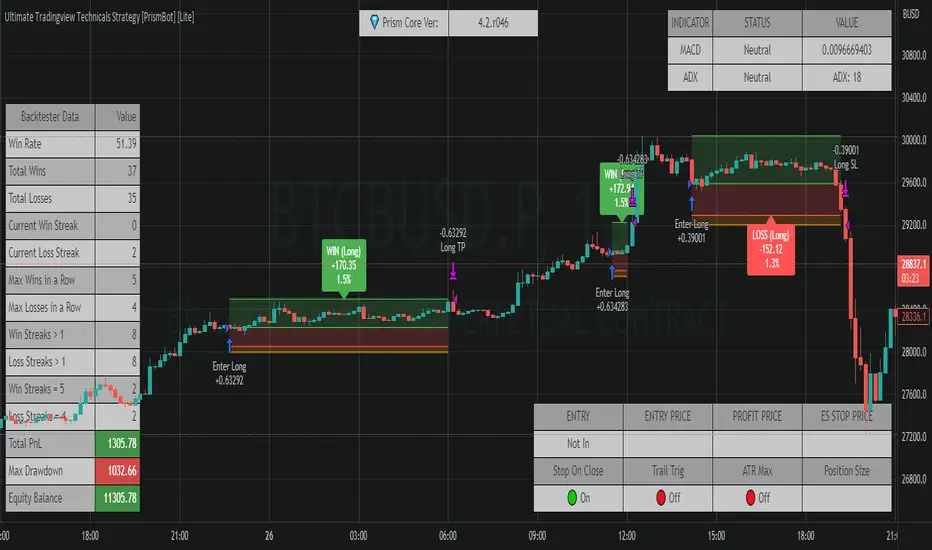
Ultimate Tradingview Technicals Strategy [PrismBot] [Lite]Included in this builder:
MACD
RSI
Tradingview Technical Analysis
Ichimoku
Global Trend Filter
Pullback Filter
Our most robust strategy to date with MACD , RSI , and many other basic strategies included as well as additional filters and alert options.
It is an advanced trading strategy built with the intent to make it easy for anyone to begin trading, but also avoid too much complication of strategy concepts.
For instance, you can change the MACD settings to be "more sensitive" by using a simple dropdown menu, and adjust which strategy you are employing with the MACD on the fly with another.
You can easily enable and disable strategies using the checkbox.
The strategy demo results use 100% equity per trade as an example - the reason for this is that the stop loss is set to 1%, so each trade is risking 1% (give or take slippage). Slippage is set to 5 ticks, and a 0.04% commission (Binance average for market and limit orders)
This strategy incorporates a risk to reward system where the user can select between ATR and Percent based stop losses and take profit targets. This means that the user has much better control over money management when utilizing this strategy and it doesn't require you to babysit the strategy to ensure it's entering and existing strategies in an ideal place.
The status box shows the current state of the various strategies and their values. A red circle indicates the filter / strategy is not valid for entry yet. A green circle indicates that filter / strategy is valid for entry. When all selected strategies are valid simultaneously, the next bar will trigger an entry signal.
If you have any questions about this strategy, please leave them in the comments below, or DM for more details. Thanks!
Additional features in this lite strategy:
✔️ Tweak a multitude of specific settings (MA lengths, R:R, SL distance etc)
✔️ Use money management and risk calculations
✔️ Draw trade info directly to chart (eg. SL size in percent, win rate etc)
✔️ Use various filters (eg. time filter, date filter etc)
✔️ Manage risk per position
✔️ Sync to any bot or algorithmic trading system
MACD, EMA, Know sure thing, Chopy Market StrategyHey there :)
This is the free version of the script. The following indicators / settings are missing:
- Support and resistance zones
- dynamic textboxes for alarms when using bots (3 Commas, Alertatron, etc.)
- a table showing the current position, indicators and other important information
With this script there is the possibility to completely customize the MACD . Starting with the MACD and signal line, the histogram and the color of the histogram.
Since the Pinecoders team has previously deleted the script, I will mention the fee settings in a bit more detail:
In this script a fee of 0.01% and a slipage of 15 was used. With each trade the total capital (100%) is used with a risk reward of 1 to 1.5.
The total capital, i.e. the risk, can be changed at any time under the "Settings" tab at "Equity".
I also added an EMA , the Know sure thing indicator and the Chopy Market indicator (by TradingRush) to the script to filter out bad trades.
The EMA:
Since the EMA is very reliable and shows whether there is an upward or downward trend, it should be used with the indicators in any case. It prevents long trades in downward movements and vice versa.
The KST Indicator:
The KST indicator has a similar movement as the MACD , but is by and large a bit more time delayed. It filters out false swings of the MACD and thus prevents bad trades.
The Chopy Market Indicator by Tradingrush:
The Chopy Market indicator, which was introduced by TradingRush in one of its videos, has the ability to detect sideways markets and block zones below this line for trades by means of a fixed value (the line).
To exit the trades, I added the following options:
ATR Exits. Exits based on past candles (lowest low, highest high).
Static exits based on set percentages.
In the next days I will create a tutorial for the script, just have a look on my profile.
If you have any questions about the script, let me know.

MACD, EMA, Know sure thing, Chopy Market - high adaptabilityHey there :)
This is the free version of the script. The following indicators / settings are missing:
- Support and resistance zones
- dynamic textboxes for alarms when using bots (3 Commas, Alertatron, etc.)
- a table showing the current position, indicators and other important information
With this script there is the possibility to completely customize the MACD . Starting with the MACD and signal line, the histogram and the color of the histogram.
Since the Pinecoders team has previously deleted the script, I will mention the fee settings in a bit more detail:
In this script a fee of 0.01% and a slipage of 15 was used. With each trade the total capital (100%) is used with a risk reward of 1 to 1.5.
The total capital, i.e. the risk, can be changed at any time under the "Settings" tab at "Equity".
I also added an EMA , the Know sure thing indicator and the Chopy Market indicator (by TradingRush) to the script to filter out bad trades.
The EMA:
Since the EMA is very reliable and shows whether there is an upward or downward trend, it should be used with the indicators in any case. It prevents long trades in downward movements and vice versa.
The KST Indicator:
The KST indicator has a similar movement as the MACD, but is by and large a bit more time delayed. It filters out false swings of the MACD and thus prevents bad trades.
The Chopy Market Indicator by Tradingrush:
The Chopy Market indicator, which was introduced by TradingRush in one of its videos, has the ability to detect sideways markets and block zones below this line for trades by means of a fixed value (the line).
To exit the trades, I added the following options:
ATR Exits. Exits based on past candles (lowest low, highest high).
Static exits based on set percentages.
In the next days I will create a tutorial for the script, just have a look on my profile.
If you have any questions about the script, let me know.
Forex bot full strategy with risk managementThis is a full strategy designed for forex major pairs, specially EUR/USD using 1h time frame chart.
Its components are
200 EMA
MACD
OBV
PSAR
RIsk management with tp and sl movements
Rules for entry
For long = Previous histogram from MACD was below 0 and current one is above 0. CLose of a candle is above EMA 200 , OBV oscillator is negative and we have an uptrend from PSAR
For short = Previous histogram from MACD was above 0 and current one is below 0. CLose of a candle is below EMA 200 , OBV oscillator is positive and we have an downtrend from PSAR
Rules for exit
For tp and sl values we calculate the distance from the close of candle until the psar values.
If you have any questions, let me know !

Forex scalper 2xEMA + SRSI + MACDThis is a forex scalping strategy designed for the most liquid pairs, like major forex pairs.
Its made of
1 EMA 50
1 EMA 100
Stochastic RSI
MACD
Rules
For long :close of the candle is above moving average 50, moving average 50> moving average 100, macd histogram is positive and cross over of stochastic rsi with the oversold level.
For short :close of the candle is below moving average 50, moving average 50 < moving average 100, macd histogram is negative and cross under of stochastic rsi with the overbought level.
Exit
For exit we have take profit and stop loss using fixed pip points.
For this example on EURUSD we use 20 pips for both tp and sl
IF you have any questions let me know !

Chaikin Money Flow + MACD + ATRHere I present you on of Trade Pro's Trading Idea: Chaikin Money Flow + MACD + ATR.
This strategy is not as profitable as it can be seen in one of his videos. In the forex market, the strategy could reach a maximum of 35% profitability.
I have, as some of my followers have requested, created an overview of the current position, risk and leverage settings in the form of a table.
Furthermore, one can again swap between short and long positions.
It is now possible to select or deselect individual indicators.
I have chosen the ATR alone as a take profit stop loss, as in his strategy.
A position is only triggered as soon as all prerequisites have been fulfilled and a command is executed. This prevents false triggering by bots and repainting.
-----------------------------------------------------------------------------------
How does the strategy work?
ENTRY
Long
The MACD indicator must be above the zero line.
Then the K line must cross the D line.
Finally, when this happens, the Money Flow Index must be above the zero line.
Short
Contrary to the premise of long positions.
EXIT
ATR Exit
The value of ATR at the time of buying is multiplied by the value entered in "Profit factor ATR" and "Stop factor ATR". As soon as the price reaches this value, it is closed.
Important
The script must be optimized for each coin or currency pair.
I will publish a guide to the strategy shortly. There I will explain how the table works and how to set the strategy correctly.
The results of the strategy are without commissions and leverage.
If you have any questions or feedback, please let me know in the comments.

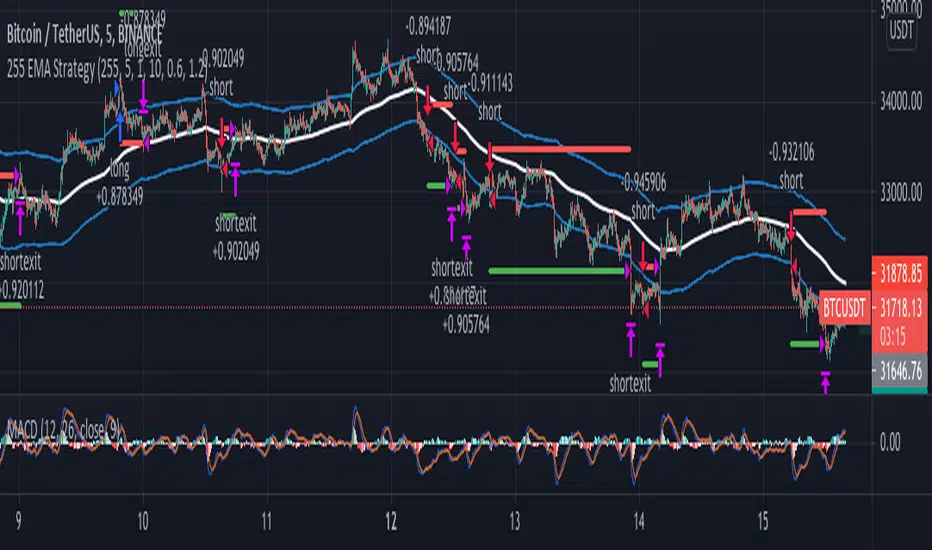
255 EMA Strategy//--- From 15 Trading Examples by Trader Alyx ---
// Seems like this strategy works better if we reverse the EMA filter logic.
// "Description: This basic scalping strategy allows you to enter the market based upon sentiment
// provided by the EMA, set at 255 periods. When price is trading below the 255 EMA, you would
// look to enter a LONG BUY positions, and when price is trading above the 255 EMA, you would
// look to enter a SELL SHORT position. The MACD lagging indicator will show you clear signals for
// when to do this. When the MACD lines cross in a bullish manner and price is below the 255
// EMA, buy. When the MACD lines cross in a bearish manner and price is above the 255 EMA,
// sell.
// NOTE: Make sure that price is trading away from the 255EMA before entering a LONG or SHORT
// position. As you can see in the chart below, the clearest signs for trade entry were presented
// when price was trading AWAY from the 255EMA"
MACD hist divergence strategy with switch v2
sum Macd hist to compare their strength,the DIAMOND means total strength , if the strength divergence, the trend may change
Macd 面積比較力度, 鑽石代表總力度, 力度背離即可能發生反轉
for the bullish market, I will suggest you to close the sw of buying energy divergence ex:btc
對於大牛市會建議您將買點能量背離關掉ex 比特幣
this strategy only have long order by now
目前此策略只支援做多
按鈕簡介
switch info
1.macd 面積背離時價格是否有背離的開關
1.A divergence switch btw price and MACD hist
2.macd 快線下穿0軸賣出的選項
2. Once MACD fast_line crossunder 0 stop loss switch
3.the setting logic and method is like this
設定如下
A1. 大牛股 for bullish market
B1. 高勝率低利潤 for high winning rate but lower profit
C1 高頻適合小級別 for high frq trading, useful in low period
D1 極小級別 for extremeness low period

MACD EMA - TradingRush StrategyHey there!
Today I present you a rather simple, but very profitable MACD strategy. Since I trade it with cryptocurrencies, the settings have been adjusted.
I discovered the strategy on a YouTube channel and tried to transfer it as a strategy into a script.
Tested with the crypto pair ETH/USDT in the 15 minute chart.
There is the possibility to switch between short and long positions.
-----------------------------------------------------------------------------------
How does the strategy work?
ENTRY
The MACD indicator must cross below the histogram. If it crosses when the price is below the EMA, only short positions are traded. Above the EMA - long.
EXIT
The Lowest Low (long) / highest high (short) serves as the stop loss. The TP is formed on the basis of a factor. (SL multiplied by factor 2.1 = TP).
The red lines are used to illustrate the SL. Above for short positions below for long positions.
The results of the strategy are without commissions and levers.
If you have any questions or feedback, please let me know in the comments.
If you need more information about the strategy and want to know exactly how to apply it, check out my profile.
I wish you good luck with the strategy!

All in One Strategy no RSI Label - For higher dollar cryptoThis is the All in One Strategy without the RSI suggestion label that will work well for any of the crypto currencies trading above $500 so the overlay shows up better. I am using ETH as an example on this.
Based on some comments on my previously published script that has been replaced I have added Alert Conditions to this version that can be used in other bots. You can also copy and paste these alert conditions into the other All in One script I published for the lower priced cryptocurrencies.
To use the alert conditions I have in here, you will need to convert this strategy into a study to do so. Delete the entry and exit logic at the end (lines 299 through 351), delete line 18 and paste the following in place of line 18:
study(shorttitle='Ain1 No Label',title='All in One Strategy no RSI Label', overlay=true, scale=scale.left)
Here are the settings to mimic what you see here in the back test strategy I am publishing. Remember that previous results do not guarantee future results.
Chart Time = 30 Minutes (if you didn't read my original All in One post, read it. Shorter isn't better. You lose your money faster in a shorter amount of time and I learned that the hard way)
Start Time = 1 April 2021 00:00
End Time = 31 December 2021 00:00
Trade Type = Long/Short
Stop Loss % = 20.1
Take Profit % = 14.57
RSI Length = 20
Overbought = 44
Oversold = 45
EMA Fast Length = 5
EMA Slow Length = 15
Overbought Lookback Minimum Value = 62
Overbought Lookback Bars = 3
Oversold Minimum Value = 43
Oversold Lookback Bars = 5
Source = Close
Max Lookback Period = 5
Use EMA Only = True (check the box)
K = 9
D = 17
K Mode = SMA
High Source = ohlc4
Low Source = ohlc4
Properties - Starting Amount is $3500, everything else is the same.
Any questions, feel free to ask. I will answer as soon as I can.

Technicals Rating Strategy v420Ichimoku, HMA, RSI, Stoch, CCI, MACD, Technicals Rating Strategy is a trading Bot that looks at these chosen indicators and assigns a value to each, then calculates the result of adding each indicators result value to a overall rating, which is then compared to a user set level. Here seen on Bitcoin, it has the broker fee included in the testing result. If you choose to use it on Forex etc, perhaps remove the broker fee which is unrealistic for FX trading.
It has a Win/Loss ratio of only 40% wins, but it catches the big moves and thats the main thing, so if ELON MUSK had of used this strategy instead of BUY and HOLD, he could of made 700% instead of 7% (as is, may, 2021)
Mainly intended for use as Automated TRADE BOT.
(imagine if Elon Musk did use this bot with his 1.3 billion $ worth of BTC, the drawdown would be like, half a billion or something haha (p.s.- use smaller lotsize % to get smaller drawdown, but then smaller profit....) )
For use with any pair and timeframe. In fact there is a timeframe setting to set the strategy to look at alternative timeframe from chart, but as default will just be set to charts timeframe.

MACD Signal with RSI Indicating StrategyThis strategy looks for MACD signal crossover and RSI confirmation of oversold/overbought condition.
Tune to your crypto/stock for best results using the strategy and sent an alert. Currently set up to use 25% of equity at each buy signal and will sell 1/3 of position at each sell signal. Initial investment is $1000, but adjust as necessary.
Currently tuned to DOGEUSD on 30min chart.
If you like/use/profit, follow me or shoot me a donation. If you are looking for a script design, I can help.

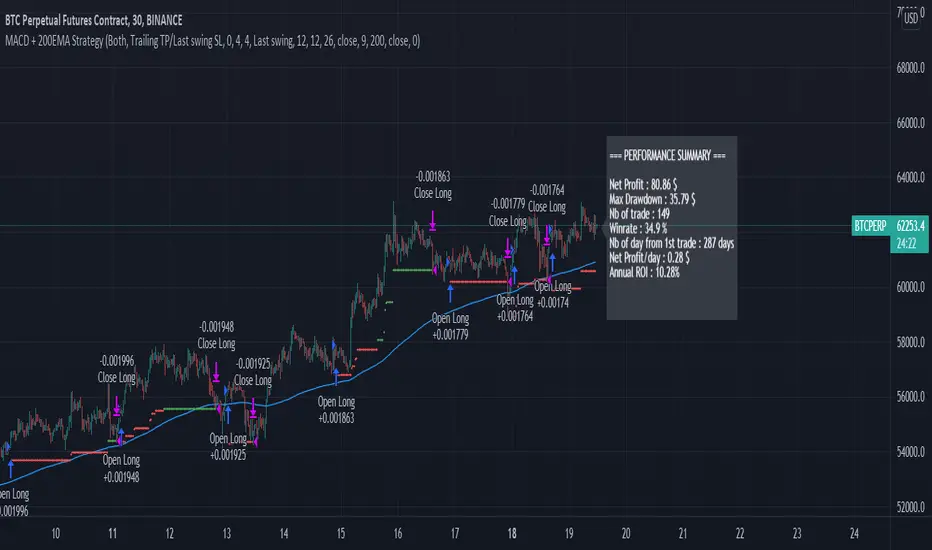
Simple MACD + 200EMA StrategyThis script is based on classic MACD / 200EMA strategy.
It takes a Long trade when MACD line crossup Signal line, when both below Zero line, and Close price above 200 EMA.
It takes a Short trade when MACD line crossdown Signal line, when both above Zero line, and Close price below 200 EMA
It seems to have decent results with 1:1.5 Risk/Reward, with 30min TF (on cryptocurrency market)
It has a number of 1 per day on average.
FEATURES
ORDERS
You can have both Long and Short, or disable one.
STOPLOSS
Stoploss is based on last swing (high or low). You can adjust the lookback period of the swing.
TAKE PROFIT
For now, there is 2 possibilities for TP :
Using adjustable Risk/Reward ratio (Trailing Stoploss need to be at 0)
Using adjustable Trailing Stoploss percentage (RR Ratio need to be at 0)
Results below are with this parameters :
Start date 01/01/2021
1:1.5 RR ratio
100USD Initial capital
100USD Order Size
0.01% Commission fees.
Sentiment OscillatorPrice moves when there are more market takers than there are market makers at a certain price (i.e. price moves up when there are more market buys than limit sells and vice versa). The idea of this indicator is to show the ratio between market takers and market makers in a way that is intuitive to technical analysis methods, and hopefully revealing the overall sentiment of the market in doing so. You can use it in the same way you would other oscillators (histogram crossing zero, divergences, etc). The main difference between this and most volume-weighted indicators is that the price is divided by volume instead of multiplied by it, thus giving you a rough idea of how much "effort" it took to move the price. My hypothesis is that when more volume is needed to move the price, that means bulls and bears are not in agreement of what the "fair price" should be for an asset (e.g. if the candle closes only a bit higher than its open but there's a huge spike in volume, that tells you that a majority of the market are starting to think the price is too high and they've started selling).
Methods of Calculation
1. Price Change Per Volume
The main method this indicator uses to reveal market sentiment is by comparing price change to the volume of trades in a bar.
You will see this calculation plotted in its most basic form by ticking the "Show Bar per Bar Change/Volume" box in the inputs dialog. I personally found that the plots were too noisy and cannot be used in real time reliably due to the fact that there is not much volume at the open of a new bar. I decided to leave in the option to use this method, in case you'd like to experiment with it or get a better grasp of how the indicator works.
2. Exponential Moving Averages
In my quest to smooth out the plotted data, I experimented with exponential moving averages. Applying an EMA on the change per volume data did smooth it out a bit, but still left in a lot of noise. So I worked around it by applying the EMA to the price change first, and then dividing it by the EMA of the volume. The term I use for the result of this calculation is "Market Sentiment" (do let me know if you have a better-fitting term for it ;-)), and I have kept it as an option that you can use in the way you would use other oscillators like CMF, OBV, etc. This option is unticked by default.
3. MACD
I left "Market Sentiment" unchecked as the default option because I thought an easier way to use this indicator would be as a momentum indicator like the MACD . So that's what I turned it into! I applied another EMA on the Market Sentiment, added a slower EMA to subtract from the first, and now we have a MACD line. I added a signal line to subtract from the MACD , and the result is plotted as a histogram... ish . I used area instead of columns for plot style so you don't get confused when comparing with a regular MACD indicator, but you can always change it if an actual histogram is more your taste.
The "histogram" is the main gauge of sentiment change momentum and it is easiest to use, that is why it is the only calculation plotted by default.
Methods of Use
As I have mentioned before, you can use this as you would other oscillators.
-The easiest way to use this indicator is with the Momentum histogram, where crosses over 0 indicate increasing bullish sentiment, and crosses below 0 indicate increasing bearish sentiment. You may also spot occasional divergences with the histogram.
-For the Market Sentiment option, the easiest way to use it is to look for divergences.
-And if you use the "Price Change per Volume of Each Bar", well... I honestly don't know. I guess divergences would be apparent towards the close of a bar, but in realtime, I don't recommend you use this. Maybe if you'd like to study the market movement, looking at historical data and comparing price, volume , and Change per Volume of each bar would come in handy in a pseudo-tape-reading kind of way.
Anyway, that's my explanation of this indicator. The default values were tested on BTC/USDT (Binance) 4h with decent results. You'll have to adjust the parameters for different markets and timeframes.
I have published this as a strategy so you can test out how the indicator performs as you're tweaking the parameters.
I'm aware that the code might not be the cleanest as I have only started learning pine (and code in general) for about a month, so any suggestions to improve the script would be appreciated!
Good luck and happy trading :-)

All in One StrategyTrue improvement over my previous script. This script adds in all of the complementary indicators, makes it truly easy to adjust the inputs, and has produced a real world net gain using the TradingView bots paired with any broker's API that is supported.
It has a selection for which strategy you'd like to use and due to limitations in Pine I cannot program in logic to make sure you only pick one, so you need to make sure you are only picking one.
To tweak the Connors option - it only depends on the RSI length variable, everything else is hard coded and tweaked for Crypto.
To tweak the MACD - play around with the min and max values of the RSI for lookback and the amount of candles to lookback. Then tweak the fast and slow MA lengths. I have found that a fast length of 3 or 4 and a slow length between 6 and 10 will yield the highest gains.
Also, when I was a young Noob I thought using a chart timeframe of 5 minutes was the best...no...no it wasn't. I lost my ass. Don't lose yours. I highly suggest sticking with a 30 minute timeframe, you will minimize losses caused by false triggers, have less trades and higher profits. More is not always better, trades that may sell one day and then buy six days later are normal. Leave it do its magic and you'll be very happy in the end.

MACD, RSI, & RVOL Strategy
This strategy combines the use of MACD (12, 26, 9), RSI (14, 30, 70), and RVOL (14) to create Long Buy and Sell signals. This works well with many different time intervals but was developed with 15-minute intervals in mind.
Using MACD as a reference, the strategy identifies when the MACD line crosses over (a factor in a buy signal) and under (a factor in a Sell signal) the Signal line. This shows a shift in positive (cross over) and negative (cross under) of a security.
Using the Relative Strength Index ( RSI ) as an indicator, the strategy notices when the velocity and magnitude of the directional price movements cross over the Oversold signal (30) and crosses under the Overbought signal (70) as a factor in creating a Buy and Sell signal.
Using Relative Volume (RVOL) as an indicator, the strategy calculates when the current volume has crossed over the 2x average volume indicator over a given period and is then used as a factor in creating a Buy signal. RVOL is also used when the change in volume crosses under a set RVOL number (in this strategy, it is set to a RVOL of 5).
RVOL = Current Volume / Average Volume over a certain period
This strategy indicates a Buy signal when 2/3 conditions are met:
- RSI Cross Over the Over Sold signal (default 30)
- MACD Cross Over of Signal ( MACD > Signal)
- RVOL Cross Over of 2 (RVOL > 2)
This strategy indicates a Sell signal when 2/3 conditions are met:
- RSI Cross Under the Over Bought signal (default 70)
- MACD Cross Under of Signal ( MACD < Signal)
- RVOL Cross Under 5 (RVOL < 5)
Enjoy and leave feedback!
