Liquidations Meter [LuxAlgo]The Liquidation Meter aims to gauge the momentum of the bar, identify the strength of the bulls and bears, and more importantly identify probable exhaustion/reversals by measuring probable liquidations.
🔶 USAGE
This tool includes many features related to the concept of liquidation. The two core ones are the liquidation meter and liquidation price calculator, highlighted below.
🔹 Liquidation Meter
The liquidation meter presents liquidations on the price chart by measuring the highest leverage value of longs and shorts that have been potentially liquidated on the last chart bar, hence allowing traders to:
gauge the momentum of the bar.
identify the strength of the bulls and bears.
identify probable reversal/exhaustion points.
Liquidation of low-leveraged positions can be indicative of exhaustion.
🔹 Liquidation Price Calculator
A liquidation price calculator might come in handy when you need to calculate at what price level your leveraged position in Crypto, Forex, Stocks, or any other asset class gets liquidated to add a protective stop to mitigate risk. Monitoring an open position gets easier if the trader can calculate the total risk in order for them to choose the right amount of margin and leverage.
Liquidation price is the distance from the trader's entry price to the price where trader's leveraged position gets liquidated due to a loss. As the leverage is increased, the distance from trader's entry price to the liquidation price shrinks.
While you have one or several trades open you can quickly check their liquidation levels and determine which one of the trades is closest to their liquidation price.
If you are a day trader that uses leverage and you want to know which trade has the best outlook you can calculate the liquidation price to see which one of the trades looks best.
🔹 Dashboard
The bar statistics option enables measuring and presenting trading activity, volatility, and probable liquidations for the last chart bar.
🔶 DETAILS
It's important to note that liquidation price calculator tool uses a formula to calculate the liquidation price based on the entry price + leverage ratio.
Other factors such as leveraged fees, position size, and other interest payments have been excluded since they are variables that don’t directly affect the level of liquidation of a leveraged position.
The calculator also assumes that traders are using an isolated margin for one single position and does not take into consideration the additional margin they might have in their account.
🔹Liquidation price formula
the liquidation distance in percentage = 100 / leverage ratio
the liquidation distance in price = current asset price x the liquidation distance in percentage
the liquidation price (longs) = current asset price – the liquidation distance in price
the liquidation price (shorts) = current asset price + the liquidation distance in price
or simply
the liquidation price (longs) = entry price * (1 – 1 / leverage ratio)
the liquidation price (shorts) = entry price * (1 + 1 / leverage ratio)
Example:
Let’s say that you are trading a leverage ratio of 1:20. The first step is to calculate the distance to your liquidation point in percentage.
the liquidation distance in percentage = 100 / 20 = 5%
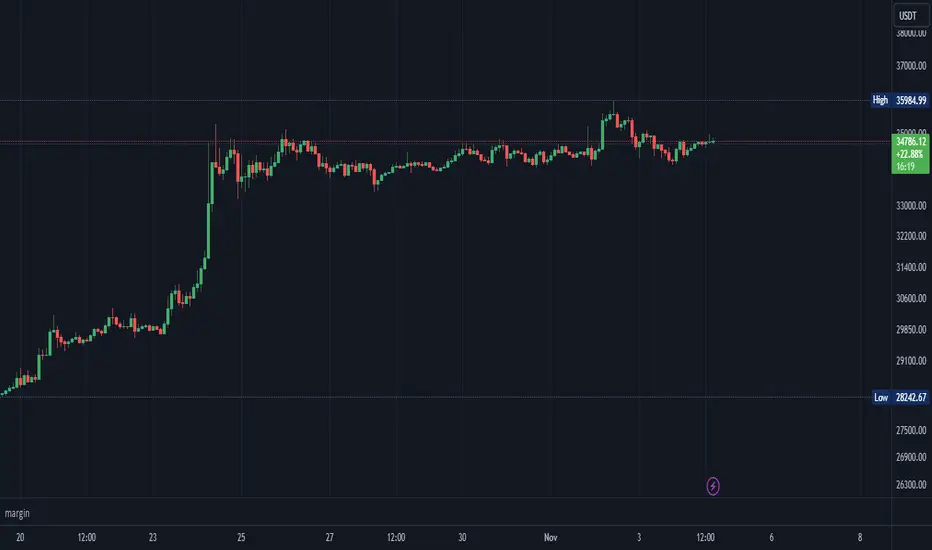
Now you know that your liquidation price is 5% away from your entry price. Let's calculate 5% below and above the entry price of the asset you are currently trading. As an example, we assume that you are trading bitcoin which is currently priced at $35000.
the liquidation distance in price = $35000 x 0.05 = $1750
Finally, calculate liquidation prices.
the liquidation price (longs) = $35000 – $1750 = $33250
the liquidation price (short) = $35000 + $1750 = $36750
In this example, short liquidation price is $36750 and long liquidation price is $33250.
🔹How leverage ratio affects the liquidation price
The entry price is the starting point of the calculation and it is from here that the liquidation price is calculated, where the leverage ratio has a direct impact on the liquidation price since the more you borrow the less “wiggle-room” your trade has.
An increase in leverage will subsequently reduce the distance to full liquidation. On the contrary, choosing a lower leverage ratio will give the position more room to move on.
🔶 SETTINGS
🔹Liquidations Meter
Base Price: The option where to set the reference/base price.
🔹Liquidation Price Calculator
Liquidation Price Calculator: Toggles the visibility of the calculator. Details and assumptions made during the calculations are stated in the tooltip of the option.
Entry Price: The option where to set the entry price, a value of 0 will use the current closing price. Details are given in the tooltip of the option.
Leverage: The option where to set the leverage value.
Show Calculated Liquidation Prices on the Chart: Toggles the visibility of the liquidation prices on the price chart.
🔹Dashboard
Show Bar Statistics: Toggles the visibility of the last bar statistics.
🔹Others
Liquidations Meter Text Size: Liquidations Meter text size.
Liquidations Meter Offset: Liquidations Meter offset.
Dashboard/Calculator Placement: Dashboard/calculator position on the chart.
Dashboard/Calculator Text Size: Dashboard text size.
🔶 RELATED SCRIPTS
Here are some of the scripts that are related to the liquidation and liquidity concept, for more and other conceptual scripts you are kindly invited to visit LuxAlgo-Scripts .
Liquidation-Levels
Liquidations-Real-Time
Buyside-Sellside-Liquidity
Leverage

Margin/Leverage CalculationMargin
This library calculates margin liquidation prices and quantities for long and short positions in your strategies.
Usage example
// ############################################################
// # INVESTMENT SETTINGS / INPUT
// ############################################################
// Get the investment capital from the properties tab of the strategy settings.
investment_capital = strategy.initial_capital
// Get the leverage from the properties tab of the strategy settings.
// The leverage is calculated from the order size for example: (300% = x3 leverage)
investment_leverage = margin.leverage()
// The maintainance rate and amount.
investment_leverage_maintenance_rate = input.float(title='Maintanance Rate (%)', defval=default_investment_leverage_maintenance_rate, minval=0, maxval=100, step=0.1, tooltip=tt_investment_leverage_maintenance_rate, group='MARGIN') / 100
investment_leverage_maintenance_amount = input.float(title='Maintanance Amount (%)', defval=default_investment_leverage_maintenance_amount, minval=0, maxval=100, step=0.1, tooltip=tt_investment_leverage_maintenance_amount, group='MARGIN')
// ############################################################
// # LIQUIDATION PRICES
// ############################################################
leverage_liquidation_price_long = 0.0
leverage_liquidation_price_long := na(leverage_liquidation_price_long ) ? na : leverage_liquidation_price_long
leverage_liquidation_price_short = 0.0
leverage_liquidation_price_short := na(leverage_liquidation_price_short ) ? na : leverage_liquidation_price_short
leverage_liquidation_price_long := margin.liquidation_price_long(investment_capital, strategy.position_avg_price, investment_leverage, investment_leverage_maintenance_rate, investment_leverage_maintenance_amount)
leverage_liquidation_price_short := margin.liquidation_price_short(investment_capital, strategy.position_avg_price, investment_leverage, investment_leverage_maintenance_rate, investment_leverage_maintenance_amount)
Get the qty for margin long or short position.
margin.qty_long(investment_capital, strategy.position_avg_price, investment_leverage, investment_leverage_maintenance_rate, investment_leverage_maintenance_amount)
margin.qty_short(investment_capital, strategy.position_avg_price, investment_leverage, investment_leverage_maintenance_rate, investment_leverage_maintenance_amount)
Get the price and qty for margin long or short position.
= margin.qty_long(investment_capital, strategy.position_avg_price, investment_leverage, investment_leverage_maintenance_rate, investment_leverage_maintenance_amount)
= margin.qty_short(investment_capital, strategy.position_avg_price, investment_leverage, investment_leverage_maintenance_rate, investment_leverage_maintenance_amount)
Trade Manager & Position Size Tool & PnL Tracker [AlgoScopes] V1Position size tool, leverage calculator, trade tracker, money management, trade presentation, risk reward management, margin position, live profit and loss, that's all in this one Trade Manager indicator.
The idea for this indicator comes from two years ago when I was helping a friend who, at the request of 15-20 members from our telegram group, wanted to create a paid group and share our ideas for trade with them (it started as an experiment for just a month or two and ended with 15 months with over 500 trading ideas and signals, with a complete TA chart). If I had time to create this indicator back then for members, it would have been much easier for them to be able to understand and follow the trade idea that was presented through a classic chart, with all the things that a TA must have:
Entry (as well as the reason for entry),
Stop (where the idea for the trade is no longer valid),
Target (with the reason why it is the target for that trade),
Take profits (taking part of the profit on the way to the target).
The majority of members still did not understand how much position to trade, what is the possible profit or loss, if the margin trade is how much leverage to use, in one word “money management”. The most important rule that every trader must follow is "Plan your trade and trade your plan". Learn money management and you are halfway there to becoming a successful trader. It is only after all that, you learn to use some of the "holy grail" indicators. When you have mastered those first two rules, find and master your favorite indicator or trading style (the most important thing is to stick to those two rules). The margin | leverage is also included in the script, for which there are so many dilemmas, arguments and discussions. (that many who still do not understand margin, would trade that it is not passionate if it is controlled). Too much for an introduction, especially since this indicator has so much to explain.
Most importantly, this is an invite-only indicator, and there are so many free indicators on tradingview that can also serve you very well. As far as I know, all exchanges have a calculator tool to calculate the possible profit and loss for each trade you plan to take.
*This indicator is not recommended for scalping on a 1min chart because the script, as you will see, is very complex, so the loading time is longer than with simpler indicators.
💠 ABOUT THE SCRIPT
This script is made to help manage trade. In this one indicator you have the possibility to do technical analysis, calculation for trade (four types: account size risk, trade investment, maximum to lose or position size), monitor 'PnL' (profit and loss in real time) do the calculation in the second, maybe local currency, and set an alert (from entry to any other change in trade). As the script is made for general use, some slight differences are possible for real time 'PnL' or 'ROI'. Always do a test before you start trading with larger amounts. The script is recommended for intra day trading and above. The script is not recommended for scalping on the 1min chart
💎 PROCESS TO ADD SCRIPT TO CHART
Possible trade on break example trade
As this script is invite-only, to add it to the chart you need to click on Indicators and find it under the 'Invite-Only' section. When you add the script to the chart (as it is interactive), you will be asked to do 4 steps.
🔸 'SET TRADE TIME'
Click on the chart where the last vertical bar is.
If you are already in the trade, then find the bar|time where the trade started
(you want to follow trade or trade presentation)
🔸 1) 'SET ENTRY'
Click on the horizontal level where you want to place the Entry
🔸 2) 'SET STOP'
Click on the horizontal level where you want to set the Stop
🔸 3) 'SET TARGET
Click on the horizontal level where you want to place the Target
💎 CONFIRM INPUTS
After you have done those 4 steps, a popup will appear with the relevant inputs for the trade.
You will see that some inputs are already filled (done in those 4 steps before, Entry, Stop and Target). You can correct them if you want (you will sometimes notice a longer 'space decimal' for the trade ticker, but this will not affect the calculator or other parts of the script). You can do the rest of the inputs for trade or finish it later when the script is loaded on the chart (it is recommended to fill in 'Trade Type' and 'Amount'. Don't forget to click on the "Apply" button to load the script on the chart.
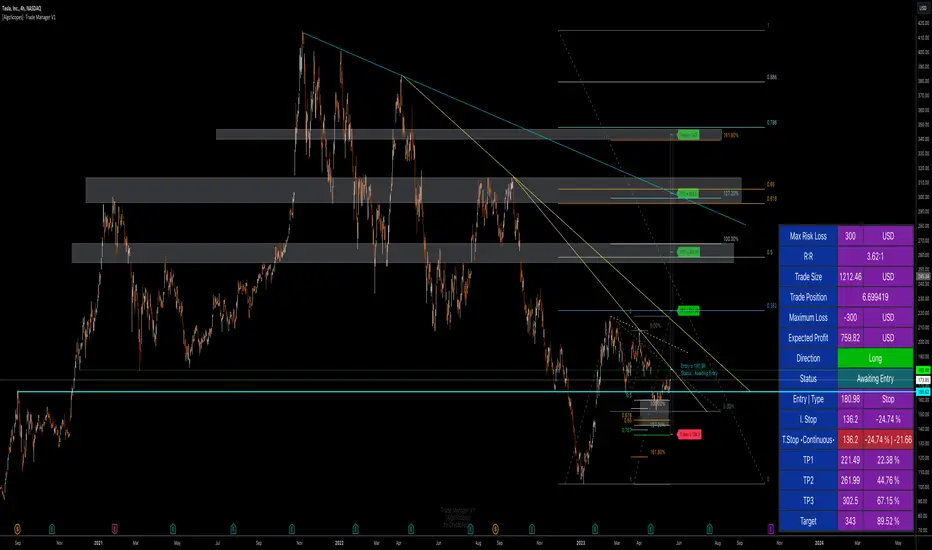
💎 INDICATOR LOADED ON CHART
• When the indicator is loaded on the chart (regardless of whether it is a new trade or a trade that has already started), the following items are displayed by default:
🔸 ' Trade Table ' shows all relevant information for the trade
🔸 ' Trade Box ' with lines for Entry, Stop and Target (Take Profits if enabled)
🔸 ' Trade Box Labels ' with relevant data
• The Entry label is also the trade status label, and if the trade is not active, by default it is the Entry color
If the trade is active or when a new trade reached Entry, several new things are noticeable:
• Entry|Status label as well as status row in table will change color as well as 'Entry Reached' text
• Several extra columns relative to trade will be added to the Entry|Status label
• 3 new columns will also appear on the Trade Table (Live PnL, Live min PnL and Live ROI)
• If Trail Stop is enabled, the label will change the text to T.Stop and change color depending on whether it is in loss or profit.
• If Trail Stop is enabled, inside Trade Box trail line it will follow price action inside the box, while the label will always be fixed at the initial level
• A vertical colored line will appear on the right side of the Trade Box (depending on whether the trade is in profit or loss) which shows as in the Trade Table like Live PnL
⚪ SETTINGS
💎 Trade Account Setup
🔸 ‘Trade Type’
• 'Account Capital' or portfolio (with combination '% Capital Risk')
• 'Investment' (how much you want to invest in the trade)
• 'Risk To Lose' (how much you want to risk losing)
• 'Position Size' (exact position size, units|share for trade)
🔸 ‘Account Type’
• If the account is in another currency or you want to see possible profit | loss in local currency
• Around 150 world and local currencies supported by ICE exchange
🔸 ‘Amount’
• Amount for ‘Trade Type’
🔸 ‘% Capital Risk’
• Only for ‘Account Capital’ trade type
(i.e. 10.000 account capital with ‘% Capital Risk’ 4 is 10.000 x 4% = maximum loss 400)
🔸 ‘Leverage’
• Enable|Disable for margin trade i size of leverage (maximum 125x)
(be sure to study how and when to use margin trade through the tutorial, because margin trade can be very dangerous. If you have not perfected margin trade, there is a great possibility of losing most or even all of your account capital).
💎 TRADE ENTRY & TARGET & STOP & T.STOP & DATE | TIME
🔸 ‘Trade Date & Time’
🔸 ‘Entry’
🔸 ‘Stop’
🔸 ‘Target’
• (all was set in the previous step but can be correct/adjusted if needed)
🔸 ‘Market Entry’
• Enabled will move Entry on that bar close
🔸 ‘Liquidation’ (enabled by default)
• Show ‘Warning’ if trade Stop is close or invalid (trade will hit liquidation before reached Stop level)
🔸 ‘Trailing Type’ (4 trailing stop type)
• ‘Disabled’ (Stop will stay the entire time at the initial stop level)
• ‘Continuous’ (I.Stop follow price by distance or percent when price reached Trail start level)
• ‘Stepped’ (I.Stop moves to previous level when price reached Trail start level)
• ‘Breakeven’ (I.Stop moves to Entry when price reached Trail start level)*
* (least one Take Profit enabled)
🔸 ‘Trailing Active’ (Entry, TP1, TP2 and TP3)
• Trailing stop starts level if ‘Trailing Type’ is enabled
🔸 ‘Trailing by’ (distance or percent)
• ‘Distance’ (T.Stop will follow price action by distance)
• ‘Percent’ (T.Stop will follow price action by percent)
(this is a good example to see the difference between trailing by initial distance and initial percentage)
🔸 ‘T.Stop Distance & Percent’ (initial distance and percent for table trade only)
• Useful for bot or exchange
🔸 ‘Stop, T.Stop, Target and TP’s in PIP’s’
• Distance in PIP’s
💎 TAKE PROFIT
🔸 ‘Split Target’ (enabled by default to three take profits (TP) with auto split)
🔸 ‘Number of Take Profits’ (up to three take profits)
🔸 ‘Type’ (auto or manual)
• For manual type fill all prices to preferred level. TP percent (TP1%, TP2% and TP3% ) and Target% is how much profit you want to take on a specific level.
• PLEASE NOTE sum of all enabled ‘TP’ and targets = 100 (e.g. two TP and sets TP1% to 25 and TP2% to 35, then Target% should be 40% i.e. 25 + 35 + 40 = 100)
💎 TRADE BOX & LINES
🔸 ‘Target Line’ (color for target line and trade table ‘direction’)
🔸 ‘Stop Line’ (color for initial line and trail line)
🔸 ‘Entry Line’ (color for entry line and label & table status)
🔸 ‘To Trade Time’ (‘trade box’ left vertical line)
• By default is set to trade date and time
• Unchecked will be moved to the last bar (live time)
🔸 ‘Extended Left’ (extend Entry, Stop, Target and TP’s lines to left)
• To check for possible support|resistance
🔸 ‘Size’ (Entry, Stop, Target and TP’s lines size)
🔸 ‘PnL Box Size’ (line size for vertical box lines)
🔸 ‘Offset’ (right vertical line offset from last bar)
🔸 ‘PnL Box Color’ (right vertical line and trail fill color)
• Color changes for profit & loss
🔸 ‘Box Line Color’ (box base color)
💎 LABELS
🔸 ‘Stop & Target Labels’ (enable|disable stop and target labels)
• By default is set to small (tiny, small, normal, large, huge and auto option)
• Disabled will move all information on Entry|Status label
🔸 ‘Offset’ (label offset from trade box)
🔸 ‘Target Label’ (label color for target and all enabled tp’s)
🔸 ‘Stop Label’ (label color for initial stop and enabled trailing stop)
🔸 ‘Label Text’ (color for label text)
🔸 ‘Status Label Color’ (label table entry|status color when trade is not active)
🔸 ‘PnL’ (entry|status color for profit and loss)
🔸 ‘Size’ (by default set to normal, option tiny, small, normal, large, huge and auto)
🔸 ‘Risk to Reward’ (show risk to reward on labels)
🔸 ‘Extra Info’ (by default disabled, show extra related info for trade on labels)
• Useful if Trade Table disabled
🔸 ‘Close Trade Stats’ (by default disabled, show all info when trade is closed)
• By default is white text color for close trade stats label
💎 ALERTS
🔸 ‘Failed Trade’ (alert if price reached Stop before is active, reached Entry)
• Useful if trade need adjustment but it can also be left as it is
and alert is just warning
🔸 ‘New & Update Alert’ (alert when price reached Entry or change status to enabled Take Profits)
🔸 ‘Trade Closure Alert’ (alert when trade closed, reached Stop, Target or enabled Trail Stop)
• Alert can be in modified or default preset jSon format as well as in plain text format
• Place holders for creating alerts are :
{type}, {symbol}, {exchange}, {ticker}, {base}, {quote}, {timeframe}, {price}, {direction}, {entry}, {stop}, {tstop}, {tp1}, {tp2}, {tp3}, {target}, {tstopstatus}, {status}, {result}
* {type} placeholder is set to ‘Trade Active’, ‘Trade Update’ and ‘Trade Closed’
💎 TABLE DISPLAY
🔸 ‘Trade Table’ (enable|disable trade table)
🔸 ‘Position’ (by default set to bottom right with option bottom, middle and top with left, center and right)
🔸 ‘Size’ (by default set to normal, option tiny, small, normal, large, huge and auto)
🔸 ‘Full Table’ (by default enabled, disabled show small table without some info*)
* check picture for reference
🔸 ‘Presentation’ (by default disabled, hide all info related to PnL in trade currency)
• Useful if trade shared for presentation, hidden trade fiat|currency info)
🔸 ‘Header’ (color for trade table first row)
🔸 ‘Stats’ (color for trade table statistics row)
🔸 ‘Text’ (color for trade table text)
🔸 ‘Error’ (color for all errors if is made when trade is setup)
• Color for errors is for trade table and trade labels
🔸 ‘Fiat Price’ (by default enabled, show info for second fiat*
* if trade is in crypto and ‘quoted’ currency is not stable coin, like ETHBTC, or ‘Account Type’ is set to different currency
🔸 ‘Live Fiat Price’ (if ‘quoted’ currency enabled will show live exchange conversion)
🔸 ‘All Errors’ (enabled by default, show all error if trade setup is wrong)
• When error shows on trade, disabled this to see what|where is error
• Check below for more details
🔸 ‘Tool Tip (chart)’ (enabled show all tooltip on chart)
• Check below for more details
• When you are familiar with indicator, disable popup tooltip
💎 TOOLTIP
All possible tooltips have been added for easier understanding, especially for traders who are just learning how to place a trade. (when you perfect this indicator, you can turn off the tooltip in settings, and you can also normally use the lite version of this indicator, which does not contain all these futures)
🔸 ' Settings Tooltips’
🔸 ‘Chart Tooltips’
🔸 ‘Table Tooltips’
🔴 ERRORS
When you setup trade, not only a novice in trading, but also experienced traders can make a mistake and for this reason all possible errors are included in the indicator which will be shown on the chart by changing the color of the labels as well as on the trade table and in most of the cases and error text.
If the tooltip is enabled in the settings, you can see the reason for the error as well as the solution.
Here are some examples of possible errors.
Stay safe
PLAN YOUR TRADE AND TRADE YOUR PLAN
Risk Management GO8686: Stop Loss, Position Size & TargetFull Name: Risk Management GO8686: Stop Loss, Position Size & Target
What this indicator provides:
A dashboard to calculate Stop Loss, Position Size and Target, where users can customize Risk Management parameters in the setting.
Position Size: calculated from "initialCapital", "Leverage", "Max Loss", "feeMaker", "feeTaker".
Stop Loss Price: using pivots, default length is set to 3, with an extra ATR value controlled by "'Multiplier OF Extra ATR".
Target: calculated from entry price, risk reward, distance between entry and stop loss, fees
What the indicator does Not provides:
entries of positions: The Long/Short entries displayed are just MACD signal crossing zero, users can apply their own entry logic, by modifying ready2L / ready2S variables.
What the indicator does Not guarantee:
the integrity, timeliness, accuracy, and comprehensiveness of the data, calculation method, calculation results, etc.
Two types labels:
1. Automated labels: they are displayed when MACD signal crossing zero, use "Display History Labels" to toggle display or not.
2. Setup Manually label: located at the right side of the latest bar, to display results when users setup manually
The settings of the indicator:
"Toggle to Reload",
"InitialCapital", "Leverage", "Max Loss % per trade", "feeMaker", "feeTaker",
4 length inputs for Pivot, "Multiplier of Extra ATR for stop loss",
"Toggle To setup manually", "Toggle between Long / Short", "Entry Price, set manually", "Stop Loss Price, set manually", "Risk-Reward Ratio"
"Display History Labels"
---------- Disclaimer ----------
Before using or requesting access to the indicator, customers/users acknowledge that they have read and accepted that the indicator, any associated contents on all social medias and any communication with the indicator author, including but not limited to: product and service details, signals, alerts, data, calculation methods, calculation results, user manual, tutorials, ideas, videos, chats, messages, emails, blogs, tweets, etc. are provided solely for educational purpose and Not as financial advice. Customers/users understand and agree to use the aforementioned indicator and information at their own risk.
---------- Updates ----------
The latest updates override the previous content.
To activate a update, if it does not load as expected: close the indicator, save the chart, clear browser caches, restart the browser, reload the chart and apply the indicator to the chart.

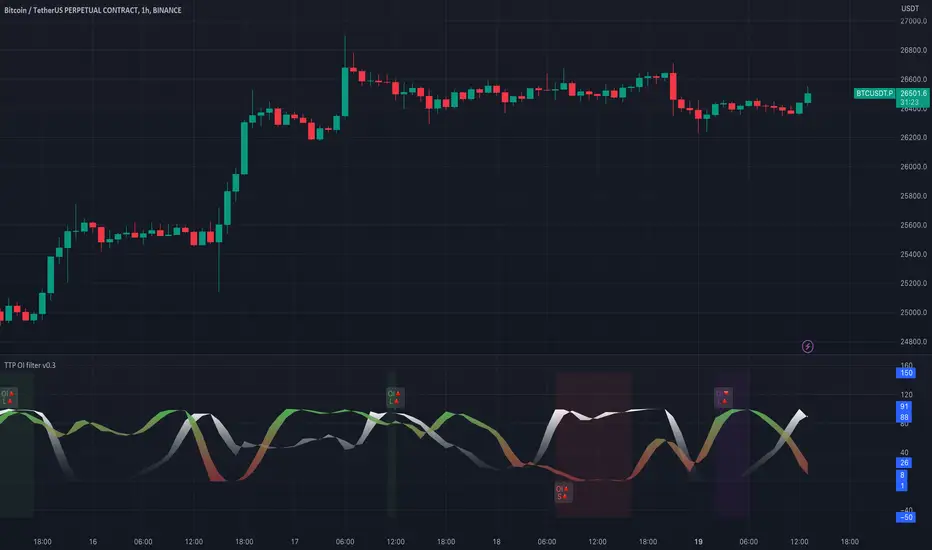
TTP OI + LS signal filterThis oscillator helps filtering specific conditions in the market based on open interest (OI) and the ratio of longs and shorts (LS) for crypto assets.
Currently it works with BINANCE:BTCUSDT.P but soon I'll be adding support for more assets.
It flags areas of interest like:
- Too many longs, too many shorts in the market
- Open interest too high or too low
It accepts an external signal as a source in which case filters can be applied to the original signal. For example the external signal might trigger and plot a 1 when RSI break below 70. By connecting such signal with this oscillator you'll be able to only pass-through the ones that occur when any of the areas of interest mentioned above are also valid.
If both filter are applied it acts as an OR. For example, if too many longs and too many shorts are active, it will pass through the signal in either condition.
The results of the original signal filtered is printed to be able to later use it in any external backtester strategy that accepts external sources too.
If external source signal is disabled it will trigger any time the combined filters are returning true.
Open interest and the ratio of longs/shorts is considered too high whenever the stochastic RSI calculation of the OI or ratio LS reaches a level above 80 and too low when below 20
The ratio of long/shorts is calculated by dividing the ratio of longs vs shorts from BITFINEX:BTCUSDLONGS and BITFINEX:BTCUSDSHORTS
Crypto Leverage Ratio [Market Cap / Open Interest in %]This indicator calculates what percentage of market cap data corresponds to open interest data.
Leverage Ratio = 1/(Market Cap / 100 * Open Interest)
Market Cap data comes from TradingView -> CRYPTOCAP:YOURCOINSYMBOL
Open Interest data comes from IntoTheBlock -> INTOTHEBLOCK:YOURCOINSYMBOL_PERPETUALOPENINTEREST
IntoTheBlock refresh perpetual data at the end of the day. It means there is no intraday data.
It can only be used in Daily or higher time intervals.
This indicator and any other indicator can not precisely calculate real leverage ratio except exchanges itself. This calculation is just based on assumption.
You can see the exact same result by just adding:
1/(CRYPTOCAP:BTC/100*INTOTHEBLOCK:BTC_PERPETUALOPENINTEREST)
to your symbol search, if your chart is a BTC chart.
"
The Futures Open Interest Leverage Ratio is calculated by dividing the market open contract value, by the market cap of the asset (presented as %). This returns an estimate of the degree of leverage that exists relative to market size as a gauge for whether derivatives markets are a source of deleveraging risk.
High Values indicate that futures market open interest is large relative to the market size. This increases the risk of a short/long squeeze, deleveraging event, or liquidation cascade.
Low Values indicate that futures market open interest is small relative to the market size. This is generally coincident with a lower risk of derivative led forced buying/selling and volatility.
Deleveraging Events such as short/long squeezes, or liquidation cascades can be identified by rapid declines in OI relative to market cap, and vertical drops in the metric.
-glassnode
"
says glassnode. I think it is more than that. Especially with MAs.

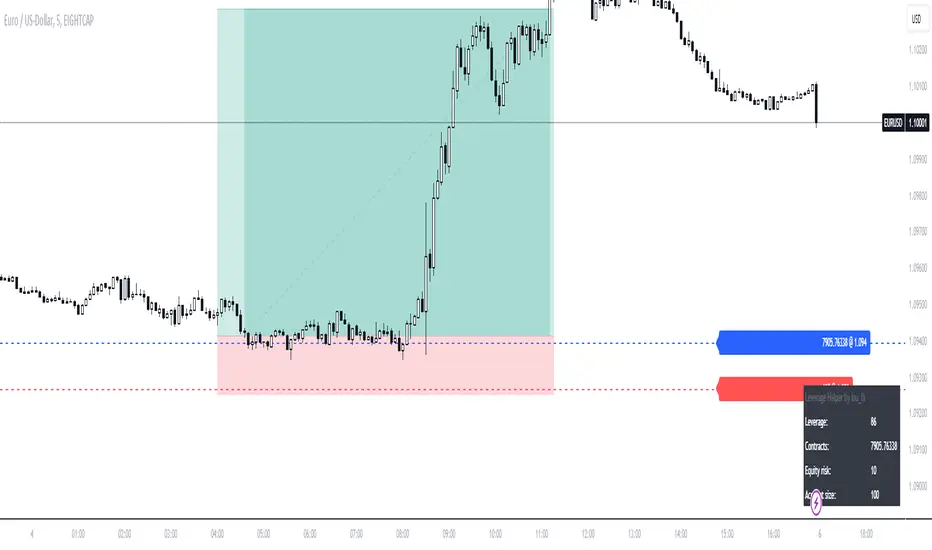
Leverage HelperCalculate position size & leverage the easy way!
- Drag & drop entry + stop loss level
- Input account size + risk size in the settings
- Calculation plotted on table
Liquidation Levels v2 [LG]The main premise of this indicator is to identify when large cryptocurrency futures positions are opened, and then plot the liquidation levels of those positions. Market makers know this data and tend to push price towards these levels, as there is guaranteed liquidity at or approaching those levels.
Remember, we want to buy when others are forced to sell, not when they want to sell, and vice versa. Whales want to position, but need to do so in areas of larger liquidity, as they want to minimize slippage and detection as much as possible.
This indicator is very useful during times of chop, when the market is taking liquidity anywhere it exists as whales are forcing retail players out of their positions.
This indicator will also plot where positions with a total value in excess of the user-defined threshold are opened or closed, so you are able to better gauge how market participants are reacting to price levels.
Commonly used leverage levels are 100x, 50x, and 25x, but can be adjusted by the user depending on what they are noticing is attracting price levels.
This indicator is recommended for use on the 1 minute chart of the Binance BTCUSD perpetual contract pair. This will allow for as much precision as possible for the majority of users. Note: The only supported coin at this point is BTC - other coins to follow soon.
SUMMARY
1) View liquidation levels of large positions opened
2) View exact moments where large positions are opened or closed
3) Gauge available liquidity to upside or downside to better assist in determining longer term reversal points
COMING SOON
1) Additional coins
2) VPVR inspired vertical histogram or other visualization tool summarizing total available liquidity at specific price level
3) Total delta of available long and short liquidity
4) Push notifications when price takes liquidity
5) Requests as outlined in the comments
This indicator was inspired by the Hyblock Capital liquidation levels and offers an improvement upon the popular existing Liquidation Levels indicator by mlapplications.

ATR / Volatility / Leverage [JoseMetal]============
ENGLISH
============
- Description:
This is a utility indicator, it prints a table with ATR for 3 custom timeframes, using the ATR of basis, it calculates volatility (%) and a recommended leverage depending on your risk settings.
I use this tool to determine the leverage for each asset and keep the same risk management for all of them.
- Visual:
It shows a table with ATR, volatility and leverage for 3 timeframes.
For each timeframe it also prints 2 periods, short and long, also customizable, so you can determine the range.
- Customization:
You can customize up to 3 different timeframes, ATR short and long length, as well as a multiplier.
There's a risk setting that you should tweak depending on your way to trade.
Everything else customizable (as usual in my scripts), colors, indicator settings etc.
- Usage and recommendations:
Default settings are my own, feel free to tweak them as you wish, i usually trade on 4H using 1-2% of my account balance per trade with low leverage, so you probably want to increase the risk setting, that's also extremely recommended if you trade forex and metals, because i trade crypto mainly.
Enjoy!
============
ESPAÑOL
============
- Descripción:
Este es un indicador de utilidad, muestra una tabla con ATR para 3 temporalidades personalizables, usando el ATR de base, calcula la volatilidad (%) y un apalancamiento recomendado dependiendo de tu configuración de riesgo.
Yo uso ésta herramienta para determinar el apalancamiento para cada activo y mantener la misma gestión de riesgo para todos ellos (no tiene sentido ir a 5x en BTC y 5x en ORO, por ejemplo... ésta utilidad resuelve ese problema).
- Visual:
Muestra una tabla con el ATR, la volatilidad y el apalancamiento para 3 temporalidades.
Para cada temporalidad también muestra 2 rangos de periodización, corto y largo, también personalizables, para que puedas determinar de un vistazo los rangos en los que se mueve.
- Personalización:
Puedes personalizar hasta 3 temporalidades diferentes, la longitud del ATR corto y largo, así como un multiplicador.
Hay un ajuste de riesgo que debes ajustar dependiendo de tu forma de operar.
Todo lo demás es personalizable (como es habitual en mis scripts), colores, configuración de los indicadores, etc.
- Uso y recomendaciones:
Los ajustes por defecto son los míos, siéntete libre de ajustarlos como desees, yo suelo operar en 4H utilizando el 1-2% del saldo de mi cuenta por operación con un bajo apalancamiento, por lo que probablemente quieras aumentar el ajuste de riesgo, eso también es muy recomendable si operas fórex y metales, porque yo tradeo cripto principalmente.
¡Que lo disfrutes!

LibIndicadoresUteisLibrary "LibIndicadoresUteis"
Collection of useful indicators. This collection does not do any type of plotting on the graph, as the methods implemented can and should be used to get the return of mathematical formulas, in a way that speeds up the development of new scripts. The current version contains methods for stochastic return, slow stochastic, IFR, leverage calculation for B3 futures market, leverage calculation for B3 stock market, bollinger bands and the range of change.
estocastico(PeriodoEstocastico)
Returns the value of stochastic
Parameters:
PeriodoEstocastico : Period for calculation basis
Returns: Float with the stochastic value of the period
estocasticoLento(PeriodoEstocastico, PeriodoMedia)
Returns the value of slow stochastic
Parameters:
PeriodoEstocastico : Stochastic period for calculation basis
PeriodoMedia : Average period for calculation basis
Returns: Float with the value of the slow stochastic of the period
ifrInvenenado(PeriodoIFR, OrigemIFR)
Returns the value of the RSI/IFR Poisoned of Guima
Parameters:
PeriodoIFR : RSI/IFR period for calculation basis
OrigemIFR : Source of RSI/IFR for calculation basis
Returns: Float with the RSI/IFR value for the period
calculoAlavancagemFuturos(margem, alavancagemMaxima)
Returns the number of contracts to work based on margin
Parameters:
margem : Margin for contract unit
alavancagemMaxima : Maximum number of contracts to work
Returns: Integer with the number of contracts suggested for trading
calculoAlavancagemAcoes(alavancagemMaxima)
Returns the number of batches to work based on the margin
Parameters:
alavancagemMaxima : Maximum number of batches to work
Returns: Integer with the amount of lots suggested for trading
bandasBollinger(periodoBB, origemBB, desvioPadrao)
Returns the value of bollinger bands
Parameters:
periodoBB : Period of bollinger bands for calculation basis
origemBB : Origin of bollinger bands for calculation basis
desvioPadrao : Standard Deviation of bollinger bands for calculation basis
Returns: Two-position array with upper and lower band values respectively
theRoc(periodoROC, origemROC)
Returns the value of Rate Of Change
Parameters:
periodoROC : Period for calculation basis
origemROC : Source of calculation basis
Returns: Float with the value of Rate Of Change
How to use Leverage in PineScriptI believe there are many friends who have been confused by the leverage problem of TradingView strategy, when backtesting, it is always unable to bring its own leverage, so it is impossible to do leverage sustained compounding, this key point, and many friends are looking forward to solve. In particular, the default_qty_value = 100, where 100 is the upper limit.
Here I have used the official RSI strategy for demonstration, using the qty to place orders. Through strategy.equity, leverage and close price, and rounding, directly calculate the specific number of contracts need to be opened.
I hope you can enjoy solving the leverage problem, and I look forward to your pointing out my problems and shortcomings to me. Thank you.

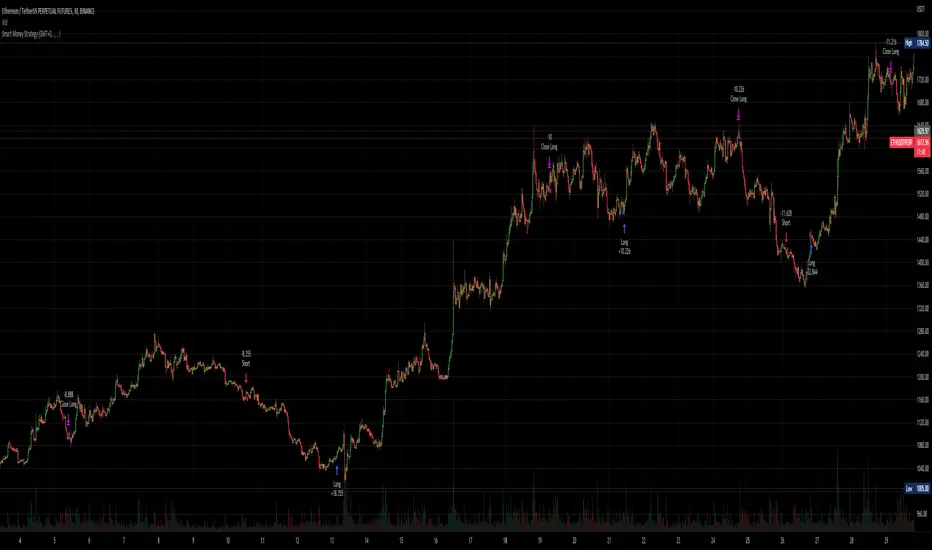
Smart Money - Oscillator and Volume StrategyOverview
This is a no-repaint strategy that is highly optimized for BINANCE:ETHUSDTPERP 30m, normal candles. It is a long/short strategy that is based on CMF, ADX/DMI, Keltner Channels, and other oscillators to identify smart money.
The overall idea of the strategy is to effectively capture the beginnings and ends of trends in price action, and go long/short accordingly. To achieve this, potential entry points are identified with various oscillators and these are then filtered using a variety of moving averages and strength/momentum indicators.
Short and sell inflections are found when ADX, DMI, and/or CMF oscillate below a specified threshold, and Keltner Channels are also used to indicate potential trades.
The indicator will continue to be updated and optimized for current and future market conditions.
If purchased, access to the indicator will be available within 24 hours.
Backtest Results
Parameters:
- 2021-01-01 to present (19 months)
- 100% equity order size
- 0.04% commission fees
- No leverage
17,089% net profit through 296 trades with 60.47% of trades being profitable.
Profit factor of 2.862, Sharpe Ratio of 1.158
Parameters:
- 2021-01-01 to present (19 months)
- $1,000 initial capital
- $1,000 order size
- 0.04% commission fees
- No leverage
584% net profit through 296 trades with 60.47% of trades being profitable.
Parameters:
- 2021-01-01 to present (19 months)
- 500% equity order size
- 0.04% commission fees
- 5x leverage
8,587,557% net profit through 299 trades with 59.87% of trades being profitable.
Leverage and contracts toolThis script is more like a tool than an indicator.
The script determinates the amount of contracts and the leverage needed to do one trade.
You must specify the following parameters:
Entry price
Stop Loss price
Stop Loss risk. It's the capital that you will loss if the price hit the SL price.
Operation equity. It's the whole capital involved in the operation.
No matter what side of operation is, it works in both ways (short and long).
To determine the levels could be useful use the short-long position tool of TradingView.

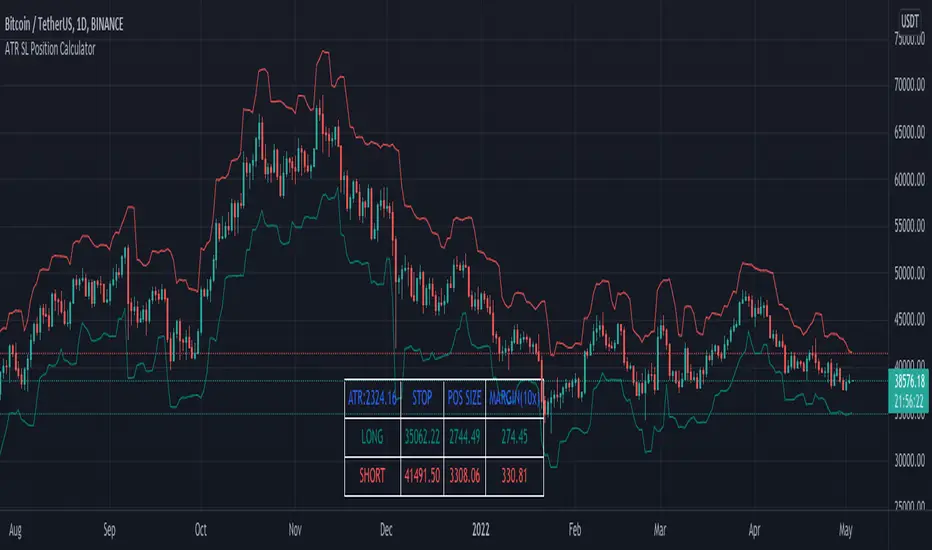
ATR SL + Position Size Calculator [DoctaBot]Props to @Veryfid for his original script 'ATR Stop Loss Finder'.
The concept is simple. We use the average true range to determine an appropriate stop loss distance based on recent volatility. The original script calculated the stop loss offset from the current candle's high or low. Here, I've added the option to offset stop loss from the recent local low or local high (a better way in my opinion).
I have also added a feature to automatically calculate position size by either dollar amount or as a percent of your account size to suit your risk profile (percent of account at risk per trade). This calculator supports use of leverage to calculate the amount of margin required to open desired position size.
Hulk Strategy x35 Leverage 5m chart w/Alerts This strategy is a pullback strategy that utilizes 2 EMAs as a way of identifying trend, MACD as an entry signal, and RSI and ADX to filter bad trades. By using the confirmation of all of these indicators the strategy attempts to catch pullbacks, and it is optimized to wait for high probability setups. Take not that the strategy is optimized for use on BTCUSDT along with 35 times leverage(Using leverage is risky). The Hulk Strategy waits for strong trend confirmation and then attempts to identify pullbacks using MACD and RSI. By using these it identifies strong short term movement against the trend(hence the name Hulk). To use the strategy wait for the strategy to make an entry, and then enter with a stop loss of 1.1% and a take profit of 1.35% with respect to if it is a long or short position. The trade frequency of this strategy is high as it is made for use on the 5m timeframe. But this does not mean you will have to be staring at your computer constantly as an average of 1 trade takes place each day. This will vary a lot though, somedays the strategy enters up to 4 times. I wish you good trading and hope that you like this strategy!
P.S. The indicators on my chart are visualizations of the indicators used in the strategy, they are not necessary for the strategy to work though. Also the colored in cloud on the price chart is an EMA cloud and it comes with the strategy when you add it to your chart. This EMA cloud consists of two EMAs a 50 and a 200 EMA.

Position Sizing CalculatorThis is an intuitive risk management tool with a minimalist design.
This calculator will determine your position size per trade, profit, loss, risk/reward ratio and leverage if any.
It will calculate your leverage if you are trading financial instruments e.g. Mini Futures , Turbo Warrants etc. that have a financing level.
Tip: Use this as a complement to the Long/Short Position tool.
Provide the following inputs to get a calculation:
- Position type
- Account balance
- Risk per trade percentage
- Financing level (if any for leveraged instruments), else let it be 0
- Entry price
- Target price
- Stopp loss price
You can also choose the color of the output text, its background and position in the chart window.
Enjoy!

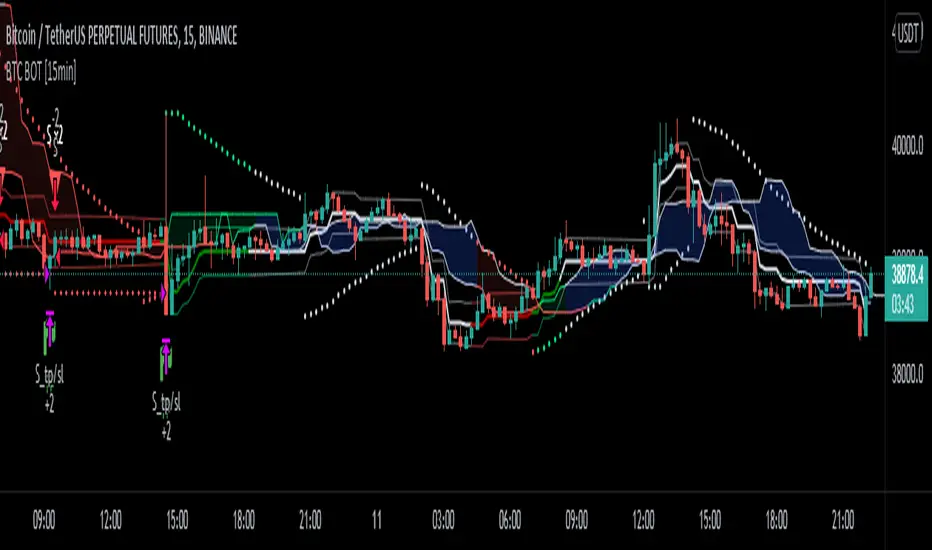
BTC Bot [15min] with AlertsThis is the Alert version of my BTC Bot {15min} Strategy.
This BOT is specialy designed for BTCUSDT 15 min Chart. It reacts to every Upward/Downward direction as fast as possible. It does not work well on higher time frame.
This BOT using 10 indicators to open a basic LONG/SHORT position.
1. CLOUD
2. TREND DETECTOR
3. TREND STRENGTH
4. PARABOLIC SAR
5. JMA
6. RANGE FILTER
7. ADX
8. TWAP TREND
9. FAST MA
10. MOMENTUM
This BOT also use 02 independent strategies for entering positions.
1. REVESALS ( RSI Crossovers)
2. SCALPING (It can increase net profit but it can be risky)
ADX is the main component of this BOT.
This is purely BTC 15min strategy but this BOT could be easily convert into Altcoins Scalper.

BTC BOT [15min]This BOT is specialy designed for BTCUSDT 15 min Chart. It reacts to every Upward/Downward direction as fast as possible. It does not work well on higher time frame.
This BOT using 10 indicators to open a basic LONG/SHORT position.
1. CLOUD
2. TREND DETECTOR
3. TREND STRENGTH
4. PARABOLIC SAR
5. JMA
6. RANGE FILTER
7. ADX
8. TWAP TREND
9. FAST MA
10. MOMENTUM
This BOT also use 02 independent strategies for entering positions.
1. REVESALS (RSI Crossovers)
2. SCALPING (It can increase net profit but it can be risky)
ADX is the main component of this BOT.
This is purely BTC 15min strategy but this BOT could be easily convert into Altcoins Scalper.
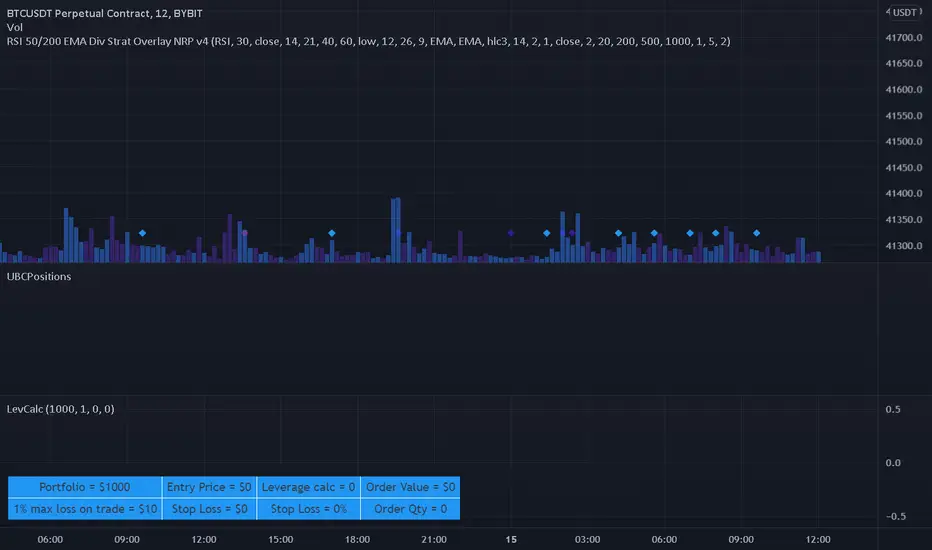
Leverage CalculatorThis script is intended to be used as a risk management calculator.
It will calculate the best leverage to use based on the maximum percentage of loss you are willing to incur on your trading portfolio.
Also calculates the order value and order qty based on your inputs.
Please note this calculator does not take into account any trading fees imposed by the exchange you are using.
*** Only risking 1% to 5% of your portfolio is considered good risk management ***
*** Not financial advice ***
------ Settings Inputs -----------------------------------------------------------------------------------------------------
"Portfolio Size" -- enter your portfolio balance
"% Willing to lose on this trade" -- enter the percent of your portfolio you are willing to lose if the stop loss is hit
"Entry Price" -- enter the price at which you will enter the trade
"Stop Loss Price" -- enter the price at which your stop loss will be set
----------------------------------------------------------------------------------------------------------------------------
------ Outputs -------------------------------------------------------------------------------------------------------------
"Portfolio" -- displays the portfolio balance entered in settings
"max loss on trade" -- displays the % loss entered in settings and the corresponding amount of your portfolio
"Entry Price" -- displays the entry price entered in settings
"Stop Loss Price" -- displays the stop loss price entered in settings
"Stop Loss %" -- displays the calculated percentage loss from the entry price
"Leverage calc" -- displays the calculated leverage based on your max loss and stop loss settings
"Order Value" -- displays the value of the order based on the calculated leverage
"Order Qty" -- displays the calculated order qty based on the calculated leverage
Elevated Leverage index System - ELiSELEVATED LEVERAGE index SYSTEM (ELiS) tries to solve the problem of adjusting meaningful leverage in futures and margin trading.
The biggest problem for traders is adjusting the leverage level manually.
Concerning about the volatilities it's very hard to set a meaningful leverage level.
ELiS includes 4 different volatility component which are:
1- nATR: Normalized Average True Range which is actually ATR/price to stabilize ATR's value differences when price changes are high on long term periods.
2- Standard Deviation
3- Kairi based nATR
4- Bollinger %B
which are scaled from 0 to 100 and takes different averages with different combinations & ratios and combines them as an index.
This index calculates an average volatility to set the true leverage level when trading futures especially in Crypto and FX markets.
There are 5 risk levels of "GEARS" like on automobiles to set the max leverage for risk management.
Gear 1 - CONSERVATIVE: max leverage level can be 20 for swing traders and beginners
Gear 2 - STANDARD: max leverage level can be 25 (default) for day traders
Gear 3 - AVERAGE: max leverage level can be 33 for day traders
Gear 4 - RISKY: max leverage level can be 50 for scalpers
Gear 5 - AGRESSIVE: max leverage level can be 100 for advanced scalpers
default length for ATR, Standard Deviation and %B are all 50
Simply:
When markets aren't volatile: ELiS indicateshigher leverage values to maximize profits.
When markets are volatile enough: ELiS indicates lower values to reduce risk level.
hope you all enjoy ELiS on profitable trades.

Ultimate ABC Reversal by @DaviddTechIn this indicator we are looking for HH & LL to create an ABC pattern.
Shorts are defined by an ABC pattern.
Short:
* Starting with a low to a Higher High
* Breaking that trend to a new low
* Creating a new Higher High (FOMO HH)
* If the price breaks below the previous HH we have our entry.
Longs:
* Starting with a Hight to a Lower Low
* Breaking that trend to a new high
* Creating a new Lower Low (FOMO LL)
* If the price breaks above the previous LL we have our entry.
Stop loss just above or below the FOMO LL/HH.
Take Profit using a Fib or Risk to Reward.
WARNING:
- For purpose educate only - My mission is to debunk fake strategies with code to find THE ONE.
- Plots EMAs and other values on chart.
- This script to change bars colors.
If you have any questions or feedback, please let me know in the comments.

Alferow_pnl_up_longThis script allows you to determine the leverage required to enter one position based on the set entry price, the price of the expected take profit, stop loss and risk per transaction. It also allows you to schedule this transaction for 5 possible transactions, with different shoulders and a martingale coefficient for each subsequent gain at the same risk, allowing you to qualitatively improve the pnl of the transaction with price fluctuations after entering the transaction. The script is designed for long positions.

money managementthis indicator has been designed to make your calculations easier and faster.
you can use this indicator to set tp and sl prices based on your entry price, balance,risk and leverage.
it has been designed only for cryptocurrency market and it is not recommended to use it in other markets!
1- enter your balance in the setting of the indicator.
2- enter risk percentage of your balance.
3- enter your sl percentage.
4- enter your tp percentage.
5- set your leverage if you are trading in futures market.
6- and at last set your entry price.
your position size both in spot market and futures market and the exact price of tp and sl , will be shown top right of the screen.
caution: before using this indicator in real market, please make sure that you understand this indicator's behavior and test it.
--------------------------------------------------------------------
این اندیکاتور برای تسریع محاسبات مدیریت سرمایه و سهولت رعایت آن طراحی شده است.
شما میتوانید با وارد کردن پارامترهاقیمت ورودی، سرمایه کل، ریسک و اهرم، قیمت حد سود و ضرر خود را محاسبه کنید.
همچنین اندازه حجم معاملات شما توسط این اندیکاتور محاسبه خواهد شد.
این اندیکاتور برای بازار کریپتوکارنسی طراحی شده است و استفاده از آن در سایر بازارها پیشنهاد نمیشود.
از بخش تنظیمات اندیکاتورمراحل زیر را انجام دهید:
1- میزان سرمایه خود را در قسمت بالانس وارد کنید
2- میزان ریسک سرمایه در هر معامله را مشخص کنید (به درصد)
3- میزان حد ضرر خود را مشخص کنید (به درصد)
4- میزان حد سود خود را مشخص کنید (به درصد)
5- عدد اهرم خود را وارد کنید
6- قیمت ورود به معامله را وارد کنید
توجه: قبل از استفاده این اندیکاتور در بازار لایو لطفا آن را تست کنید و از کارکرد صحیح آن با مدیریت سرمایه خود اطمینان حاصل فرمایید.
