Position Sizing CalculatorThis is an intuitive risk management tool with a minimalist design.
This calculator will determine your position size per trade, profit, loss, risk/reward ratio and leverage if any.
It will calculate your leverage if you are trading financial instruments e.g. Mini Futures , Turbo Warrants etc. that have a financing level.
Tip: Use this as a complement to the Long/Short Position tool.
Provide the following inputs to get a calculation:
- Position type
- Account balance
- Risk per trade percentage
- Financing level (if any for leveraged instruments), else let it be 0
- Entry price
- Target price
- Stopp loss price
You can also choose the color of the output text, its background and position in the chart window.
Enjoy!
Loss

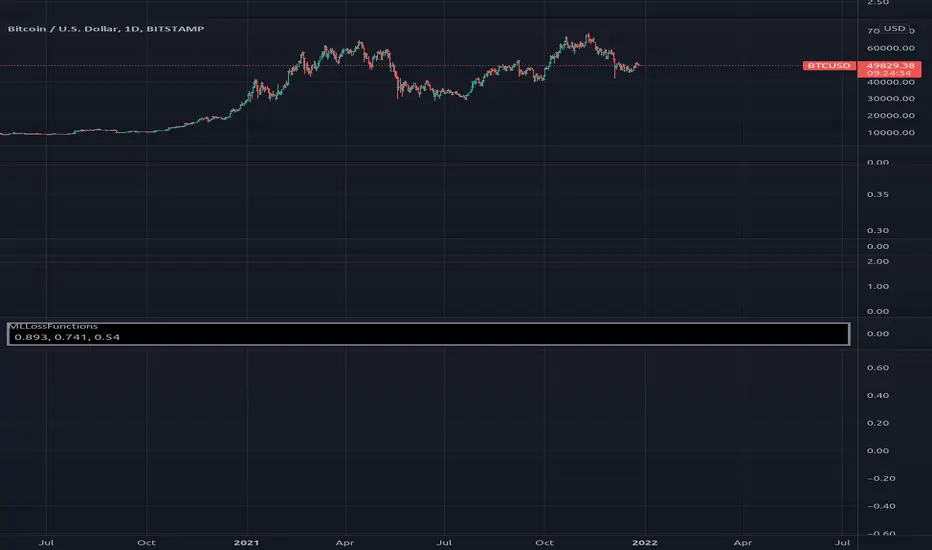
MLLossFunctionsLibrary "MLLossFunctions"
Methods for Loss functions.
mse(expects, predicts) Mean Squared Error (MSE) " MSE = 1/N * sum ((y - y')^2) ".
Parameters:
expects : float array, expected values.
predicts : float array, prediction values.
Returns: float
binary_cross_entropy(expects, predicts) Binary Cross-Entropy Loss (log).
Parameters:
expects : float array, expected values.
predicts : float array, prediction values.
Returns: float
Trailing Stop AlertsThis script is designed as an ATR-based trailing stop tool to assist in managing open positions.
Once you're involved in a profitable trade, if you add this script to your chart you'll be prompted to select a bar to begin trailing from.
You can then adjust the candle lookback distance for swing high/lows (7 by default), the ATR multiplier (1.0 by default), and the direction to trail (Long/Short).
You can also adjust the ATR period in the settings menu if you want to (14 period by default).
Once the script is added to your chart, it will begin drawing your trailing stop and you can then set up alerts.
Alert Options:
Any alert() function call : Will trigger an alert for both conditions (trailing stop updated, trailing stop hit)
Alert Conditions : Trailing Stop Update will trigger whenever the stop is updated, Trailing Stop Hit will trigger whenever the stop is hit.
Note: the alerts will only fire once per bar close and the trailing stop will not update on realtime bars.

Gain/StopLoss Percentage LinesGain/StopLoss Percentage Lines is a quick way to enter your Entry Price in to a stock and track the percentage of gain or loss at the 5% and 10% markers.
Click on the gear settings icon and type in your entry price. The percentage is defaulted to 5%. You can change this to a different percentage at this screen. Note that whatever number you enter will be doubled for the upper and lower lines. For instance, if you want to set your first red line stop loss and green gain line at 2.5%, your two other upper and lower green and red lines will be at 5%.
However, this will not change the text on the tab marker.
To change the tab text, go in to the Pine Editor and change the green text that says "5% Gain" and "5% Loss" to your new percentages.

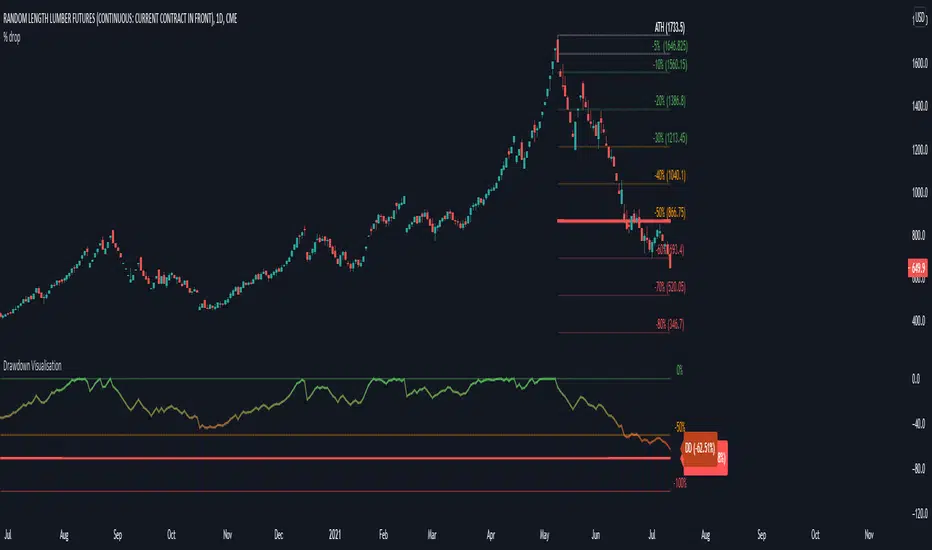
Drawdown VisualisationAn indicator that let's you visualize the current drawdown and maximum drawdown from an All-Time High
Moving Stop-Loss mechanism + alerts to MT4/MT5"How to code moving stop-loss mechanism", is one of the most often repeating questions in private messages I receive, so just to focus on this mechanism, I made a spin-off from my previous script: TradingView-Alerts-to-MT4-MT5-dynamic-variables-NON-REPAINTING .
The logic here moves the stop-loss each time a trade is running and a new pivot high/low is detected. When such event occurs (UpdateLongStopLoss or UpdateShortStopLoss), stoploss_long or stoploss_short mutable variable is modified. And it needs to be coded inside strategy.exit() line as "stop=stoploss_long" or "stop=stoploss_short". Entries are pretty straightforward - on Stoch crosses.
Last lines of the script show how to wrap information about such updates and send send alerts to MetaTrader via TradingConnector for execution in Forex/indices/commodities/crypto markets via MetaTrader. Please note that "tradeid=" variable must be passed with each alert, to let MetaTrader know which trade to modify. SLMOD, TPMOD are recently added commands, along with BE (as in "move stop-loss to breakeven" - but that's another topic).
Please disregard strategy backtest results, as this script is for coding education purposes only. However, it seems with the stop-loss mechanism enabled, the results are even better, than in original version of the script :)

Khair Day trade with profit lossBest used when applied for intraday trading. Users can customize length and deviation to fit their needs. Works best for high volatility stocks.
This strategy only works intraday intervals, so it means when you try to apply it to day/week/month it won't show any entry or exits.
Bollinger band breakout with non-standard deviation along with profit targets and stop loss.
There are 2 profit targets that can be adjusted based on individual preference.
This strategy minimizes risk and only opens trades when the probability of profitability is higher.

ATR Stop Loss FinderThis Indicator uses Average True Range (ATR) to determine a safe place to put stop losses to avoid being stop hunted or stopped out of a trade due to a tight stop loss. Default multiplier setting is 1.5. For a more conservative stop loss use 2 and for a tighter stop loss use 1. ATR and stop loss prices are displayed in table at bottom of screen. Use high(red) for shorts and low(teal) for longs.

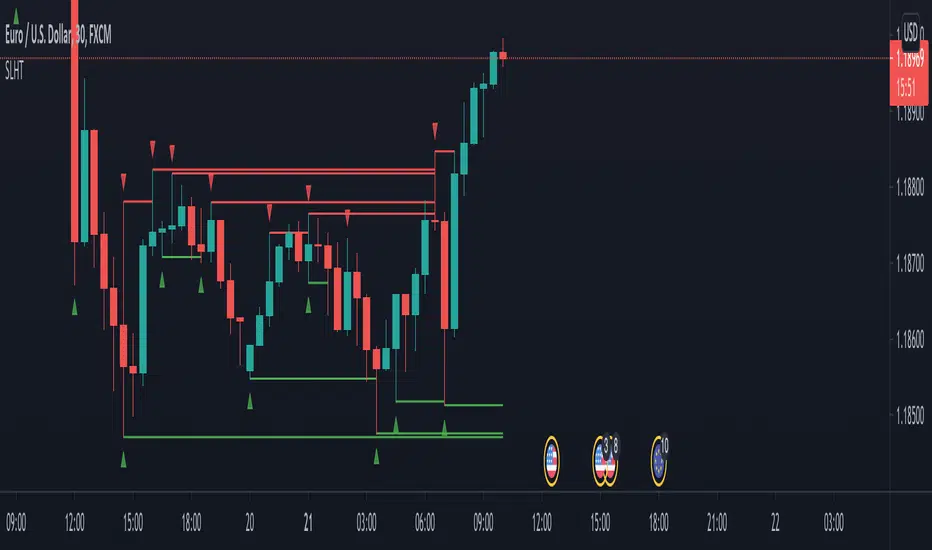
SL Hunter Tracker SL Hunter Tracker
coded by Bogdan Vaida
SL Hunter Tracker is a meticulous hunter that tracks SL hunters.
First it plots the fractals on the chart, then it draws lines from them
to the last wick that touched that height. You can add sweep alerts, once
per bar close, so that you get notified when a wick was touched.
Tested on: EURUSD 30'
Artharjan Profit & Loss CalculatorHi,
Artharjan Profit and Loss Calculator allows users to calculate Profit and Loss of their trades and see it on the chart itself
Users are supposed to select either Long or Short, Enter quantity and enter traded price. The live P&L will be plotted on the chart.
Happy trading :-)
Rahul

MultiPrice AlertThis is an alert script using Pinescript version 4. This enables one to set 5 alerts (1 StopLoss, 4 Targets), on 3 different symbols, at using a single alert in the UI.
Every visible line will only appear on the symbols that are selected. After setting targets when making an alert, select this indicator as a condition. Change the name to whatever you want, usually the names of the set of tickers.
The Alert message is dyanmic showing which Symbol with each type of alert, at whatever price.
Ability to disable the targets + symbols.
Alerts work by Stop Loss crossing under price and Targets Cross Over. Enabling the "Short" Targets reverses this.
The line that is being displayed is actually the price of the asset being moved over x number of bars. I have not found a way to plot a traditional horizontal line, as the code for it uses a fixed price.
As it being a user input, it is a variable. Any help with this would be appreicated.
Alerts are set to once per bar.
Known bug that sometimes if the prices that you set are inside the current candle stick, then your alert will immeaditally fire, either change the timeframe or let it fire and wait fo
After a target is hit, I reccomend setting the alert to 0 and REMAKING the alert. You MUST REMAKE THE ALERT AFTER ANY CHANGES. This script WILL NOT CHANGE ALERTS AS YOU CHANGE SETTINGS.
TradingView Alerts are not this smart , at least I haven't found a way to do this yet.


Auto Stop
A simple script using the last three bars(including the current) and draws a line on the chart under that for an easy automated stop loss point

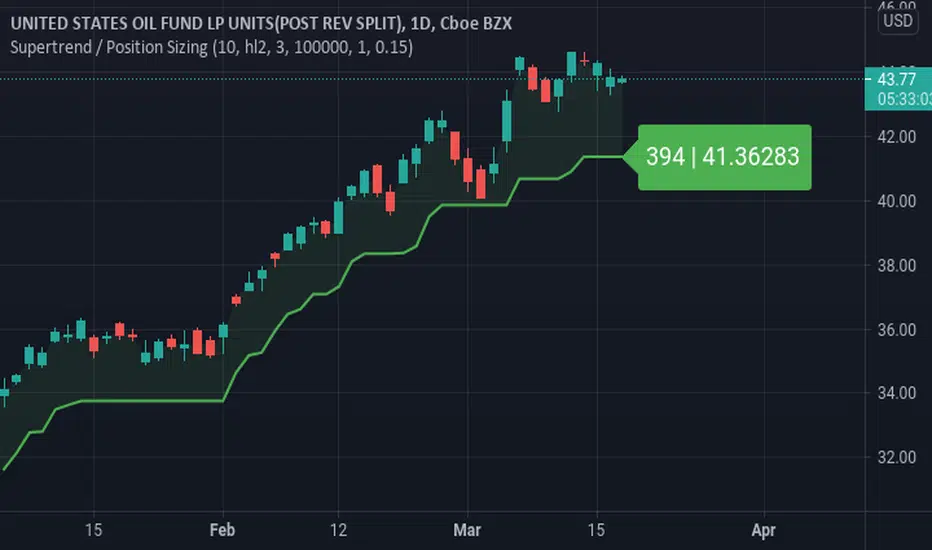
Supertrend / Position SizingSuperTrend with position sizing calculator.
This is based on SuperTrend by Kivanc. I only added the position size calculation and displaying the result.

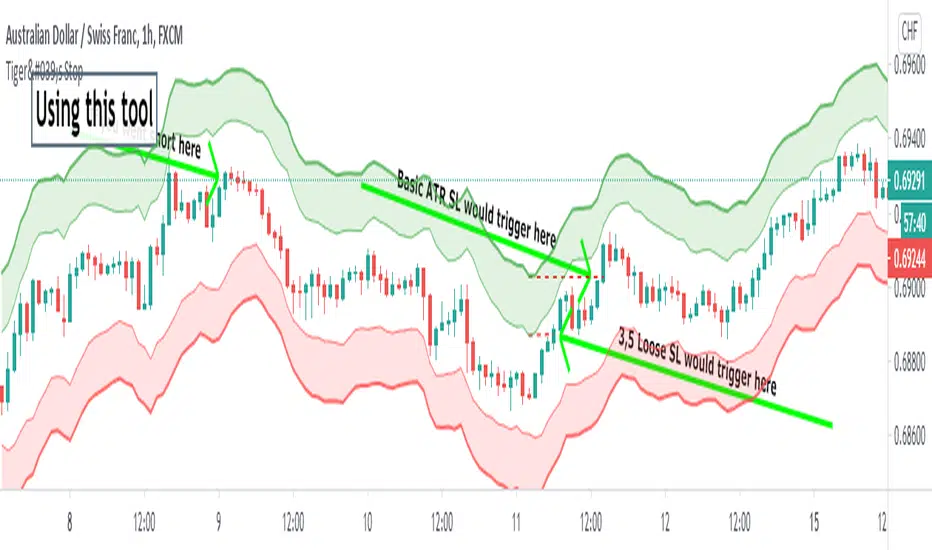
Tiger's Stop - Objective Stoploss SettingTrading is a lot about risk management too. I created this script to help with setting and moving a proper stop-loss. It plots an area that is a result of adding and subtracting both average true range and something I call "false range".
►The Average True Range is calculated as the candle's high-low. If there is a gap, it is added to complete the result.
►My own False Range just candle bodies. It is calculated as an absolute value of (close-open).
Then, Rolling Moving Average is applied on both ATR and False Range to get an idea of how far the price tends to extend out of pure randomness. The resulting value is multiplied by a Multiplier.
The next step is an addition of the values to the higher part of the candle for short or a lower part of the candle for long. I prefer a special calculation instead of using Highs and Lows because it allows for more precise observation and stop-loss set up for less wicky symbols.
►►►Additional Functions
• Smoothing - applies moving average to candles from which range distance is calculated. This can achieve good smoothness but higher values will lead to using outdated price in the SL area calculation.
• Enable/Disable - if you know the direction you are going to trade in, it is good to disable either Long Stop-Loss Area or Short Stop-Loss Area. Just untick it in the settings.
►►►Actual Using
Before using the script to set your stop-loss, check the historical data and find a similar set-up. Is it engulfing you use as a trigger? Find a different one and see how effective the stop-loss based on the ATR*multiplier was. This will help you to optimize Multiplier value. A picture shows such research for a double top. You should find more similar situations to find an optimal value.
Ultimately, the indicator still gives you relatively a lot of freedom with your stop-loss settings (at least, that is with the default settings). You need to decide how loose stop-loss you want to set. Average True Range is the furthermost part which will make for a very large stop-loss, on the other hand, False Range might be triggered by a villainous wick unnecessarily. The choice should depend on the specific symbol you trade and perhaps, you will learn to set stops regardless of the indicator.
A little trick : 1. You can set the loosest stop-loss and set a TradingView alert for where the tightest stop-loss would be. When alerted, you will get the opportunity to reconsider the trade and take a loss if needs be or exit if a candle closes there. 2. Mostly for cryptocurrencies, you can set the tightest stop-loss to protect yourself from sudden spikes. If the price approaches it slowly enough, you can move the stop-loss to the further part of the channel. This is not the same as moving stop-loss indefinitely with hopes of reversal if you plan it from the beginning and a smaller stop is meant to protect you from spikes that are not always predictable and drive to both directions.
►►►Advantages of trailing stop-loss
I usually stick with my original stop-loss instead of moving to break even. If my entry area was functional support once, it may work again and is, therefore, still a good entry zone. But an alternative used to preserve as much of the profit as possible is trailing.
Trailing is setting a specific value in ticks or a calculation of how to move the stop-loss whenever the price moves in your favor. Tiger's Stop can be used this way. Whenever there is a new value as the candle closes and that value is closer to price than your current stop-loss, you can update it. However, if it moves further from your price, don't change the stop-loss. This can be a little tiresome if you do it manually but should be worth the effort.
I usually start trailing only after the price moves significantly in my favor that allowing it to return to the entry price would not make any sense.
►►►Feedback and optimization
The preview chart is chosen entirely at random and the values are not optimized for any specific symbol. If you opt to use it, let me know which values work for you the best, I'll add it to the description when I update it.
Furthermore, let me know if you think any sort of alerts would be useful with my script.
Good luck!
Safe stop-loss (12h)Where to put your stop-loss to avoid accidental exit. Configure your risk level. If you are in a long position and significant profit, increase the parameters to reduce the risk of accidental exit.
Indicator - ATR Profit Loss - DGHi Traders,
This is an on chart indicator that can be used for setting take profit and stop losses very easily using the Average True Range Indicator (ATR). Using a volatility adjusted TP and SL will allow you to set your targets and losses based on market conditions. In the settings, you are able to adjust how much of a multiplier you require depending on your risk tolerance and strategy. For those that follow the NNFX method, the defult settings are preset to 1xATR TP and 1.5xATR SL.
How to use:
- For longs, 'isLong' box must be ticked, for shorts, this box is unticked
- For longs, green line is TP, red line is SL
- For shorts, red line is TP, green line is SL
Regards,
Dillon Grech

Anti-Volume Stop LossFINALLY!
As everyone who tried to create, understand, or even find the Buff Pelz Dormeier Anti-volume stop-loss indicator knows that - it's not easy. Personally, I have partially, or perhaps completely figured out, the tips Buff had given in Investing with Volume Analysis book.
AVSL now is ready.
Please do some test and give me a feedback how it works in your trade strategy.
Anti-Volume stop loss - AVSL
from Investing with Volume Analysis book CHAPTER 20 • RISKY BUSINESS 253-256:
"It is important in any risk-management process to predetermine an objective decision point level (a stop loss) to exit, thereby protecting principal in case you are wrong. My objective sell point is determined by using a quantitative formula I refer to as Anti-Volume Stop Loss (AVSL). Having a quantitative, yet intelligent sell point eliminates the emotional struggles involved in deciding when to exit a position.
AVSL is a technical methodology that incorporates the concepts of support, volatility, and, most importantly, the inverse relationship between price and volume. The AVSL combines the concepts of the VPCI (Volume Price Confirmation Indicator) and John Bollinger’s Bollinger Bands to create a trailing stop loss.
AVSL = Lower Bollinger Band – (Price, Length, Standard Deviation)
Where:
Length = Round (3 + VPCI)
Price = Average (Lows × 1 / VPC × 1 / VPR, Length)
Standard Deviation = 2 × (VPCI × VM)
One of the most difficult decisions is determining what one’s maximum loss threshold should be. Some say 2 percent; others say 20 percent. I believe the more volatile a security, the looser the stop should be. A nonvolatile security, such as Coca-Cola, might move 7 percent a year, while a volatile security such as Google might move 7 percent in a day. If you use a 7 percent stop for Coca-Cola, it might take a year to be stopped out while the security underperforms.
However, if you use 7 percent for Google, you can be stopped out intraday, not allowing the investment an opportunity to develop. By using the lower Bollinger Band of the securities lows, the AVSL considers each individual security’s own volatility. Thus, a volatile security would be granted more room of the stocks low while a stable security would have a tighter leash (see Figure 20.7).
The next important step is employing the price-volume relationship into the calculation. Volume gauges the power behind price moves. In accounting for this, when a security is in an uptrend and has positive volume characteristics, it is given more room. However, if the security exhibits contracting volume characteristics, then the stop is tightened. In this way, if a negative news event affects an unhealthy security, the stop is tighter, thus preserving more of your profits.
However, if the negative news event affects a security whose price-volume relationship is healthy, the stop has been loosened, avoiding the temporary whipsaw of an otherwise strong position. In these ways, AVSL lets the market decide when to exit your position.
AVSL tailors each security for support, volatility, and the pricevolume relationship based on an investor’s time frame as calculated from the chart data. For example, my portfolio positions are continually re-evaluated with this AVSL methodology, which yields the possibility of raising the decision point threshold periodically based on the time frame of my investment objective. With my short-term Giddy-up portfolios, I use daily chart data and seek to raise my maximum loss stop on a daily basis.
My intermediate ETF and stock positions are calculated off of weekly data and then re-evaluated weekly. With my longer term stock portfolios, the decision point is calculated off data revised monthly. This analytical approach that uses measurable facts over emotion or gut instincts allows me to maintain my objectivity. Thus objectivity, not emotion, informs my investment decisions."
How look mine AVSL:
Price component = low × 1/VPC × 1/VPR : for VPC > 1 and VPC < -1 | low × 1 × 1/VPR : for 1 > VPC > 0 | low × -1 × 1/VPR : for 0 > VPC > -1
AVSL Price = sma((low × 1/VPC × 1/VPR) , length) / 100
length = round : for VPCI > 0 | round [ absolute ] : for VPCI < 0 | 3 : for VPCI=0
Standard Deviation = mult × VPCI × VM)
AVSL = sma(Actual low price - AWSL Price + Standard Deviation, 26)
It's hard to say is it the same as in Buff Pelz Dormeier book, but I encourage you to modify the script for better results.

Stop Loss PanelHere is a label panel that shows the stop-loss number for Long or Short trades based on volatility using average true range and and a mult of that.

Triple ATR multiplier - 3 ATR Values in OneHere you can choose to plot 3 different ATR values in 1 window. I use this indicator to get the values of my stop loss and take profits.
You can change the multiplier value for each ATR Line and the length of the base ATR.
Ty

ATR with Take and StopThis simple indicator will plot the take profit and stop loss values based on the ATR indicator.
It's possible to set how many times the ATR value will be applied to the closing price and
what trade type is used, Long or Short.

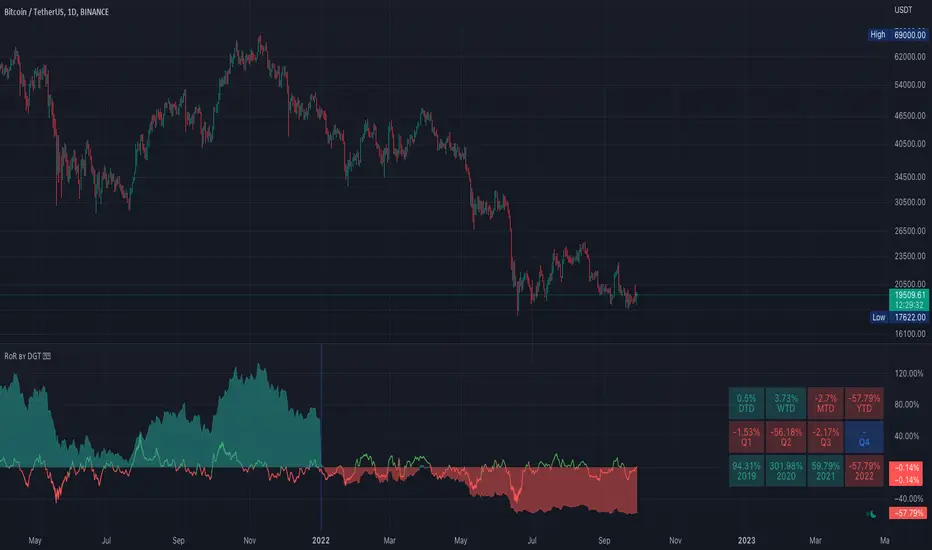
Rate of Return (RoR) by DGTA rate of return (RoR) is the net gain or loss of an investment over a specified time period, expressed as a percentage of the investment’s initial cost