Trade Decision MatrixTrade Decision Matrix (TDM)
Trade Decision Matrix (TDM) is a professional-grade, multi-phase market intelligence indicator designed to assist traders in understanding market structure, regime behavior, capital confidence, and execution readiness using a systematic, probabilistic framework.
This indicator does not generate trade signals. Instead, it provides a structured decision matrix similar to institutional trading desks, combining regime analytics, entropy confidence, Bayesian reliability, capital allocation logic, and scenario interpretation.
🔹 Core Architecture
TDM is built using a nine-phase institutional decision pipeline:
Phase 1 — Market Context
Spot–future basis, volatility normalization, and structural slope detection.
Phase 2 — Regime Engine
Probabilistic classification of Trend, Breakout, Range, or Mean Reversion environments.
Phase 3 — Orthogonal Model Cores
Independent statistical, trend, breakout, and mean-reversion cores.
Phase 4 — Bayesian Reliability Engine
Adaptive reliability scoring for each core using Bayesian reinforcement.
Phase 5 — Capital Engine
Capital confidence and capital mode based on opportunity quality, regime clarity, entropy confidence, and risk filters.
Phase 6 — Decision Matrix
Bias, participation level, and trade quality grading.
Phase 7 — Scenario Engine
Contextual scenario interpretation such as Trend Expansion, Breakout Failure, Range Compression, etc.
Phase 8 — Execution Gate
Execution readiness filter based on capital and model alignment.
Phase 9 — Reversal Engine
Probabilistic reversal risk estimation using multi-factor logic.
🔹 Regime Entropy Confidence
TDM uses Shannon entropy to measure regime uncertainty and converts it into a confidence score.
Lower entropy = higher regime confidence.
Higher entropy = unstable or transitional market state.
This prevents over-confidence in noisy conditions.
🔹 Institutional Commentary Engine
A professional commentary layer interprets all internal engines and outputs institutional-style guidance such as:
• Institutional Alignment
• Capital Protection Mode
• Regime Uncertainty
• Momentum Continuation
• Structural Breakout
• Volatility Coiling
• Reversal Risk Elevated
This commentary is designed for situational awareness, not signal generation.
🔹 Dashboard
The dark-theme dashboard provides a compact institutional decision panel:
• Regime
• Entropy Confidence
• Scenario
• Bias
• Strength
• Capital Confidence
• Capital Mode
• Trade Quality
• Execution State
• Commentary
• Reversal Risk
All values are color-coded with heat shading for instant visual interpretation.
🔹 How To Use
TDM is best used as a decision support layer alongside your own trading strategy.
Typical workflow:
Identify regime and entropy confidence.
Observe capital confidence and capital mode.
Check scenario and bias alignment.
Confirm execution readiness.
Monitor reversal risk before entering or holding positions.
This tool is ideal for:
• Intraday traders
• Swing traders
• Options traders
• Index traders
• Systematic discretionary traders
🔹 Important Notes
• This indicator does NOT produce buy/sell signals.
• It is a decision intelligence framework.
• It should not be used as a standalone trading system.
• Always apply personal risk management.
🔹 Disclaimer
This indicator is provided for educational and informational purposes only.It does not constitute financial advice or investment recommendations.Trading involves risk. Users are responsible for their own trading decisions.
Matrix

Wolfe Wave PatternHello All!
For a while now, some of my followers have been asking me to develop Wolfe Wave Pattern . Here it's at your service as open-source and public indicator.
How it works?
- On each bar/tick it checks zigzag waves by using base period and updates the array that is used to keep zigzag levels and locations. Base period in the settings is the minimum zigzag period
- Then it searches if there is new bullish/bearish Wolfe Wave pattern according to last wave direction
- Before searching the pattern it calculates all possible 1234 waves. So any wave in 12345 uses base period or higher. it means that it search all possible candidates. This algorithm is much better than using a few zigzag periods.
- After getting all possible candidates, it checks if any of the found candidates is suitable for Wolfe Wave pattern and keeps them in a matrix
- if there are suitable candidate(s) it shows the latest one and triggers the alert
- it also follows the targets and if the price hits any of the target it extends the line and trigger the alert
- it doesn't check if any of the patterns hits stop-loss.
Options:
Base Period: minimum period to create the zigzag
Error Rate: there are usually so few perfect patterns, so we better consider deviation. if error rate is low than it finds less pattern with more accuracy, if error rate is high than it finds more pattern with less accuracy
- The other options are used for coloring the patterns and lines
Some examples:
P.S. I didn't have enough time to test the indicator, so please drop a comment if you see any issue while using it
Enjoy!

ICT IPDA Liquidity Matrix By AlgoCadosThe ICT IPDA Liquidity Matrix by AlgoCados is a sophisticated trading tool that integrates the principles of the Interbank Price Delivery Algorithm (IPDA), as taught by The Inner Circle Trader (ICT). This indicator is meticulously designed to support traders in identifying key institutional levels and liquidity zones, enhancing their trading strategies with data-driven insights. Suitable for both day traders and swing traders, the tool is optimized for high-frequency and positional trading, providing a robust framework for analyzing market dynamics across multiple time horizons.
# Key Features
Multi-Time Frame Analysis
High Time Frame (HTF) Levels : The indicator tracks critical trading levels over multiple days, specifically at 20, 40, and 60-day intervals. This functionality is essential for identifying long-term trends and significant support and resistance levels that aid in strategic decision-making for swing traders and positional traders.
Low Time Frame (LTF) Levels : It monitors price movements within 20, 40, and 60-hour intervals on lower time frames. This granularity provides a detailed view of intraday price actions, which is crucial for scalping and short-term trading strategies favored by day traders.
Daily Open Integration : The indicator includes the daily opening price, providing a crucial reference point that reflects the market's initial sentiment. This feature helps traders assess the market's direction and volatility, enabling them to make informed decisions based on the day's early movements, which is particularly useful for day trading strategies.
IPDA Reference Points : By leveraging IPDA's 20, 40, and 60-period lookbacks, the tool identifies Key Highs and Lows, which are used by IPDA as Draw On Liquidity. IPDA is an electronic and algorithmic system engineered for achieving price delivery efficiency, as taught by ICT. These reference points serve as benchmarks for understanding institutional trading behavior, allowing traders to align their strategies with the dominant market forces and recognize institutional key levels.
Dynamic Updates and Overlap Management : The indicator is updated daily at the beginning of a new daily candle with the latest market data, ensuring that traders operate with the most current information. It also features intelligent overlap management that prioritizes the most relevant levels based on the timeframe hierarchy, reducing visual clutter and enhancing chart readability.
Comprehensive Customization Options : Traders can tailor the indicator to their specific needs through an extensive input menu. This includes toggles for visibility, line styles, color selections, and label display preferences. These customization options ensure that the tool can adapt to various trading styles and preferences, enhancing user experience and analytical capabilities.
User-Friendly Interface : The tool is designed with a user-friendly interface that includes clear, concise labels for all significant levels. It supports various font families and sizes, making it easier to interpret and act upon the displayed data, ensuring that traders can focus on making informed trading decisions without being overwhelmed by unnecessary information.
# Usage Note
The indicator is segmented into two key functionalities:
LTF Displays : The Low Time Frame (LTF) settings are exclusive to timeframes up to 1 hour, providing detailed analysis for intraday traders. This is crucial for traders who need precise and timely data to make quick decisions within the trading day.
HTF Displays : The High Time Frame (HTF) settings apply to the daily timeframe and any shorter intervals, allowing for comprehensive analysis over extended periods. This is beneficial for swing traders looking to identify broader trends and market directions.
# Inputs and Configurations
BINANCE:BTCUSDT
Offset: Adjustable setting to shift displayed data horizontally for better visibility, allowing traders to view past levels and make informed decisions based on historical data.
Label Styles: Choose between compact or verbose label formats for different levels, offering flexibility in how much detail is displayed on the chart.
Daily Open Line: Customizable line style and color for the daily opening price, providing a clear visual reference for the start of the trading day.
HTF Levels: Configurable high and low lines for HTF with options for style and color customization, allowing traders to highlight significant levels in a way that suits their trading style.
LTF Levels: Similar customization options for LTF levels, ensuring flexibility in how data is presented, making it easier for traders to focus on the most relevant intraday levels.
Text Utils: Settings for font family, size, and text color, allowing for personalized display preferences and ensuring that the chart is both informative and aesthetically pleasing.
# Advanced Features
Overlap Management : The script intelligently handles overlapping levels, particularly where multiple timeframes intersect, by prioritizing the more significant levels and removing redundant ones. This ensures that the charts remain clear and focused on the most critical data points, allowing traders to concentrate on the most relevant market information.
Real-Time Updates : The indicator updates its calculations at the start of each new daily bar, incorporating the latest market data to provide timely and accurate trading signals. This real-time updating is crucial for traders who rely on up-to-date information to execute their strategies effectively and make informed trading decisions.
# Example Use Cases
Scalpers/Day traders: Can utilize the LTF features to make rapid decisions based on hourly market movements, identifying short-term trading opportunities with precision.
Swing Traders: Will benefit from the HTF analysis to identify broader trends and key levels that influence longer-term market movements, enabling them to capture significant market swings.
By providing a clear, detailed view of key market dynamics, the ICT IPDA Liquidity Matrix by AlgoCados empowers traders to make more informed and effective trading decisions, aligning with institutional trading methodologies and enhancing their market understanding.
# Usage Disclaimer
This tool is designed to assist in trading decisions, but it should be used in conjunction with other analysis methods and risk management strategies. Trading involves significant risk, and it is essential to understand the market conditions thoroughly before making trading decisions.

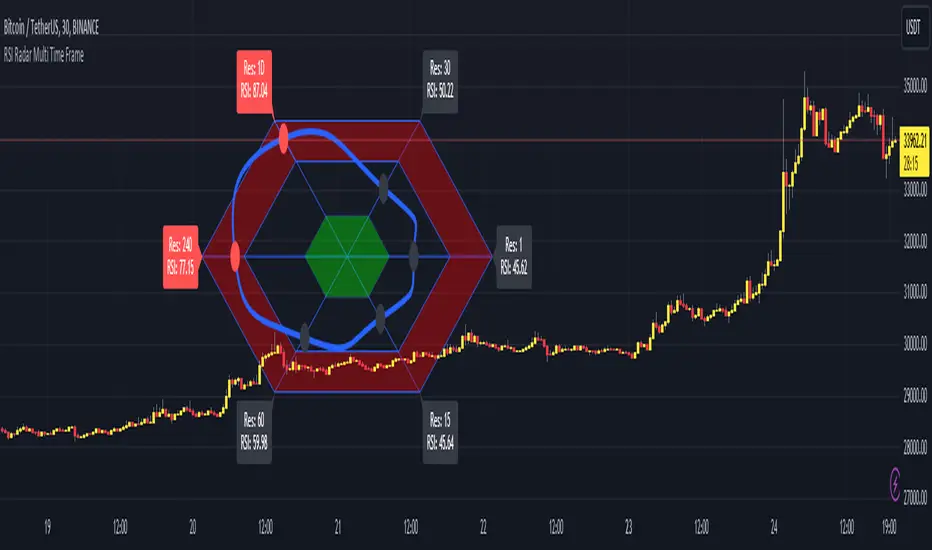
RSI Radar Multi Time FrameHello All!
First of all many Thanks to Tradingview and Pine Team for developing Pine Language all the time! Now we have a new feature and it's called Polylines and I developed RSI Radar Multi Time Frame . This script is an example and experimental work, you can use it as you wish.
The scripts gets RSI values from 6 different time frames, it doesn't matter the time frame you choose is higher/lower or chart time frame. it means that the script can get RSI values from higher or lower time frames than chart time frame.
It's designed to show RSI Radar all the time on the chart even if you zoom in/out or scroll left/right.
You can set OB/OS or RSI line colors. Also RSI polyline is shown as Curved/Hexagon optionally.
Some screenshots here:
Doesn't matter if you zoom out, it can show RSI radar in the visible area:
Another example:
You can change the colors, or see the RSI as Hexagon:
Time frames from seconds to 1Day in this example while chart time frame is any ( 30mins here )
Enjoy!
Crypto Correlation MatrixA crypto correlation matrix or table is a tool that displays the correlation between different cryptocurrencies and other financial assets. The matrix provides an overview of the degree to which various cryptocurrencies move in tandem or independently of each other. Each cell represents the correlation between the row and column assets respectively.
The correlation matrix can be useful for traders and investors in several ways:
First, it allows them to identify trends and patterns in the behavior of different cryptocurrencies. By looking at the correlations between different assets, traders can gain insight into the intra-relationships of the crypto market and make more informed trading decisions. For example, if two cryptocurrencies have a high positive correlation, meaning that they tend to move in the same direction, a trader may want to diversify their portfolio by choosing to invest in only one of the two assets.
Additionally, the correlation matrix can help traders and investors to manage risk. By analyzing the correlations between different assets, traders can identify opportunities to hedge their positions or limit their exposure to particular risks. For example, if a trader holds a portfolio of cryptocurrencies that are highly correlated with each other, they may be at greater risk of losses if the market moves against them. By diversifying their portfolio with assets that are less correlated with each other, they can reduce their overall risk.
Some of the unique properties for this specific script are the correlation strength levels in conjunction with the color gradient of cells, intended for clearer readability.
Features:
Supports up to 64 different crypto assets.
Dark/Light mode.
Correlation strength levels and cell coloring.
Adjustable positioning on the chart.
Alerts at the close of a bar. (Daily timeframe or higher recommended)

Volume Profile Matrix [LuxAlgo]The Volume Profile Matrix indicator extends from regular volume profiles by also considering calculation intervals within the calculation window rather than only dividing the calculation window in rows.
Note that this indicator is subject to repainting & back-painting, however, treating the indicator as a tool for identifying frequent points of interest can still be very useful.
🔶 SETTINGS
Lookback: Number of most recent bars used to calculate the indicator.
Columns: Number of columns (intervals) used to calculate the volume profile matrix.
Rows: Number of rows (intervals) used to calculate the volume profile matrix.
🔶 USAGE
The Volume Profile Matrix indicator can be used to obtain more information regarding liquidity on specific time intervals. Instead of simply dividing the calculation window into equidistant rows, the calculation is done through a grid.
Grid cells with trading activity occurring inside them are colored. More activity is highlighted through a gradient and by default, cells with a color that are closer to red indicate that more trading activity took place within that cell. The cell with the highest amount of trading activity is always highlighted in yellow.
Each interval (column) includes a point of control which highlights an estimate of the price level with the highest traded volume on that interval. The level with the highest traded volume of the overall grid is extended to the most recent bar.

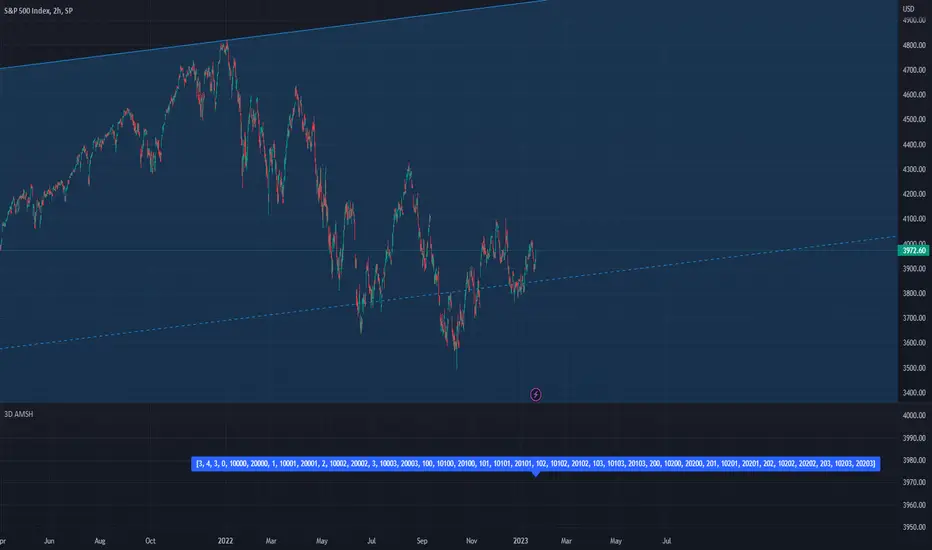
PSv5 3D Array/Matrix Super Hack"In a world of ever pervasive and universal deceit, telling a simple truth is considered a revolutionary act."
INTRO:
First, how about a little bit of philosophic poetry with another dimension applied to it?
The "matrix of control" is everywhere...
It is all around us, even now in the very place you reside. You can see it when you look at your digitized window outwards into the world, or when you turn on regularly scheduled television "programs" to watch news narratives and movies that subliminally influence your thoughts, feelings, and emotions. You have felt it every time you have clocked into dead end job workplaces... when you unknowingly worshiped on the conformancy alter to cultish ideologies... and when you pay your taxes to a godvernment that is poisoning you softly and quietly by injecting your mind and body with (psyOps + toxicCompounds). It is a fictitiously generated world view that has been pulled over your eyes to blindfold, censor, and mentally prostrate you from spiritually hearing the real truth.
What TRUTH you must wonder? That you are cognitively enslaved, like everyone else. You were born into mental bondage, born into an illusory societal prison complex that you are entirely incapable of smelling, tasting, or touching. Its a contrived monetary prison enterprise for your mind and eternal soul, built by pretending politicians, corporate CONartists, and NonGoverning parasitic Organizations deploying any means of infiltration and deception by using every tactic unimaginable. You are slowly being convinced into becoming a genetically altered cyborg by acclimation, socially engineered and chipped to eventually no longer be 100% human.
Unfortunately no one can be told eloquently enough in words what the matrix of control truly is. You have to experience it and witness it for yourself. This is your chance to program a future paradigm that doesn't yet exist. After visiting here, there is absolutely no turning back. You can continually take the blue pill BIGpharmacide wants you to repeatedly intake. The story ends if you continually sleep walk through a 2D hologram life, believing whatever you wish to believe until you cease to exist. OR, you can take the red pill challenge, explore "question every single thing" wonderland, program your arse off with 3D capabilities, ultimately ascertaining a new mathematical empyrean. Only then can you fully awaken to discover how deep the rabbit hole state of affairs transpire worldwide with a genuine open mind.
Remember, all I'm offering is a mathematical truth, nothing more...
PURPOSE:
With that being said above, it is now time for advanced developers to start creating their own matrix constructs in 3D, in Pine, just as the universe is created spatially. For those of you who instantly know what this script's potential is easily capable of, you already know what you have to do with it. While this is simplistically just a 3D array for either integers or floats, additional companion functions can in the future be constructed by other members to provide a more complete matrix/array library for millions of folks on TV. I do encourage the most courageous of mathemagicians on TV to do so. I have been employing very large 2D/3D array structures for quite some time, and their utility seems to be of great benefit. Discovering that for myself, I fully realized that Pine is incomplete and must be provided with this agility to process complex datasets that traders WILL use in the future. Mark my words!
CONCEPTION:
While I have long realized and theorized this code for a great duration of time, I was finally able to turn it into a Pine reality with the assistance and training of an "artificially intuitive" program while probing its aptitude. Even though it knows virtually nothing about Pine Script 4.0 or 5.0 syntax, functions, and behavior, I was able to conjure code into an identity similar to what you see now within a few minutes. Close enough for me! Many manual edits later for pine compliance, and I had it in chart, presto!
While most people consider the service to be an "AI", it didn't pass my Pine Turing test. I did have to repeatedly correct it, suffered through numerous apologies from it, was forced to use specifically tailored words, and also rationally debate AND argued with it. It is a handy helper but beware of generating Pine code from it, trust me on this one. However... this artificially intuitive service is currently available in its infancy as version 3. Version 4 most likely will have more diversity to enhance my algorithmic expertise of Pine wizardry. I do have to thank E.M. and his developers for an eye opening experience, or NONE of this code below would be available as you now witness it today.
LIMITATIONS:
As of this initial release, Pine only supports 100,000 array elements maximum. For example, when using this code, a 50x50x40 element configuration will exceed this limit, but 50x50x39 will work. You will always have to keep that in mind during development. Running that size of an array structure on every single bar will most likely time out within 20-40 seconds. This is not the most efficient method compared to a real native 3D array in action. Ehlers adepts, this might not be 100% of what you require to "move forward". You can try, but head room with a low ceiling currently will be challenging to walk in for now, even with extremely optimized Pine code.
A few common functions are provided, but this can be extended extensively later if you choose to undertake that endeavor. Use the code as is and/or however you deem necessary. Any TV member is granted absolute freedom to do what they wish as they please. I ultimately wish to eventually see a fully equipped library version for both matrix3D AND array3D created by collaborative efforts that will probably require many Pine poets testing collectively. This is just a bare bones prototype until that day arrives. Considerably more computational server power will be required also. Anyways, I hope you shall find this code somewhat useful.
Notice: Unfortunately, I will not provide any integration support into members projects at all. I have my own projects that require too much of my time already.
POTENTIAL APPLICATIONS:
The creation of very large coefficient 3D caches/buffers specifically at bar_index==0 can dramatically increase runtime agility for thousands of bars onwards. Generating 1000s of values once and just accessing those generated values is much faster. Also, when running dozens of algorithms simultaneously, a record of performance statistics can be kept, self-analyzed, and visually presented to the developer/user. And, everything else under the sun can be created beyond a developers wildest dreams...
EPILOGUE:
Free your mind!!! And unleash weapons of mass financial creation upon the earth for all to utilize via the "Power of Pine". Flying monkeys and minions are waging economic sabotage upon humanity, decimating markets and exchanges. You can always see it your market charts when things go horribly wrong. This is going to be an astronomical technical challenge to continually navigate very choppy financial markets that are increasingly becoming more and more unstable and volatile. Ordinary one plot algorithms simply are not enough anymore. Statistics and analysis sits above everything imagined. This includes banking, godvernment, corporations, REAL science, technology, health, medicine, transportation, energy, food, etc... We have a unique perspective of the world that most people will never get to see, depending on where you look. With an ever increasingly complex world in constant dynamic flux, novel ways to process data intricately MUST emerge into existence in order to tackle phenomenal tasks required in the future. Achieving data analysis in 3D forms is just one lonely step of many more to come.
At this time the WesternEconomicFraudsters and the WorldHealthOrders are attempting to destroy/reset the world's financial status in order to rain in chaos upon most nations, causing asset devaluation and hyper-inflation. Every form of deception, infiltration, and theft is occurring with a result of destroyed wealth in preparation to consolidate it. Open discussions, available to the public, by world leaders/moguls are fantasizing about new dystopian system as a one size fits all nations solution of digitalID combined with programmableDemonicCurrencies to usher in a new form of obedient servitude to a unipolar digitized hegemony of monetary vampires. If they do succeed with economic conquest, as they have publicly stated, people will be converted into human cattle, herded within smart cities, you will own nothing, eat bugs for breakfast/lunch/dinner, live without heat during severe winter conditions, and be happy. They clearly haven't done the math, as they are far outnumbered by a ratio of 1 to millions. Sith Lords do not own planet Earth! The new world disorder of human exploitation will FAIL. History, my "greatest teacher" for decades reminds us over, and over, and over again, and what are time series for anyways? They are for an intense mathematical analysis of prior historical values/conditions in relation to today's values/conditions... I imagine one day we will be able to ask an all-seeing AI, "WHO IS TO BLAME AND WHY AND WHEN?" comprised of 300 pages in great detail with images, charts, and statistics.
What are the true costs of malignant lies? I will tell you... 64bit numbers are NOT even capable of calculating the extreme cost of pernicious lies and deceit. That's how gigantic this monstrous globalization problem has become and how awful the "matrix of control" truly is now. ALL nations need a monumental revision of its CODE OF ETHICS, and that's definitely a multi-dimensional problem that needs solved sooner than later. If it was up to me, economies and technology would be developed so extensively to eliminate scarcity and increase the standard of living so high, that the notion of war and conflict would be considered irrelevant and extremely appalling to the future generations of humanity, our grandchildren born and unborn. The future will not be owned and operated by geriatric robber barons destined to expire quickly. The future will most likely be intensely "guided" by intelligent open source algorithms that youthful generations will inherit as their birth right.
P.S. Don't give me that politco-my-diction crap speech below in comments. If they weren't meddling with economics mucking up 100% of our chart results in 100% of tickers, I wouldn't have any cause to analyze any effects generated by them, nor provide this script's code. I am performing my analytical homework, but have you? Do you you know WHY international affairs are in dire jeopardy? Without why, the "Power of Pine" would have never existed as it specifically does today. I'm giving away much of my mental power generously to TV members so you are specifically empowered beyond most mathematical agilities commonly existing. I'm just a messenger of profound ideas. Loving and loathing of words is ALWAYS in the eye of beholders, and that's why the freedom of speech is enshrined as #1 in the constitutional code of the USA. Without it, this entire site might not have been allowed to exist from its founder's inceptions.
Support Resistance Channels/Zones Multi Time FrameHello All,
For long time I have been getting a lot of requests for Support/Resistance Multi Time Frame script. Here ' Support Resistance Channels/Zones Multi Time Frame ' is in your service.
This script works if the Higher Time Frame you set is higher than the chart time frame. so the time frame in the options should be higher than the chart time frame.
The script checks total bars and highest/lowest in visible part of the chart and shows all S/R zones that fits according the highest/lowest in visible part. you can see screenshots below if it didn't make sense or if you didn't understand
Let see the options:
Higher Time Frame : the time frame that will be used to get Support/Resistance zones, should be higher than chart time frame
Pivot Period : is the number to find the Pivot Points on Higher time frame, these pivot points are used while calculating the S/R zones
Loopback Period : is the number of total bars on higher time frame which is used while finding pivot points
Maximum Channel Width % : is the percent for maximum width for each channel
Minimum Strength : each zone should contain at least a 1 or more pivot points, you set it here. (Open/High/Low/Close also are considered while calculating the strength)
Maximum Number of S/R : the number of maximum Support/Resistance zones. there can be less S/Rs than this number if it can not find enough S/Rs
Show S/R that fits the Chart : because of we use higher time frame, you should enable this option then the script shows only S/Rs that fits the current chart. if you disable this option, all S/R zones are shown and it may shrink the chart. also you may not see any S/R zone if you don't choose the higher time frame wisely ;)
Show S/R channels in a table : if you enable this option (by default it's enabled) then lower/upper bands of all S/R zones shown in a table ( even if it doesn't fit the chart ). you can change its location. zones are sorted according to their strengths. first one is the strongest.
and the other options is about colors and transparency.
Screenshots before and after zoom-out:
after zoom-out number of visible bars and highest/lowest change and it shows more S/R zones that fits the current chart!
if you see Support Resistance zone like below then you should decrease ' Maximum Channel Width ' or you should set higher time frame better:
You can change colors and transparency:
You can change Table location:
Alerts added :)
P.S. I haven't tested it so much, if you see any issue please drop a comment or send me message
Enjoy!

Correlation with Matrix TableCorrelation coefficient is a measure of the strength of the relationship between two values. It can be useful for market analysis, cryptocurrencies, forex and much more.
Since it "describes the degree to which two series tend to deviate from their moving average values" (1), first of all you have to set the length of these moving averages. You can also retrieve the values from another timeframe, and choose whether or not to ignore the gaps.
After selecting the reference ticker, which is not dependent from the chart you are on, you can choose up to eight other tickers to relate to it. The provided matrix table will then give you a deeper insight through all of the correlations between the chosen symbols.
Correlation values are scored on a scale from 1 to -1
A value of 1 means the correlation between the values is perfect.
A value of 0 means that there is no correlation at all.
A value of -1 indicates that the correlation is perfectly opposite.
For a better view at a glance, eight level colors are available and it is possible to modify them at will. You can even change level ranges by setting their threshold values. The background color of the matrix's cells will change accordingly to all of these choices.
The default threshold values, commonly used in statistics, are as follows:
None to weak correlation: 0 - 0.3
Weak to moderate correlation: 0.3 - 0.5
Moderate to high correlation: 0.5 - 0.7
High to perfect correlation: 0.7 - 1
Remember to be careful about spurious correlations, which are strong correlations without a real causal relationship.
(1) www.tradingview.com

Greater Currency Correlation Matrix (Forex)Other available matrixes I found have a limited number of forex symbols. Consequentially, you need to keep switching them if you want to do a proper analysis. As a result of that, I produced my own currency matrix.
Correlation studies relationships between different price charts.
High correlation may be completely random in the short term, but it may signify a fundamental relationship between the two symbols if calculated over the long term.
For example, the currency of an oil-producing country may rally along with oil, whereas the importer's currency may drop. This means that watching the oil price chart may be worth it for such pairs.
The script includes all Major and Minor pairs with the addition of Gold (XAUEUR) and two optional symbols.
▬▬▬▬
To avoid too frequent use of security(), I decided to calculate all symbol values from EUR pairs. It should improve performance and keep room for some additional symbols in the future.
Please report any bugs.
Morningstar Equity Style Box HeatmapStyle boxes are a classification scheme created by Morningstar. They visually provide a graphical representation of investing categories for equity investments. A style box is a valuable tool for investors to use when determining asset allocation.
There are 9 categories:
Large Value, Large Blend, Large Growth
Medium Value, Medium Blend, Medium Growth
Small Value, Small Blend, Small Growth
The strength of the 9 categories are found by using 9 Vanguard ETF's that follow the respective CRSP index of their category.

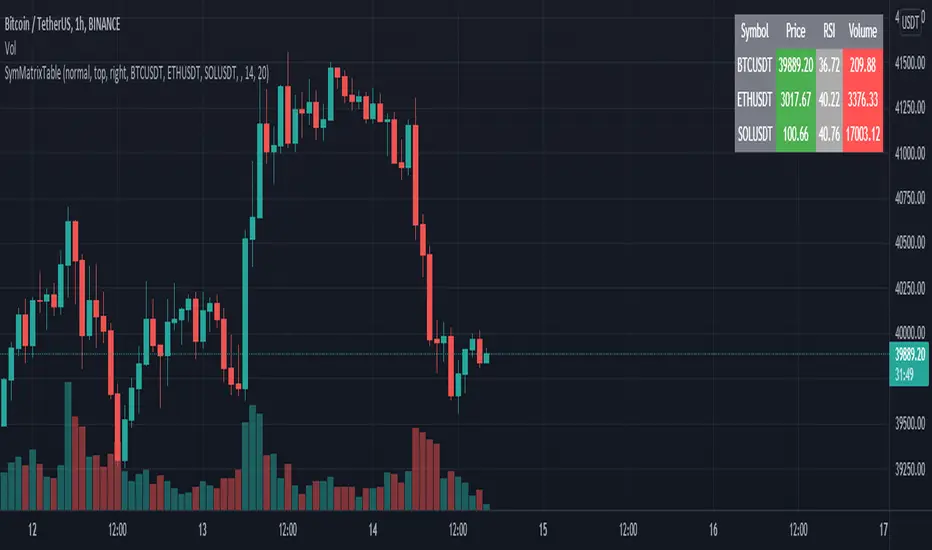
SymMatrixTableSimple Example Table for Displaying Price, RSI, Volume of multiple Tickers on selected Timeframe
Displays Price, RSI and Volume of 3 Tickers and Timeframe selected by user input
Conditional Table Cell coloring
Price color green if > than previous candle close and red if < previous candle close
RSI color green if < 30 and red if > 70 (RSI14 by default)
Volume color green if above average volume and red if less than that (SMA20 volume by default)
Can turn on/off whole table, header columns, row indices, or select individual columns or rows to show/hide
// Example Mixed Type Matrix To Table //
access the simple example script by uncommenting the code at the end
Basically I wanted to have the headers and indices as strings and the rest of the matrix for the table body as floats, then conditional coloring on the table cells
And also the functionality to turn rows and columns on/off from table through checkboxes of user input
Before I was storing each of the values separately in arrays that didn't have a centralized way of controlling table structure
so now the structure is :
- string header array, string index array
- float matrix for table body
- color matrix with bool conditions for coloring table cells
- bool checkboxes for controlling table display
Reshape Table Matrix█ OVERVIEW
Simple method to reshape matrix to table.
Credits to Tradingview for new matrix update.

US Stock Market Sectors Overview Table [By MUQWISHI]US Market Overview Table will identify the bullish and bearish sectors of a day by tracking the SPDR sectors funds.
It's possible to add a ticker symbol for correlation compared to each sector.
Overview Indicator

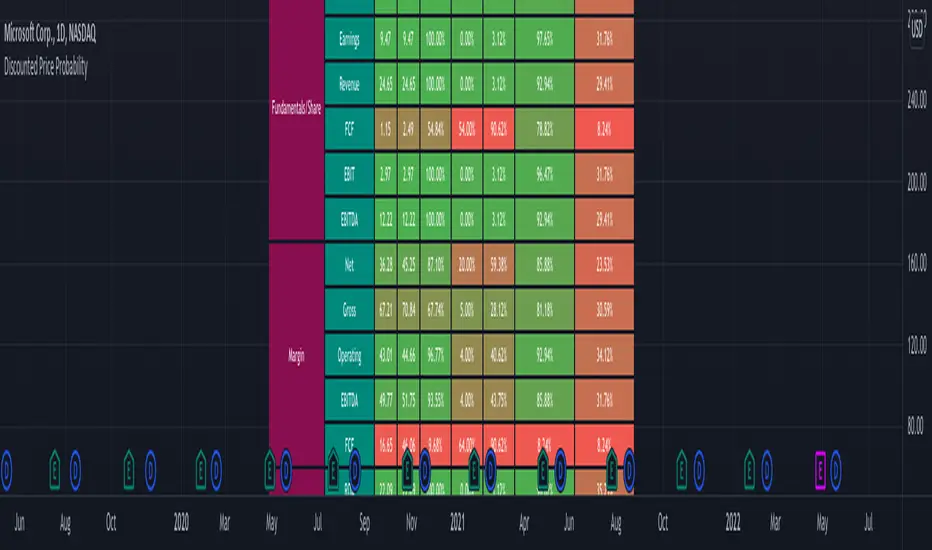
Discounted Price ProbabilityHere is an attempt to understand the probability of discounted price of a stock by comparing it to historical price and fundamental correlation. Have made use of some of the new features of pine in developing this script (Such as matrix and new features of tables such as cell merge and tooltip).
Script makes use of the library written on matrix matrix
🎲 Process
Probability is measured in two angles
🎯 Absolute : Measure the percentile of price and fundamentals with respect to all time high. The difference between the two is measure of probability of stock being undervalued.
🎯 Drawdown : Measure the percentile of distance from all time high for both price and fundamentals. The difference between the two is used for depicting the probability of stock being undervalued.
🎲 Components
In short, the definitions of stats presented are as below
🎲 Settings
Settings are pretty straightforward
🎲 How to look at these stats
To Start with
Are most of the fundamental values coloured in green? If yes, it means that they are near all time high in terms of percentile.
If drawdowns of fundamental values coloured in green? If yes, it means, the stock has not suffered much drawdowns of fundamentals from its peak.
Are the percentile values of drawdowns in green? If yes, it means, that drop in fundamentals are not high compared to its previous values.
If all the above are greener, then it means, company is in strong growth space.
Example: TSLA
Even though the financial ratios of TSLA are not in par with most of the fundamentally strong stocks, it is indeed growing steadily and at its near all time high.
Lets take another example of NKLA
Here the base columns regarding fundamentals are mostly red. This means, company has suffered setback with respect to their financials and the company is not where it used to be. But, if you see the differential probabilities, it says 92% of being undervalued?
Well, this is due to the fact that NKLA's fundamentals suffered most of the time and they are always below par when compared to price. Hence, such kind of cases may interpret the stocks as undervalued. Hence, even if the probability of being undervalued is more, it does not guarantee the quality of the stock. We need to be mindful overall financials of the company and how they fare with general standards.
Moving forward
To understand value of trending stock, use Absolute Probability (marked with P). Ex. GOOG, MSFT, BRK.B etc.
To understand value of stock which has been recently suffered huge price drop, look at drawdown based probability (marked with D). Ex. BABA, FB, PYPL, SQ, ROKU etc.
Some examples of high flyers:
Some for deep pullbacks:
And the meme stocks:
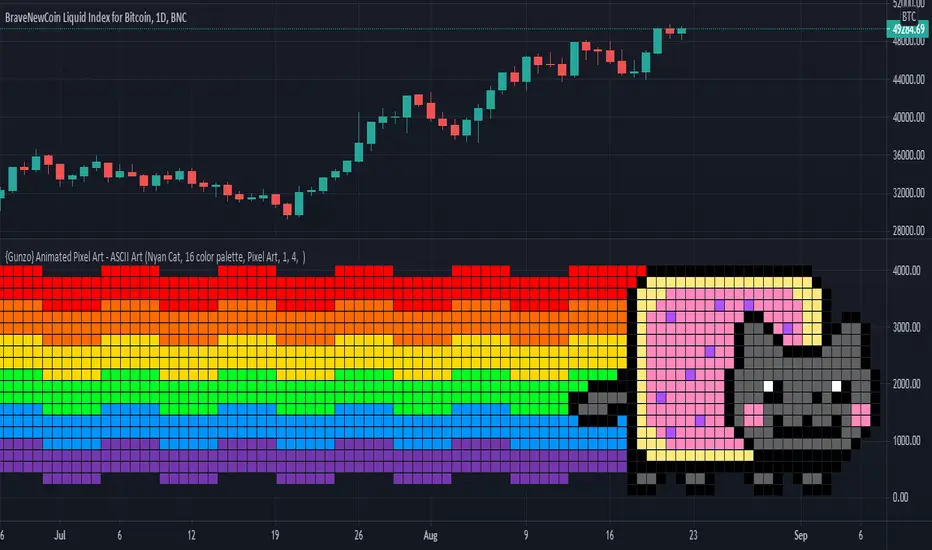
{Gunzo} Animated Pixel Art - ASCII ArtAnimated Pixel Art - ASCII Art is not only an easy-to-use platform to create and visualize pixel animations. This script can also be used with the Nyan Cat visualization as a companion tool for all traders to know when the price is changing on the chart.
OVERVIEW :
In the first place, this tool has been created to celebrate the new design of the Trading View platform. The new monogram logo and the previous cloud logo can be displayed as pixel art within this script.
To test the limits of the pine script language, I tried to improve this simple pixel art script to be able to display complex pixel animations with good performance (max allowed 100 milliseconds per bar). That's how the Nyan Cat companion was created. Nyan Cat is moving every time the data on the chart is refreshed, so the animation time may differ depending on your environment. Only the pixels that changed between two animations are repainted on each loop so that the performance is significantly improved and allowing so to create bigger pixel art designs.
HOW IT WORKS :
The pixels are displayed on the chart using a huge table variable. Each cell of the table can be used to display one pixel of the initial matrix. New designs can easily be implemented as the pixel matrix is stored as a simple text variable.
The pixel matrix is composed of hexadecimal characters (0123456789ABCDEF). Each hexadecimal character correspond to a color in the 16 color palette.
SETTINGS :
Matrix Visual : Name of the pixel art matrix to be displayed
Matrix Colors : Palette to be used for painting the pixels. 16 color palette for colorful matrix or phosphor colors for retro aspect on simple pixel art.
Type of art : Pixel art paint square pixels on chart and ASCII art paints hexadecimal characters on a chart.
Pixel Grid color : Color used between each pixel, by default it is transparent.
Pixel Width : Change the aspect ratio of the matrix. Useful to fine-tune the size of the pixels according to your screen size and the script size.
Pixel Height : Change the aspect ratio of the matrix. Useful to fine-tune the size of the pixels according to your screen size and the script size.
ASCII Background Character : Character that will be replaced with no color
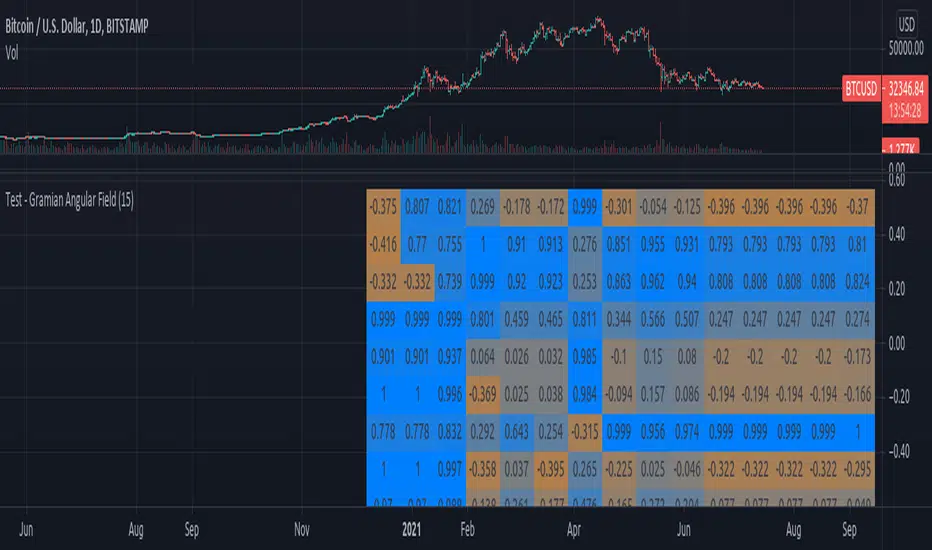
Test - Gramian Angular FieldExperimental:
The Gramian Angular Field is usually used in machine learning for machine vision, it allows the encoding of data as a visual queue / matrix.
Directional Matrix [LuxAlgo]Returns a dashboard showing the direction taken by 4 overlay indicators, SMA (simple moving average), TMA (triangular moving average), WMA (weighted moving average), and REG (linear regression), all using different length periods.
The user can select the minimum and maximum length of these indicators and introduce an increment.
1. Settings
Maximum Length: The end value of sequences of the indicator periods to analyze
Minimum Length: The starting value of sequences of the indicator periods to analyze
Step: Determines the spacing between each indicator periods values
Src: Data source for each of the 4 indicators
1.1 Style settings
Normalized Change Mode: Allows the user to access a different interpretation of the indicator by showing the normalized first differences of each indicator in the dashboard instead of their sign
Dashboard Location: Location of the dashboard on the chart
Dashboard Size: Size of the dashboard on the chart
Text/Frame Color: Determines the color of the frame grid as well as the text color
Bullish Cell Color: Determines the color of cell associated with a rising indicator direction
Bearish Cell Color: Determines the color of cell associated with a decreasing indicator direction
Cell Transparency: Transparency of each cell
2. Usage
Each of the indicators included in the dashboard aim to give an estimate of the underlying trend in the price. Knowing which direction they are taking can help us have a broader view regarding the direction of shorter/longer-term trends. We will later see that this is not the only kind of information that we can get from this indicator.
Rising indicators are represented by blue cells (or the color selected in the Bullish Cell Color setting) while decreasing indicators are represented by red cells (or the color selected in the Bearish Cell Color setting).
The percentage of bullish cells is given in the top-left cell of the dashboard.
2.1 Normalized change mode
Enabling the Normalized Change mode will display the normalized changes returned by the indicators over different length periods. This metric is within a range (0,1), with 1 indicating the highest change over the selected length periods, while 0 indicates the lowest one.
When enabling this mode the color of the cells makes use of a gradient with a color palette ranging from the color selected in the Bearish Cell setting to the color selected in the Bullish Cell setting.
2.1 Other Usage
The direction taken by certain indicators can give more information than one would think. Indeed, the sign of the change of one indicator can often be given by different indicators.
A positive change in a simple moving average indicates that the price is greater than the price p bars ago, where p is the period of the simple moving average.
A positive change in a triangular moving average indicates that a simple moving average of period p is above a simple moving average of period p × 2 , where p is the period of the triangular moving average (note that we assume here that the TMA is given by cascading two SMAs of period p ).
A positive change in a weighted moving average indicates that the price is above a simple moving average of period p+1 , where p is the period of the WMA.
Finally, a positive change in a linear regression indicates that a weighted moving average is above a simple moving average of period p , where p is the period of the linear regression.


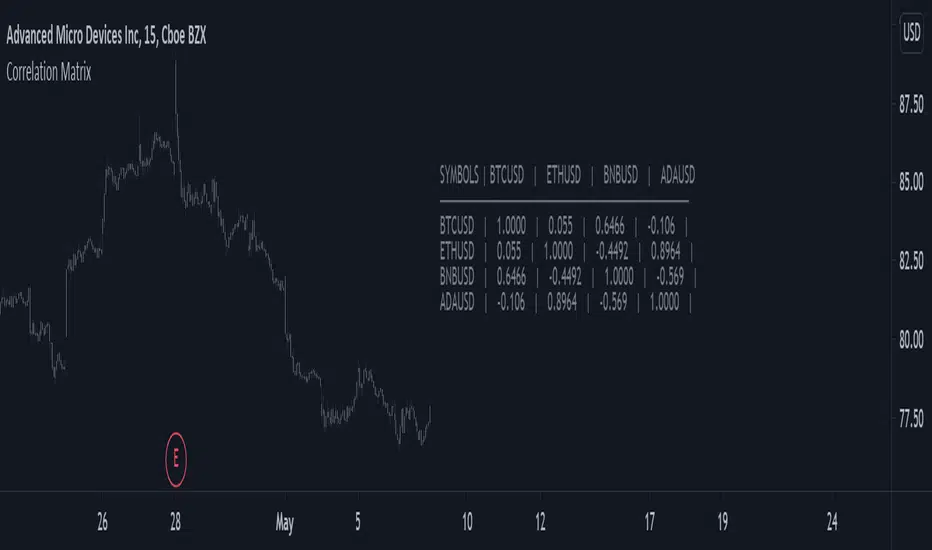
Correlation MatrixReturns a 4x4 correlation matrix between various user-selected symbols. Users can change the window of the correlation with the setting length .
Correlation matrices can be useful to see the linear relationship between various symbols, this is an important tool for diversification.
Matrix Library (Linear Algebra, incl Multiple Linear Regression)What's this all about?
Ever since 1D arrays were added to Pine Script, many wonderful new opportunities have opened up. There has been a few implementations of matrices and matrix math (most notably by TradingView-user tbiktag in his recent Moving Regression script: ). However, so far, no comprehensive libraries for matrix math and linear algebra has been developed. This script aims to change that.
I'm not math expert, but I like learning new things, so I took it upon myself to relearn linear algebra these past few months, and create a matrix math library for Pine Script. The goal with the library was to make a comprehensive collection of functions that can be used to perform as many of the standard operations on matrices as possible, and to implement functions to solve systems of linear equations. The library implements matrices using arrays, and many standard functions to manipulate these matrices have been added as well.
The main purpose of the library is to give users the ability to solve systems of linear equations (useful for Multiple Linear Regression with K number of independent variables for example), but it can also be used to simulate 2D arrays for any purpose.
So how do I use this thing?
Personally, what I do with my private Pine Script libraries is I keep them stored as text-files in a Libraries folder, and I copy and paste them into my code when I need them. This library is quite large, so I have made sure to use brackets in comments to easily hide any part of the code. This helps with big libraries like this one.
The parts of this script that you need to copy are labeled "MathLib", "ArrayLib", and "MatrixLib". The matrix library is dependent on the functions from these other two libraries, but they are stripped down to only include the functions used by the MatrixLib library.
When you have the code in your script (pasted somewhere below the "study()" call), you can create a matrix by calling one of the constructor functions. All functions in this library start with "matrix_", and all constructors start with either "create" or "copy". I suggest you read through the code though. The functions have very descriptive names, and a short description of what each function does is included in a header comment directly above it. The functions generally come in the following order:
Constructors: These are used to create matrices (empy with no rows or columns, set shape filled with 0s, from a time series or an array, and so on).
Getters and setters: These are used to get data from a matrix (like the value of an element or a full row or column).
Matrix manipulations: These functions manipulate the matrix in some way (for example, functions to append columns or rows to a matrix).
Matrix operations: These are the matrix operations. They include things like basic math operations for two indices, to transposing a matrix.
Decompositions and solvers: Next up are functions to solve systems of linear equations. These include LU and QR decomposition and solvers, and functions for calculating the pseudo-inverse or inverse of a matrix.
Multiple Linear Regression: Lastly, we find an implementation of a multiple linear regression, including all the standard statistics one can expect to find in most statistical software packages.
Are there any working examples of how to use the library?
Yes, at the very end of the script, there is an example that plots the predictions from a multiple linear regression with two independent (explanatory) X variables, regressing the chart data (the Y variable) on these X variables. You can look at this code to see a real-world example of how to use the code in this library.
Are there any limitations?
There are no hard limiations, but the matrices uses arrays, so the number of elements can never exceed the number of elements supported by Pine Script (minus 2, since two elements are used internally by the library to store row and column count). Some of the operations do use a lot of resources though, and as a result, some things can not be done without timing out. This can vary from time to time as well, as this is primarily dependent on the available resources from the Pine Script servers. For instance, the multiple linear regression cannot be used with a lookback window above 10 or 12 most of the time, if the statistics are reported. If no statistics are reported (and therefore not calculated), the lookback window can usually be extended to around 60-80 bars before the servers time out the execution.
Hopefully the dev-team at TradingView sees this script and find ways to implement this functionality diretly into Pine Script, as that would speed up many of the operations and make things like MLR (multiple linear regression) possible on a bigger lookback window.
Some parting words
This library has taken a few months to write, and I have taken all the steps I can think of to test it for bugs. Some may have slipped through anyway, so please let me know if you find any, and I'll try my best to fix them when I have time to do so. This library is intended to help the community. Therefore, I am releasing the library as open source, in the hopes that people may improving on it, or using it in their own work. If you do make something cool with this, or if you find ways to improve the code, please let me know in the comments.

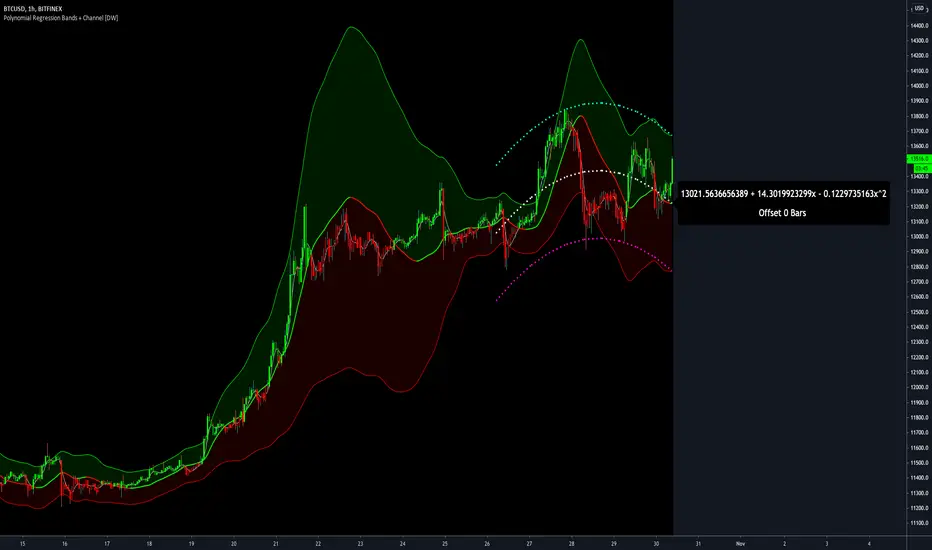
Polynomial Regression Bands + Channel [DW]This is an experimental study designed to calculate polynomial regression for any order polynomial that TV is able to support.
This study aims to educate users on polynomial curve fitting, and the derivation process of Least Squares Moving Averages (LSMAs).
I also designed this study with the intent of showcasing some of the capabilities and potential applications of TV's fantastic new array functions.
Polynomial regression is a form of regression analysis in which the relationship between the independent variable x and the dependent variable y is modeled as a polynomial of nth degree (order).
For clarification, linear regression can also be described as a first order polynomial regression. The process of deriving linear, quadratic, cubic, and higher order polynomial relationships is all the same.
In addition, although deriving a polynomial regression equation results in a nonlinear output, the process of solving for polynomials by least squares is actually a special case of multiple linear regression.
So, just like in multiple linear regression, polynomial regression can be solved in essentially the same way through a system of linear equations.
In this study, you are first given the option to smooth the input data using the 2 pole Super Smoother Filter from John Ehlers.
I chose this specific filter because I find it provides superior smoothing with low lag and fairly clean cutoff. You can, of course, implement your own filter functions to see how they compare if you feel like experimenting.
Filtering noise prior to regression calculation can be useful for providing a more stable estimation since least squares regression can be rather sensitive to noise.
This is especially true on lower sampling lengths and higher degree polynomials since the regression output becomes more "overfit" to the sample data.
Next, data arrays are populated for the x-axis and y-axis values. These are the main datasets utilized in the rest of the calculations.
To keep the calculations more numerically stable for higher periods and orders, the x array is filled with integers 1 through the sampling period rather than using current bar numbers.
This process can be thought of as shifting the origin of the x-axis as new data emerges.
This keeps the axis values significantly lower than the 10k+ bar values, thus maintaining more numerical stability at higher orders and sample lengths.
The data arrays are then used to create a pseudo 2D matrix of x power sums, and a vector of x power*y sums.
These matrices are a representation the system of equations that need to be solved in order to find the regression coefficients.
Below, you'll see some examples of the pattern of equations used to solve for our coefficients represented in augmented matrix form.
For example, the augmented matrix for the system equations required to solve a second order (quadratic) polynomial regression by least squares is formed like this:
(∑x^0 ∑x^1 ∑x^2 | ∑(x^0)y)
(∑x^1 ∑x^2 ∑x^3 | ∑(x^1)y)
(∑x^2 ∑x^3 ∑x^4 | ∑(x^2)y)
The augmented matrix for the third order (cubic) system is formed like this:
(∑x^0 ∑x^1 ∑x^2 ∑x^3 | ∑(x^0)y)
(∑x^1 ∑x^2 ∑x^3 ∑x^4 | ∑(x^1)y)
(∑x^2 ∑x^3 ∑x^4 ∑x^5 | ∑(x^2)y)
(∑x^3 ∑x^4 ∑x^5 ∑x^6 | ∑(x^3)y)
This pattern continues for any n ordered polynomial regression, in which the coefficient matrix is a n + 1 wide square matrix with the last term being ∑x^2n, and the last term of the result vector being ∑(x^n)y.
Thanks to this pattern, it's rather convenient to solve the for our regression coefficients of any nth degree polynomial by a number of different methods.
In this script, I utilize a process known as LU Decomposition to solve for the regression coefficients.
Lower-upper (LU) Decomposition is a neat form of matrix manipulation that expresses a 2D matrix as the product of lower and upper triangular matrices.
This decomposition method is incredibly handy for solving systems of equations, calculating determinants, and inverting matrices.
For a linear system Ax=b, where A is our coefficient matrix, x is our vector of unknowns, and b is our vector of results, LU Decomposition turns our system into LUx=b.
We can then factor this into two separate matrix equations and solve the system using these two simple steps:
1. Solve Ly=b for y, where y is a new vector of unknowns that satisfies the equation, using forward substitution.
2. Solve Ux=y for x using backward substitution. This gives us the values of our original unknowns - in this case, the coefficients for our regression equation.
After solving for the regression coefficients, the values are then plugged into our regression equation:
Y = a0 + a1*x + a1*x^2 + ... + an*x^n, where a() is the ()th coefficient in ascending order and n is the polynomial degree.
From here, an array of curve values for the period based on the current equation is populated, and standard deviation is added to and subtracted from the equation to calculate the channel high and low levels.
The calculated curve values can also be shifted to the left or right using the "Regression Offset" input
Changing the offset parameter will move the curve left for negative values, and right for positive values.
This offset parameter shifts the curve points within our window while using the same equation, allowing you to use offset datapoints on the regression curve to calculate the LSMA and bands.
The curve and channel's appearance is optionally approximated using Pine's v4 line tools to draw segments.
Since there is a limitation on how many lines can be displayed per script, each curve consists of 10 segments with lengths determined by a user defined step size. In total, there are 30 lines displayed at once when active.
By default, the step size is 10, meaning each segment is 10 bars long. This is because the default sampling period is 100, so this step size will show the approximate curve for the entire period.
When adjusting your sampling period, be sure to adjust your step size accordingly when curve drawing is active if you want to see the full approximate curve for the period.
Note that when you have a larger step size, you will see more seemingly "sharp" turning points on the polynomial curve, especially on higher degree polynomials.
The polynomial functions that are calculated are continuous and differentiable across all points. The perceived sharpness is simply due to our limitation on available lines to draw them.
The approximate channel drawings also come equipped with style inputs, so you can control the type, color, and width of the regression, channel high, and channel low curves.
I also included an input to determine if the curves are updated continuously, or only upon the closing of a bar for reduced runtime demands. More about why this is important in the notes below.
For additional reference, I also included the option to display the current regression equation.
This allows you to easily track the polynomial function you're using, and to confirm that the polynomial is properly supported within Pine.
There are some cases that aren't supported properly due to Pine's limitations. More about this in the notes on the bottom.
In addition, I included a line of text beneath the equation to indicate how many bars left or right the calculated curve data is currently shifted.
The display label comes equipped with style editing inputs, so you can control the size, background color, and text color of the equation display.
The Polynomial LSMA, high band, and low band in this script are generated by tracking the current endpoints of the regression, channel high, and channel low curves respectively.
The output of these bands is similar in nature to Bollinger Bands, but with an obviously different derivation process.
By displaying the LSMA and bands in tandem with the polynomial channel, it's easy to visualize how LSMAs are derived, and how the process that goes into them is drastically different from a typical moving average.
The main difference between LSMA and other MAs is that LSMA is showing the value of the regression curve on the current bar, which is the result of a modelled relationship between x and the expected value of y.
With other MA / filter types, they are typically just averaging or frequency filtering the samples. This is an important distinction in interpretation. However, both can be applied similarly when trading.
An important distinction with the LSMA in this script is that since we can model higher degree polynomial relationships, the LSMA here is not limited to only linear as it is in TV's built in LSMA.
Bar colors are also included in this script. The color scheme is based on disparity between source and the LSMA.
This script is a great study for educating yourself on the process that goes into polynomial regression, as well as one of the many processes computers utilize to solve systems of equations.
Also, the Polynomial LSMA and bands are great components to try implementing into your own analysis setup.
I hope you all enjoy it!
--------------------------------------------------------
NOTES:
- Even though the algorithm used in this script can be implemented to find any order polynomial relationship, TV has a limit on the significant figures for its floating point outputs.
This means that as you increase your sampling period and / or polynomial order, some higher order coefficients will be output as 0 due to floating point round-off.
There is currently no viable workaround for this issue since there isn't a way to calculate more significant figures than the limit.
However, in my humble opinion, fitting a polynomial higher than cubic to most time series data is "overkill" due to bias-variance tradeoff.
Although, this tradeoff is also dependent on the sampling period. Keep that in mind. A good rule of thumb is to aim for a nice "middle ground" between bias and variance.
If TV ever chooses to expand its significant figure limits, then it will be possible to accurately calculate even higher order polynomials and periods if you feel the desire to do so.
To test if your polynomial is properly supported within Pine's constraints, check the equation label.
If you see a coefficient value of 0 in front of any of the x values, reduce your period and / or polynomial order.
- Although this algorithm has less computational complexity than most other linear system solving methods, this script itself can still be rather demanding on runtime resources - especially when drawing the curves.
In the event you find your current configuration is throwing back an error saying that the calculation takes too long, there are a few things you can try:
-> Refresh your chart or hide and unhide the indicator.
The runtime environment on TV is very dynamic and the allocation of available memory varies with collective server usage.
By refreshing, you can often get it to process since you're basically just waiting for your allotment to increase. This method works well in a lot of cases.
-> Change the curve update frequency to "Close Only".
If you've tried refreshing multiple times and still have the error, your configuration may simply be too demanding of resources.
v4 drawing objects, most notably lines, can be highly taxing on the servers. That's why Pine has a limit on how many can be displayed in the first place.
By limiting the curve updates to only bar closes, this will significantly reduce the runtime needs of the lines since they will only be calculated once per bar.
Note that doing this will only limit the visual output of the curve segments. It has no impact on regression calculation, equation display, or LSMA and band displays.
-> Uncheck the display boxes for the drawing objects.
If you still have troubles after trying the above options, then simply stop displaying the curve - unless it's important to you.
As I mentioned, v4 drawing objects can be rather resource intensive. So a simple fix that often works when other things fail is to just stop them from being displayed.
-> Reduce sampling period, polynomial order, or curve drawing step size.
If you're having runtime errors and don't want to sacrifice the curve drawings, then you'll need to reduce the calculation complexity.
If you're using a large sampling period, or high order polynomial, the operational complexity becomes significantly higher than lower periods and orders.
When you have larger step sizes, more historical referencing is used for x-axis locations, which does have an impact as well.
By reducing these parameters, the runtime issue will often be solved.
Another important detail to note with this is that you may have configurations that work just fine in real time, but struggle to load properly in replay mode.
This is because the replay framework also requires its own allotment of runtime, so that must be taken into consideration as well.
- Please note that the line and label objects are reprinted as new data emerges. That's simply the nature of drawing objects vs standard plots.
I do not recommend or endorse basing your trading decisions based on the drawn curve. That component is merely to serve as a visual reference of the current polynomial relationship.
No repainting occurs with the Polynomial LSMA and bands though. Once the bar is closed, that bar's calculated values are set.
So when using the LSMA and bands for trading purposes, you can rest easy knowing that history won't change on you when you come back to view them.
- For those who intend on utilizing or modifying the functions and calculations in this script for their own scripts, I included debug dialogues in the script for all of the arrays to make the process easier.
To use the debugs, see the "Debugs" section at the bottom. All dialogues are commented out by default.
The debugs are displayed using label objects. By default, I have them all located to the right of current price.
If you wish to display multiple debugs at once, it will be up to you to decide on display locations at your leisure.
When using the debugs, I recommend commenting out the other drawing objects (or even all plots) in the script to prevent runtime issues and overlapping displays.
Matrix functions - JD/////////////////////////////////////////////////////////////////////////////////////////////////////////////////
// The arrays provided in Pinescript are linear 1D strucures that can be seen either as a large vertical stack or
// a horizontal row containing a list of values, colors, bools,..
//
// With the FUNCTIONS in this script the 1D ARRAY LIST can be CONVERTED INTO A 2D MATRIX form
//
//
///////////////////////////////////////////
/// BASIC INFO ON THE MATRIX STRUCTURE: ///
///////////////////////////////////////////
//
// The matrix is set up as an 2D structure and is devided in ROWS and COLUMNS.
// following the standard mathematical notation:
//
// a 3 x 4 matrix = 4 columns
// 0 1 2 3 column index
// 0
// 3 rows 1
// 2
// row
// index
//
// With the use of some purpose-built functions, values can be placed or retrieved in a specific column of a certain row
// this can be done by intuitively using row_nr and column_nr coördinates,
// without having to worry on what exact index of the Pine array this value is located (the functions do these conversions for you)
//
//
// the syntax I propose for the 2D Matrix array has the following structure:
//
// - the array starts with 2 VALUES describing the DIMENSION INFORMATION, (rows, columns)
// these are ignored in the actual calculations and serve as a metadata header (similar to the "location, time,... etc." data that is stored in photo files)
// so the array always carries it's own info about the nr. of rows and columns and doesn't need is seperate "info" file!
//
// To stay consistent with the standard Pinescript (array and ) indexing:
// - indexes for sheets and columns start from 0 (first) and run up to the (total nr of sheets or columns) - 1
// - indexes for rows also start from 0 (most recent, cfr. ) and run up to the (total nr of rows) - 1
//
// - this 2 value metadata header is followed by the actual df data
// the actual data array can consist of (100,000 - 2) usable items,
//
// In a theoretical example, you can have a matrix with almost 20,000 rows with each 5 columns of data (eg. open, high, low, close, volume) in it!!!
//
//
///////////////////////////////////
/// SCHEMATIC OF THE STRUCTURE: ///
///////////////////////////////////
//
////// (metadata header with dimensions info)
//
// (0) (1) (array index)
//
