Robust Scaled Dema | OquantOverview
The Robust Scaled DEMA indicator is a tool designed for traders seeking to identify potential trend directions in financial markets. It combines the smoothing capabilities of a Double Exponential Moving Average (DEMA) with a robust scaling mechanism to normalize the data, making it more resilient to outliers and extreme price movements. This scaling helps in generating long and short signals based on predefined thresholds, visualized through color-coded plots and bars. The indicator aims to provide a balanced view of market momentum, reducing the impact of noise while highlighting significant shifts in price behavior.
Key Factors/Components
DEMA (Double Exponential Moving Average): Serves as the core smoothing component, reducing lag compared to simple averages by emphasizing recent price action more effectively.
Robust Scaling Mechanism: Utilizes statistical measures like median and interquartile range to normalize the DEMA values, ensuring the indicator is less sensitive to extreme values or price spikes.
Thresholds: User-defined upper and lower levels that trigger long or short signals when the scaled DEMA crosses them.
Visual Elements: Includes plotted lines for the scaled DEMA and thresholds, plus color-coded candlestick bars for intuitive interpretation.
Alerts: Built-in conditions for notifying users of potential entry points for long or short positions.
How It Works
The indicator starts by applying a DEMA to the chosen price source to create a smoothed representation of the market's direction. This smoothed value is then scaled using a robust statistical approach that accounts for the distribution of recent DEMA values, centering it around a median and adjusting for variability to minimize the influence of outliers. The resulting scaled metric is compared against user-set upper and lower thresholds: crossing above the upper suggests a bullish momentum (long signal), while dipping below the lower indicates bearish conditions (short signal). A state variable tracks these conditions to color the chart accordingly, helping traders visualize regime changes. Optional alerts fire on transitions.
For Who Is Best/Recommended Use Cases
This indicator is ideal for traders who employ trend-following or momentum-based strategies and need tools that perform well in non-normal market conditions, such as during high volatility or in assets prone to spikes. Use cases include identifying entry/exit points in trending environments, confirming breakouts, or integrating into multi-indicator systems for added confirmation. Quantitative traders or those backtesting strategies will appreciate its customizable parameters for optimization.
Settings and Default Settings
Source: The price data input for calculations, such as close, open, high, or low. Default: close.
DEMA Length: Controls the period for the DEMA smoothing; shorter values increase responsiveness but may add noise, longer ones provide more lag but smoother signals. Default: 25.
Robust Scaling Length: Defines the lookback period for the scaling statistics; affects how adaptive the normalization is to recent data distributions. Default: 40.
Upper Threshold: The level above which a long signal is triggered; higher values make signals rarer but potentially more reliable. Default: 0.5.
Lower Threshold: The level below which a short signal is triggered; lower values allow for more aggressive bearish detection. Default: 0.
Conclusion
The Robust Scaled DEMA offers an outlier-resistant alternative to traditional moving average indicators, empowering traders to navigate volatile markets. By blending exponential smoothing with statistical robustness, it provides actionable insights into trend shifts while minimizing false positives from extreme events..
⚠️ Disclaimer: This indicator is intended for educational and informational purposes only. Trading/investing involves risk, and past performance does not guarantee future results. Always test and evaluate indicators/strategies before applying them in live markets. Use at your own risk.
Median

Percentile Rank Oscillator (Price + VWMA)A statistical oscillator designed to identify potential market turning points using percentile-based price analytics and volume-weighted confirmation.
What is PRO?
Percentile Rank Oscillator measures how extreme current price behavior is relative to its own recent history. It calculates a rolling percentile rank of price midpoints and VWMA deviation (volume-weighted price drift). When price reaches historically rare levels – high or low percentiles – it may signal exhaustion and potential reversal conditions.
How it works
Takes midpoint of each candle ((H+L)/2)
Ranks the current value vs previous N bars using rolling percentile rank
Maps percentile to a normalized oscillator scale (-1..+1 or 0–100)
Optionally evaluates VWMA deviation percentile for volume-confirmed signals
Highlights extreme conditions and confluence zones
Why percentile rank?
Median-based percentiles ignore outliers and read the market statistically – not by fixed thresholds. Instead of guessing “overbought/oversold” values, the indicator adapts to current volatility and structure.
Key features
Rolling percentile rank of price action
Optional VWMA-based percentile confirmation
Adaptive, noise-robust structure
User-selectable thresholds (default 95/5)
Confluence highlighting for price + VWMA extremes
Optional smoothing (RMA)
Visual extreme zone fills for rapid signal recognition
How to use
High percentile values –> statistically extreme upward deviation (potential top)
Low percentile values –> statistically extreme downward deviation (potential bottom)
Price + VWMA confluence strengthens reversal context
Best used as part of a broader trading framework (market structure, order flow, etc.)
Tip: Look for percentile spikes at key HTF levels, after extended moves, or where liquidity sweeps occur. Strong moves into rare percentile territory may precede mean reversion.
Suggested settings
Default length: 100 bars
Thresholds: 95 / 5
Smoothing: 1–3 (optional)
Important note
This tool does not predict direction or guarantee outcomes. It provides statistical context for price extremes to help traders frame probability and timing. Always combine with sound risk management and other tools.

Dual Median TrendSyncDual Median TrendSync ~ GForge
Revolutionary trend-following system that combines dual median analysis with adaptive momentum deviation bands for precise market timing across all asset classes.
🎯 WHAT IS MEDIAN TRENDSYNC?
Median TrendSync is a sophisticated technical indicator that leverages the statistical power of dual median calculations combined with dynamic momentum deviation analysis. Unlike traditional moving average systems that can be skewed by outliers, this system uses robust median-based calculations to identify genuine trend changes while filtering out market noise. The result is a highly adaptive system that works across all timeframes and asset classes, with exceptional performance in volatile 24/7 markets.
🔬 CORE INNOVATION: MOMENTUM DEVIATION TECHNOLOGY
The breakthrough feature of this system is its proprietary Momentum Deviation Bands - a secondary layer of adaptive volatility analysis applied to the oscillator itself. This creates a "volatility-of-volatility" measurement that dynamically adjusts to changing market conditions, providing earlier and more precise entry signals compared to traditional threshold-based systems.
Key Technical Advantages:
Dual Median Architecture: Two independent median systems work in harmony, each analyzing different price aspects and timeframes to capture both micro and macro trend shifts.
Adaptive Volatility Bands: Standard deviation bands that automatically expand during volatile periods and contract during consolidation, ensuring consistent signal quality regardless of market conditions.
Momentum Deviation Analysis: Advanced oscillator-level volatility measurement that identifies extreme momentum zones for optimal entry timing.
Statistical Robustness: Median calculations are inherently resistant to price spikes and false breakouts, providing more reliable trend identification than mean-based methods.
🌍 WHY IT'S UNIVERSAL: WORKS ACROSS ALL MARKETS
Asset Class Agnostic Design:
The system's median-based foundation makes it remarkably versatile across different asset classes:
Cryptocurrencies: Exceptional performance in 24/7 volatile markets with large price swings
Forex: Adapts to currency pair characteristics and varying volatility regimes
Stocks: Reliable trend identification for both individual stocks and indices
Commodities: Handles the unique cyclical nature of commodity markets
Futures: Robust performance across diverse futures contracts
Timeframe Flexibility:
Works seamlessly from Short-term to long-term position trading (daily/weekly charts). The adaptive nature of the system automatically calibrates to the chosen timeframe's volatility profile.
🚀 OPTIMIZED FOR CRYPTOCURRENCY MARKETS
While the system is universal, it truly excels in crypto for several key reasons:
24/7 Market Dynamics: Continuous price action allows the median calculations to build more comprehensive statistical profiles without overnight gaps.
High Volatility Adaptation: Crypto's extreme volatility is exactly where adaptive deviation bands shine - they expand during volatile moves and contract during consolidation, maintaining signal accuracy.
Trend Persistence: Crypto markets often exhibit strong, sustained trends that the dual median system is specifically designed to capture and ride.
Noise Filtering: The median-based approach naturally filters out the "pump and dump" spikes and flash crashes common in crypto, focusing on genuine trend changes.
Momentum Clarity: Crypto's clear momentum phases (accumulation, markup, distribution, markdown) align perfectly with the momentum deviation detection system.
⚙️ HOW THE SYSTEM WORKS
Signal Generation Process:
Dual Median Calculation: Two independent median systems analyze price action using different lookback periods and price sources, providing multi-dimensional market perspective.
Deviation Band Creation: Statistical volatility bands are constructed around each median using adaptive standard deviation measurements.
Oscillator Normalization: Price position relative to deviation bands is converted to a normalized oscillator reading (0-100+ scale).
Momentum Deviation Analysis: A secondary volatility layer is applied to the oscillator itself, creating dynamic momentum deviation bands that identify extreme zones.
Threshold Crossing Detection: When momentum deviation bands cross specific thresholds, high-probability trend change signals are generated.
5 Signal Combination Modes:
Median1 Only: Uses the primary median system for signals
Median2 Only: Uses the secondary median system for signals
Average: Combines both systems by averaging their readings (most balanced)
Both Required: Generates signals only when both systems agree (highest accuracy)
Either One: Triggers when either system signals (highest sensitivity)
📊 COMPREHENSIVE VISUAL ANALYTICS
Multi-Layer Visualization System:
Gradient Bar Coloring: Real-time visual representation of oscillator state with smooth color transitions from bearish to bullish zones
Dynamic State Bar: Bottom-of-chart gradient indicator showing current momentum position at a glance
Optional Overlay Bands: Deviation bands, threshold lines, and median lines can be displayed directly on the price chart for enhanced context
Momentum Deviation Bands: Visual representation of the advanced volatility-of-volatility measurement
Signal Markers: Clear diamond indicators for entry and exit points
Professional Metrics Dashboard:
The integrated analytics table displays real-time performance metrics:
Net Profit & Current P&L
Win Rate & Total Trades
Maximum Drawdown
Calmar Ratio (return/risk efficiency)
Sharpe Ratio (risk-adjusted returns)
Sortino Ratio (downside risk focus)
Half Kelly Position Sizing Recommendation
Current Position & Momentum Deviation State
1D & 1H BTC
🎮 FLEXIBLE TRADING MODES
Long/Short Mode: Full bi-directional trading for maximum opportunity capture
Long/Cash Mode: Conservative approach - only long positions with cash during bearish periods
Both modes include comprehensive backtesting with date range filtering and detailed performance analytics.
⚡ ALERT SYSTEM
Built-in alert conditions for:
Long signal detection
Short signal detection
Cash/exit signal detection
Never miss a trading opportunity with customizable TradingView alerts.
💡 BEST PRACTICES FOR OPTIMAL RESULTS
Start with Default Settings: The system is pre-optimized for broad market applicability. Test default parameters before making adjustments.
Match Mode to Market: Use "Average" mode for balanced signals, "Both Required" for higher accuracy in choppy markets, "Either One" for trending markets.
Timeframe Selection: While universal, the system shows exceptional results from low timeframes up to the daily timeframe.
Combine with Risk Management: Use the Kelly ½ recommendation as a starting point for position sizing.
Monitor Metrics: Keep the metrics table visible to track real-time performance and adjust strategy as needed.
Respect the Oscillator Gradient: The bar coloring provides continuous feedback - avoid counter-trend entries when gradient shows strong directional color.
🔒 CLOSED SOURCE - PROPRIETARY ALGORITHM
This indicator features a proprietary algorithm developed through extensive research and testing. The code is protected and closed-source to preserve the intellectual property of the unique momentum deviation methodology.
⚠️ DISCLAIMER
This indicator is a technical analysis tool designed to assist in trading decisions. Past performance does not guarantee future results. Always conduct your own research and use proper risk management. This tool should be used as part of a comprehensive trading strategy, not as a standalone solution.
📈 UNLOCK PRECISION TRADING WITH MEDIAN TRENDSYNC
Experience the power of dual median analysis combined with advanced momentum deviation technology. Whether you're trading crypto, forex, stocks, or any other asset class, Median TrendSync adapts to deliver consistent, reliable signals across all market conditions.
Developed by GForge Trading Systems

Statistical Price Deviation Index (MAD/VWMA)SPDI is a statistical oscillator designed to detect potential price reversal zones by measuring how far price deviates from its typical behavior within a defined rolling window.
Instead of using momentum or moving averages like traditional indicators, SPDI applies robust statistics - a rolling median and Mean Absolute Deviation (MAD) - to calculate a normalized measure of price displacement. This normalization keeps the output bounded (from −1 to +1 by default), producing a stable and consistent oscillator that adapts to changing volatility conditions.
The second line in SPDI uses a Volume-Weighted Moving Average (VWMA) instead of a simple price median. This creates a complementary oscillator showing statistically weighted deviations based on traded volume. When both oscillators align in their extremes, strong confluence reversal signals are generated.
How It Works
For each bar, SPDI calculates the median price of the last N bars (default 100).
It then measures how far the current bar’s midpoint deviates from that rolling median.
The Mean Absolute Deviation (MAD) of those distances defines a “normal” range of fluctuation.
The deviation is normalized and compressed via a tanh mapping, keeping the oscillator in fixed boundaries (−1 to +1).
The same logic is applied to the VWMA line to gauge volume-weighted deviations.
How to Use
The blue line (Price MAD) represents pure price deviation.
The green line (VWMA Disp) shows the volume-weighted deviation.
Overbought (red) zones indicate statistically extreme upward deviation -> potential short-term overextension.
Oversold (green) zones indicate statistically extreme downward deviation -> potential rebound area.
Confluence signals (both lines hitting the same extreme) often mark strong reversal points.
Settings Tips
Lookback length controls how much historical data defines “normal” behavior. Larger = smoother, smaller = more sensitive.
Smoothing (RMA length) can reduce noise without changing the overall statistical logic.
Output scale can be set to either −1..+1 or 0..100, depending on your visual preference.
Alerts and color fills are fully customizable in the Style tab.
Summary:
SPDI transforms raw price and volume data into a statistically bounded deviation index. When both Price MAD and VWMA Disp reach joint extremes, it highlights probable market turning points - offering traders a clean, data-driven way to spot potential reversals ahead of time.

Smooth Theil-SenI wanted to build a Theil-Sen estimator that could run on more than one bar and produce smoother output than the standard implementation. Theil-Sen regression is a non-parametric method that calculates the median slope between all pairs of points in your dataset, which makes it extremely robust to outliers. The problem is that median operations produce discrete jumps, especially when you're working with limited sample sizes. Every time the median shifts from one value to another, you get a step change in your regression line, which creates visual choppiness that can be distracting even though the underlying calculations are sound.
The solution I ended up going with was convolving a Gaussian kernel around the center of the sorted lists to get a more continuous median estimate. Instead of just picking the middle value or averaging the two middle values when you have an even sample size, the Gaussian kernel weights the values near the center more heavily and smoothly tapers off as you move away from the median position. This creates a weighted average that behaves like a median in terms of robustness but produces much smoother transitions as new data points arrive and the sorted list shifts.
There are variance tradeoffs with this approach since you're no longer using the pure median, but they're minimal in practice. The kernel weighting stays concentrated enough around the center that you retain most of the outlier resistance that makes Theil-Sen useful in the first place. What you gain is a regression line that updates smoothly instead of jumping discretely, which makes it easier to spot genuine trend changes versus just the statistical noise of median recalculation. The smoothness is particularly noticeable when you're running the estimator over longer lookback periods where the sorted list is large enough that small kernel adjustments have less impact on the overall center of mass.
The Gaussian kernel itself is a bell curve centered on the median position, with a standard deviation you can tune to control how much smoothing you want. Tighter kernels stay closer to the pure median behavior and give you more discrete steps. Wider kernels spread the weighting further from the center and produce smoother output at the cost of slightly reduced outlier resistance. The default settings strike a balance that keeps the estimator robust while removing most of the visual jitter.
Running Theil-Sen on multiple bars means calculating slopes between all pairs of points across your lookback window, sorting those slopes, and then applying the Gaussian kernel to find the weighted center of that sorted distribution. This is computationally more expensive than simple moving averages or even standard linear regression, but Pine Script handles it well enough for reasonable lookback lengths. The benefit is that you get a trend estimate that doesn't get thrown off by individual spikes or anomalies in your price data, which is valuable when working with noisy instruments or during volatile periods where traditional regression lines can swing wildly.
The implementation maintains sorted arrays for both the slope calculations and the final kernel weighting, which keeps everything organized and makes the Gaussian convolution straightforward. The kernel weights are precalculated based on the distance from the center position, then applied as multipliers to the sorted slope values before summing to get the final smoothed median slope. That slope gets combined with an intercept calculation to produce the regression line values you see plotted on the chart.
What this really demonstrates is that you can take classical statistical methods like Theil-Sen and adapt them with signal processing techniques like kernel convolution to get behavior that's more suited to real-time visualization. The pure mathematical definition of a median is discrete by nature, but financial charts benefit from smooth, continuous lines that make it easier to track changes over time. By introducing the Gaussian kernel weighting, you preserve the core robustness of the median-based approach while gaining the visual smoothness of methods that use weighted averages. Whether that smoothness is worth the minor variance tradeoff depends on your use case, but for most charting applications, the improved readability makes it a good compromise.

Theil-Sen Line Filter [BackQuant]Theil-Sen Line Filter
A robust, median-slope baseline that tracks price while resisting outliers. Designed for the chart pane as a clean, adaptive reference line with optional candle coloring and slope-flip alerts.
What this is
A trend filter that estimates the underlying slope of price using a Theil-Sen style median of past slopes, then advances a baseline by a controlled fraction of that slope each bar. The result is a smooth line that reacts to real directional change while staying calm through noise, gaps, and single-bar shocks.
Why Theil-Sen
Classical moving averages are sensitive to outliers and shape changes. Ordinary least squares is sensitive to large residuals. The Theil-Sen idea replaces a single fragile estimate with the median of many simple slopes, which is statistically robust and less influenced by a few extreme bars. That makes the baseline steadier in choppy conditions and cleaner around regime turns.
What it plots
Filtered baseline that advances by a fraction of the robust slope each bar.
Optional candle coloring by baseline slope sign for quick trend read.
Alerts when the baseline slope turns up or down.
How it behaves (high level)
Looks back over a fixed window and forms many “current vs past” bar-to-bar slopes.
Takes the median of those slopes to get a robust estimate for the bar.
Optionally caps the magnitude of that per-bar slope so a single volatile bar cannot yank the line.
Moves the baseline forward by a user-controlled fraction of the estimated slope. Lower fractions are smoother. Higher fractions are more responsive.
Inputs and what they do
Price Source — the series the filter tracks. Typical is close; HL2 or HLC3 can be smoother.
Window Length — how many bars to consider for slopes. Larger windows are steadier and slower. Smaller windows are quicker and noisier.
Response — fraction of the estimated slope applied each bar. 1.00 follows the robust slope closely; values below 1.00 dampen moves.
Slope Cap Mode — optional guardrail on each bar’s slope:
None — no cap.
ATR — cap scales with recent true range.
Percent — cap scales with price level.
Points — fixed absolute cap in price points.
ATR Length / Mult, Cap Percent, Cap Points — tune the chosen cap mode’s size.
UI Settings — show or hide the line, paint candles by slope, choose long and short colors.
How to read it
Up-slope baseline and green candles indicate a rising robust trend. Pullbacks that do not flip the slope often resolve in trend direction.
Down-slope baseline and red candles indicate a falling robust trend. Bounces against the slope are lower-probability until proven otherwise.
Flat or frequent flips suggest a range. Increase window length or decrease response if you want fewer whipsaws in sideways markets.
Use cases
Bias filter — only take longs when slope is up, shorts when slope is down. It is a simple way to gate faster setups.
Stop or trail reference — use the line as a trailing guide. If price closes beyond the line and the slope flips, consider reducing exposure.
Regime detector — widen the window on higher timeframes to define major up vs down regimes for asset rotation or risk toggles.
Noise control — enable a cap mode in very volatile symbols to retain the line’s continuity through event bars.
Tuning guidance
Quick swing trading — shorter window, higher response, optionally add a percent cap to keep it stable on large moves.
Position trading — longer window, moderate response. ATR cap tends to scale well across cycles.
Low-liquidity or gappy charts — prefer longer window and a points or ATR cap. That reduces jumpiness around discontinuities.
Alerts included
Theil-Sen Up Slope — baseline’s one-bar change crosses above zero.
Theil-Sen Down Slope — baseline’s one-bar change crosses below zero.
Strengths
Robust to outliers through median-based slope estimation.
Continuously advances with price rather than re-anchoring, which reduces lag at turns.
User-selectable slope caps to tame shock bars without over-smoothing everything.
Minimal visuals with optional candle painting for fast regime recognition.
Notes
This is a filter, not a trading system. It does not account for execution, spreads, or gaps. Pair it with entry logic, risk management, and higher-timeframe context if you plan to use it for decisions.

MTF MidpointsOverview :
The MTF Midpoints indicator provides comprehensive multi-timeframe analysis by displaying mid points that act as support / resistance. It also comes with the ability to view trend strength across multiple timeframes.
Key Features :
1) Multi-Timeframe Support -
- 1 Minute, 5 Minute, 15 Minute, 1 Hour, and 4 Hour timeframes.
- Each timeframe displays its calculated midpoint level.
- Toggle individual timeframes on/off as needed.
2) Dynamic Trend Calculation
- Calculates trend direction based on configurable lookback period (default: 30 bars).
- Identifies swing highs and lows to determine trend changes.
- Computes midpoint levels as the average between current swing high and low.
- Tracks price action relative to midpoint to gauge trend strength.
3) Visual Elements -
- Colored Lines : Each timeframe displays as a distinct colored line.
- Fill Areas : Main timeframe shows colored fills above and below midpoint.
- Info Table : Real-time summary of all timeframe data with trend percentages.
4) Customization Options -
- Colors : Individual color settings for each timeframe.
- Display : Adjustable line width, label sizes, and positioning.
- Labels : Toggle price display in labels, customize text color and size.
- Info Table: Configurable info table with trend strength indicators.
How It Works :-
The indicator uses a proprietary algorithm that:
1. Monitors price action over a specified lookback period.
2. Identifies trend direction changes based on new highs/lows.
3. Calculates dynamic support/resistance levels (midpoints).
4. Tracks closes above/below midpoint to determine trend bias.
5. Displays trend strength as a percentage in both table and candle colors.
Trading Applications :-
- Confluence Analysis : Identify where multiple timeframe midpoints align.
- Support/Resistance : Use midpoints as dynamic S/R levels.
- Trend Assessment : Gauge trend strength across different timeframes.
- Entry/Exit Points : Look for price reactions at key midpoint levels.
- Risk Management : Use midpoints to set stop losses and profit targets.
Disclaimer :
This indicator is for educational and analysis purposes. It does not constitute financial advice. Always conduct your own research and consider your risk tolerance before making trading decisions. Past performance does not guarantee future results.

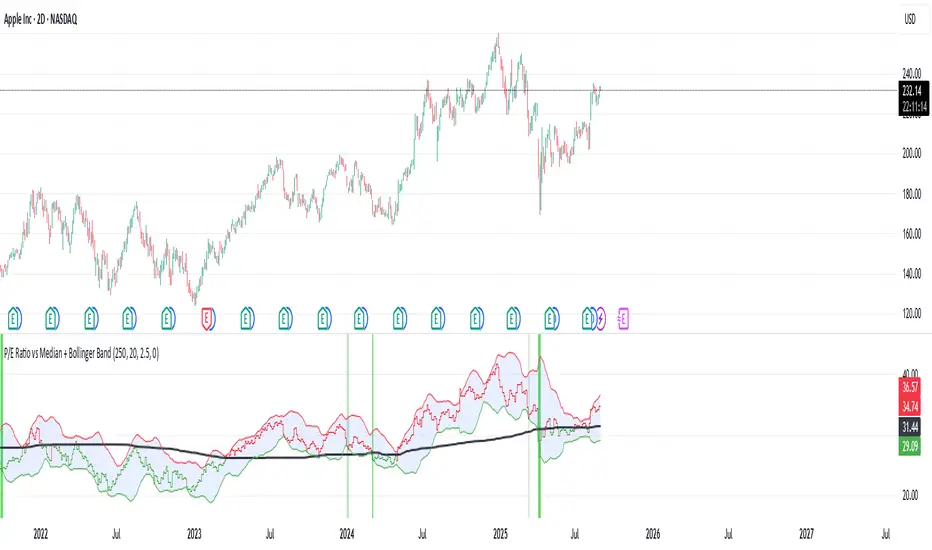
P/E Ratio vs Median + Bollinger Band- 📝 This indicator highlights potential buying opportunities by analyzing the Price-to-Earnings (P/E) ratio in relation to Bollinger Bands and its historical median.
- 🎯 The goal is to provide a visually intuitive signal for value-oriented entries, especially when valuation compression aligns with historical context.
- 💡 Vertical green shading is applied when the P/E ratio drops below the lower Bollinger Band, which is calculated directly from the P/E ratio itself — not price. This condition often signals the ticker may be oversold.
- 🟢 Lighter green appears when the ratio is below the lower band but above the median, suggesting a possible shorter-term entry with slightly more risk.
- 🟢 Darker green appears when the ratio is both below the lower band and below the median, pointing to a potentially stronger, longer-term value entry.
- ⚠️ This logic was tested using 1 and 2-day time frames. It may not be as helpful in longer time frames, as the financial data TradingView pulls in begins in Q4 2017.
- ⚠️ Note: This script relies on financial data availability through TradingView. It may not function properly with certain tickers — especially ETFs, IPOs, or thinly tracked assets — where P/S ratio data is missing or incomplete.
- ⚠️ This indicator will not guarantee successful results. Use in conjunction with other indicators and do your due diligence.
- 🤖 This script was iteratively refined with the help of AI to ensure clean logic, minimalist design, and actionable signal clarity.
- 📢 Idea is based on the script "Historical PE ratio vs median" by haribotagada
- 💬 Questions, feedback, or suggestions? Drop a comment — I’d love to hear how you’re using it or what you'd like to see changed.
Interpolated Median Volatility LSMA | OttoThis indicator combines trend-following and volatility analysis by enhancing traditional LSMA with percentile-based linear interpolation applied to both the Least Squares Moving Average (LSMA) and standard deviation. Rather than relying on raw values, it uses the interpolated median (50th percentile) to smooth out noise while preserving sensitivity to significant price shifts. This approach produces a cleaner trend signal that remains responsive to real market changes, adapts to evolving volatility conditions, and improves the accuracy of breakout detection.
Core Concept
The indicator builds on these core components:
LSMA (Least Squares Moving Average): A linear regression-based moving average that fits line using user selected source over user defined period. It offers a smoother and more reactive trend signal compared to standard moving averages.
Standard Deviation shows how much price varies from the mean. In this indicator, it’s used to measure market volatility.
Volatility Bands: Instead of traditional Bollinger-style bands, this script calculates custom upper and lower bands using percentile-based linear interpolation on both the LSMA and standard deviation. This method produces smoother bands that filter out noise while remaining adaptive to meaningful price movements, making them more aligned with real market behavior and helping reduce false signals.
Percentile interpolation estimates a specific percentile (like the median — the 50th percentile) from a set of values — even when that percentile doesn't fall exactly on one data point. Instead of selecting a single nearest value, it calculates a smoothed value between nearby points. In this script, it’s used to find the median of past LSMA and standard deviation values, reducing the impact of outliers and smoothing the trend and volatility signals for more robust results.
Signal Logic: A long signal is identified when close price goes above the upper band, and a short signal when close price goes below the lower band.
⚙️ Inputs
Source: The price source used in calculations
LSMA Length: Period for calculating LSMA
Standard Deviation Length: Period for calculating volatility
Percentile Length: Period used for interpolating percentile values of LSMA and standard deviation
Multiplier: Controls the width of the bands by scaling the interpolated standard deviation
📈 Visual Output
Colored LSMA Line: Changes color based on signal (green for bullish, purple for bearish)
Upper & Lower Bands: Volatility bands calculated using interpolated values (green for bullish, purple for bearish)
Bar Coloring: Price bars are colored to reflect signal state (green for bullish, purple for bearish)
Optional Candlestick Overlay: Enhances visual context by coloring candles to match the signal state (green for bullish, purple for bearish)
How to Use
Add the indicator to your chart and look for signals when close price goes above or below the bands.
Long Signal: close Price goes above the upper band
Short Signal: close Price goes below the lower band
🔔 Alerts:
This script supports alert conditions for long and short signals. You can set alerts based on band crossovers to be notified of potential entries/exits.
⚠️ Disclaimer:
This indicator is intended for educational and informational purposes only. Trading/investing involves risk, and past performance does not guarantee future results. Always test and evaluate strategies before applying them in live markets. Use at your own risk.

Median True Range {Darkoexe}Simple and sweet, this is the median true range. It reviews the size of the previous period amount of candles, and displays the candle size value that is the median of those previous values.
//Darkoexe

Savitzky Golay Median Filtered RSI [BackQuant]Savitzky Golay Median Filtered RSI
Introducing BackQuant's Savitzky Golay Median Filtered RSI, a cutting-edge indicator that enhances the classic Relative Strength Index (RSI) by applying both a Savitzky-Golay filter and a median filter to provide smoother and more reliable signals. This advanced approach helps reduce noise and captures true momentum trends with greater precision. Let’s break down how the indicator works, the features it offers, and how it can improve your trading strategy.
Core Concept: Relative Strength Index (RSI)
The Relative Strength Index (RSI) is a widely used momentum oscillator that measures the speed and change of price movements. It oscillates between 0 and 100, with levels above 70 typically indicating overbought conditions and levels below 30 indicating oversold conditions. However, the standard RSI can sometimes generate noisy signals, especially in volatile markets, making it challenging to identify reliable entry and exit points.
To improve upon the traditional RSI, this indicator introduces two powerful filters: the Savitzky-Golay filter and a median filter.
Savitzky-Golay Filter: Smoothing with Precision
The Savitzky-Golay filter is a digital filtering technique used to smooth data while preserving important features, such as peaks and trends. Unlike simple moving averages that can distort important price data, the Savitzky-Golay filter uses polynomial regression to fit the data, providing a more accurate and less lagging result.
In this script, the Savitzky-Golay filter is applied to the RSI values to smooth out short-term fluctuations and provide a more reliable signal. By using a window size of 5 and a polynomial degree of 2, the filter effectively reduces noise without compromising the integrity of the underlying price movements.
Median Filter: Reducing Outliers
After applying the Savitzky-Golay filter, the median filter is applied to the smoothed RSI values. The median filter is particularly effective at removing short-lived outliers, further enhancing the accuracy of the RSI by reducing the impact of sudden and temporary price spikes or drops. This combination of filters creates an ultra-smooth RSI that is better suited for detecting true market trends.
Long and Short Signals
The Savitzky Golay Median Filtered RSI generates long and short signals based on user-defined threshold levels:
Long Signals: A long signal is triggered when the filtered RSI exceeds the Long Threshold (default set at 176). This indicates that momentum is shifting upward, and it may present a good buying opportunity.
Short Signals: A short signal is generated when the filtered RSI falls below the Short Threshold (default set at 162). This suggests that momentum is weakening, potentially signaling a selling opportunity or exit from a long position.
These threshold levels can be adjusted to suit different market conditions and timeframes, allowing traders to fine-tune the sensitivity of the indicator.
Customization and Visualization Options
The Savitzky Golay Median Filtered RSI comes with several customization options, enabling traders to tailor the indicator to their specific needs:
Calculation Source: Select the price source for the RSI calculation (default is OHLC4, but it can be changed to close, open, high, or low prices).
RSI Period: Adjust the lookback period for the RSI calculation (default is 14).
Median Filter Length: Control the length of the median filter applied to the smoothed RSI, affecting how much noise is removed from the signal.
Threshold Levels: Customize the long and short thresholds to define the sensitivity for generating buy and sell signals.
UI Settings: Choose whether to display the RSI and thresholds on the chart, color the bars according to trend direction, and adjust the line width and colors used for long and short signals.
Visual Feedback: Color-Coded Signals and Thresholds
To make the signals easier to interpret, the indicator offers visual feedback by coloring the price bars and the RSI plot according to the current market trend:
Green Bars indicate long signals when momentum is bullish.
Red Bars indicate short signals when momentum is bearish.
Gray Bars indicate neutral or undecided conditions when no clear signal is present.
In addition, the Long and Short Thresholds can be plotted directly on the chart to provide a clear reference for when signals are triggered, allowing traders to visually gauge the strength of the RSI relative to its thresholds.
Alerts for Automation
For traders who prefer automated notifications, the Savitzky Golay Median Filtered RSI includes built-in alert conditions for long and short signals. You can configure these alerts to notify you when a buy or sell condition is met, ensuring you never miss a trading opportunity.
Trading Applications
This indicator is versatile and can be used in a variety of trading strategies:
Trend Following: The combination of Savitzky-Golay and median filtering makes this RSI particularly useful for identifying strong trends without being misled by short-term noise. Traders can use the long and short signals to enter trades in the direction of the prevailing trend.
Reversal Trading: By adjusting the threshold levels, traders can use this indicator to spot potential reversals. When the RSI moves from overbought to oversold levels (or vice versa), it may signal a shift in market direction.
Swing Trading: The smoothed RSI provides a clear signal for short to medium-term price movements, making it an excellent tool for swing traders looking to capitalize on momentum shifts.
Risk Management: The filtered RSI can be used as part of a broader risk management strategy, helping traders avoid false signals and stay in trades only when the momentum is strong.
Final Thoughts
The Savitzky Golay Median Filtered RSI takes the classic RSI to the next level by applying advanced smoothing techniques that reduce noise and improve signal reliability. Whether you’re a trend follower, swing trader, or reversal trader, this indicator provides a more refined approach to momentum analysis, helping you make better-informed trading decisions.
As with all indicators, it is important to backtest thoroughly and incorporate sound risk management strategies when using the Savitzky Golay Median Filtered RSI in your trading system.
Thus following all of the key points here are some sample backtests on the 1D Chart
Disclaimer: Backtests are based off past results, and are not indicative of the future.
INDEX:BTCUSD
INDEX:ETHUSD
BINANCE:SOLUSD

Median Speed BarThe "Median Speed Bar" is a custom trading indicator designed to classify market candlesticks based on their volatility relative to historical price ranges. It calculates two median price ranges: a short-term median using a customizable period and a long-term median over a much larger timeframe. These medians are based on either the difference between the opening and closing prices or the high and low prices of the candlesticks, depending on user input. The percentage ratio of the short-term median to the long-term median is used to categorize the current candlestick into one of four types: EXTREME, FAST, NORMAL, or SLOW. Each category is linked to customizable thresholds, which are set by the user as percentages.
The script then displays the classification of the current bar in a table at the bottom right corner of the chart, offering an easily readable overview of current market conditions. If the bar's percentage exceeds the extreme threshold, it's classified as "EXTREME" and highlighted in red. Other categories—FAST, NORMAL, and SLOW—are visually distinguished by different colors (orange, green, and blue, respectively). This allows traders to quickly assess volatility and make informed decisions based on how the current price action compares to historical medians.

Median Supertrend [BackQuant]Median Supertrend Concept by BackQuant ©
This was created since the normal supertrend is noisy, in the attempts to remove that and still get a good signal we decided to use a special median calculation as the source to a modified supertrend. This allows us to reduce noise, and make the supertrend adaptive to volatility. The full description and reasoning, including definitions and backtests are as follows:
1. Definition of Median
The median is a statistical measure that identifies the middle value in a given set of numbers when those numbers are arranged in either ascending or descending order. If the dataset has an even number of observations, the median is calculated as the average of the two middle numbers. This measure is particularly useful in understanding the central tendency of data, especially in cases where the dataset may contain outliers that could skew the mean. For example, in a dataset representing the earnings of families, the median provides a more accurate reflection of the typical income than the mean if the dataset includes extreme values.
2. Understanding Supertrend and Its Use Case
Supertrend is a popular trend-following indicator used in technical analysis. It is computed using the Average True Range (ATR) to capture volatility, combined with a moving average. The indicator provides clear signals to traders about bullish or bearish trends, indicating potential entry and exit points. Traders often use Supertrend in various market conditions to enhance their trading strategies, leveraging its simplicity and effectiveness in identifying ongoing trends and reversals.
3. Rationale Behind Combining Median with Supertrend
The integration of the median into the Supertrend indicator seeks to mitigate the impact of outliers and sudden market spikes that can affect trend analysis. By using the median value of price data for trend determination, the Median Supertrend aims to offer a more stable and reliable indicator that reflects the underlying market conditions more accurately than traditional methods. This modification is intended to improve the timing of trend detection and the precision of entry and exit signals.
4. Key Differences and Benefits
Enhanced Stability: The use of median values reduces sensitivity to extreme price movements, offering a smoother trend line that can lead to more reliable trading signals.
Adaptive Sensitivity: Users can adjust the indicator's sensitivity to align with different trading styles and market conditions through customizable parameters like the ATR multiplier and lookback period.
Explicit Trading Signals: The indicator simplifies the trading process by providing clear, actionable long and short signals based on trend reversals, aiding in decision-making.
Customizability: Options to use Heikin Ashi candles, paint candles based on the trend, and toggle signal visibility allow traders to personalize the indicator to their preference.
5. User Inputs
The Median Supertrend indicator includes several user inputs to tailor its operation:
Use HA Candles as Source?: Option to base calculations on Heikin Ashi candles for smoother price data.
Paint Candles According to Trend?: Visual aid that colors candles based on the current trend direction, enhancing chart readability.
ATR Period and Multiplier: Parameters to adjust the sensitivity of the trend detection, allowing users to fine-tune the indicator.
Adaptive Lookback Period: Defines the period for the median calculation, offering flexibility in trend assessment.
Show Long and Short Signals: Enables traders to visualize entry signals directly on the chart.
6. Application in Trading
Traders can incorporate the Median Supertrend into their strategies as a standalone indicator for trend following or as a filter in a multi-indicator system. It is particularly useful in markets known for having outliers or sudden price jumps, as the median-based calculation provides a grounded trend analysis. This indicator can be applied across various timeframes and asset classes, making it a versatile tool for day traders, swing traders, and long-term investors alike.
7. Summary and Empirical Soundness
The integration of median values into the Supertrend indicator represents an innovative approach to trend analysis, addressing some of the volatility and outlier-related challenges inherent in traditional methods. This combination is empirically sound as it leans on the statistical robustness of the median to offer a more stable and reliable trend determination mechanism.
8. Relavant Backtests on Major Assets (1D Timeframe)
We include these backtests as a general proxy for how they work.
Please do your own calibrating to suit it to your own needs and backtest.
Past results don't = future results but they can help you understand how it functions.
INDEX:BTCUSD
INDEX:ETHUSD
BINANCE:SOLUSD

series_collectionLibrary "series_collection"
A personal collection of commonly used series types like moving averages that are supported directly by
the pinescript library ('ALMA', 'DEMA', 'EMA', 'HMA', 'RMA', 'SMA', 'SWMA', 'VWMA', 'WMA'), highest and lowest source,
median and pivots. One single function (with overloads) that can be configured easily by the user input and can be
used as a core piece of functionality for many user cases. This library was created to abstract away and re-use this
commonly used functionality in my "Two MA Signal Indicator" script and the "Template Trailing Strategy" script. Both
of them use the "two_ma_logic" for defining entry and exit signals. While this piece of work does not contain any
novel mathematical expressions and just adds a convinient (and configurable) way to do things, I hope that might add
value to other scripts as well and future projects.
cust_series(length, seriesType, source)
cust_series - Calculate the custom series of the given source for the given length and type
Parameters:
length (simple int) : - The length of the custom series
seriesType (simple string) : - The type of the custom series
source (float) : - The source of the values
Returns: - The resulting value of the calculations of the custom series
cust_series(length, seriesType, source)
cust_series - Calculate the custom series of the given source for the given length and type
Parameters:
length (simple float) : - The length of the custom series (ceiled)
seriesType (simple string) : - The type of the custom series
source (float) : - The source of the values
Returns: - The resulting value of the calculations of the custom series

Standardized Median Proximity [AlgoAlpha]Introducing the Standardized Median Proximity by AlgoAlpha 🚀📊 – a dynamic tool designed to enhance your trading strategy by analyzing price fluctuations relative to the median value. This indicator is built to provide clear visual cues on the price deviation from its median, allowing for a nuanced understanding of market trends and potential reversals.
🔍 Key Features:
1. 📈 Median Tracking: At the core of this indicator is the calculation of the median price over a specified lookback period. By evaluating the current price against this median, the indicator provides a sense of whether the price is trending above or below its recent median value.
medianValue = ta.median(priceSource, lookbackLength)
2. 🌡️ Normalization of Price Deviation: The deviation of the price from the median is normalized using standard deviation, ensuring that the indicator's readings are consistent and comparable across different time frames and instruments.
standardDeviation = ta.stdev(priceDeviation, 45)
normalizedValue = priceDeviation / (standardDeviation + standardDeviation)
3. 📌 Boundary Calculations: The indicator sets upper and lower boundaries based on the normalized values, helping to identify overbought and oversold conditions.
upperBoundary = ta.ema(positiveValues, lookbackLength) + ta.stdev(positiveValues, lookbackLength) * stdDevMultiplier
lowerBoundary = ta.ema(negativeValues, lookbackLength) - ta.stdev(negativeValues, lookbackLength) * stdDevMultiplier
4. 🎨 Visual Appeal and Clarity: With carefully chosen colors, the plots provide an intuitive and clear representation of market states. Rising trends are indicated in a shade of green, while falling trends are shown in red.
5. 🚨 Alert Conditions: Stay ahead of market movements with customizable alerts for trend shifts and impulse signals, enabling timely decisions.
alertcondition(ta.crossover(normalizedValue, 0), "Bullish Trend Shift", "Median Proximity Crossover Zero Line")
🔧 How to Use:
- 🎯 Set your preferred lookback lengths and standard deviation multipliers to tailor the indicator to your trading style.
- 💹 Utilize the boundary plots to understand potential overbought or oversold conditions.
- 📈 Analyze the color-coded column plots for quick insights into the market's direction relative to the median.
- ⏰ Set alerts to notify you of significant trend changes or conditions that match your trading criteria.
Basic Logic Explained:
- The indicator first calculates the median of the selected price source over your chosen lookback period. This median serves as a baseline for measuring price deviation.
- It then standardizes this deviation by dividing it by the standard deviation of the price deviation over a 45-period lookback, creating a normalized value.
- Upper and lower boundaries are computed using the exponential moving average (EMA) and standard deviation of these normalized values, adjusted by your selected multiplier.
- Finally, color-coded plots provide a visual representation of these calculations, offering at-a-glance insights into market conditions.
Remember, while this tool offers valuable insights, it's crucial to use it as part of a comprehensive trading strategy, complemented by other analysis and indicators. Happy trading!
🚀

Median Proximity Percentile [AlgoAlpha]📊🚀 Introducing the "Median Proximity Percentile" by AlgoAlpha, a dynamic and sophisticated trading indicator designed to enhance your market analysis! This tool efficiently tracks median price proximity over a specified lookback period and finds it's percentile between 2 dynamic standard deviation bands, offering valuable insights for traders looking to make informed decisions.
🌟 Key Features:
Color-Coded Visuals: Easily interpret market trends with color-coded plots indicating bullish or bearish signals.
Flexibility: Customize the indicator with your preferred price source and lookback lengths to suit your trading strategy.
Advanced Alert System: Stay ahead with customizable alerts for key trend shifts and market conditions.
🔍 Deep Dive into the Code:
Choose your preferred price data source and define lookback lengths for median and EMA calculations. priceSource = input.source(close, "Source") and lookbackLength = input.int(21, minval = 1, title = "Lookback Length")
Calculate median value, price deviation, and normalized value to analyze market position relative to the median. medianValue = ta.median(priceSource, lookbackLength)
Determine upper and lower boundaries based on standard deviation and EMA. upperBoundary = ta.ema(positiveValues, lookbackLength) + ta.stdev(positiveValues, lookbackLength) * stdDevMultiplier
lowerBoundary = ta.ema(negativeValues, lookbackLength) - ta.stdev(negativeValues, lookbackLength) * stdDevMultiplier
Compute the percentile value to track market position within these boundaries. percentileValue = 100 * (normalizedValue - lowerBoundary)/(upperBoundary - lowerBoundary) - 50
Enhance your analysis with Hull Moving Average (HMA) for smoother trend identification. emaValue = ta.hma(percentileValue, emaLookbackLength)
Visualize trends with color-coded plots and characters for easy interpretation. plotColor = percentileValue > 0 ? colorUp : percentileValue < 0 ? colorDown : na
Set up advanced alerts to stay informed about significant market movements. // Alerts
alertcondition(ta.crossover(emaValue, 0), "Bullish Trend Shift", "Median Proximity Percentile Crossover Zero Line")
alertcondition(ta.crossunder(emaValue, 0), "Bearish Trend Shift", "Median Proximity Percentile Crossunder Zero Line")
alertcondition(ta.crossunder(emaValue,emaValue ) and emaValue > 90, "Bearish Reversal", "Median Proximity Percentile Bearish Reversal")
alertcondition(ta.crossunder(emaValue ,emaValue) and emaValue < -90, "Bullish Reversal", "Median Proximity Percentile Bullish Reversal")
🚨 Remember, the "Median Proximity Percentile " is a tool to aid your analysis. It’s essential to combine it with other analysis techniques and market understanding for best results. Happy trading! 📈📉

FlexiMA Variance Tracker [presentTrading]🔶 Introduction and How it is Different
The FlexiMA Variance Tracker (FlexiMA-VT) represents a novel approach in technical analysis, distinctively standing out in the realm of financial market indicators. It leverages the concept of a variable Length Moving Average (MA) to create a versatile and dynamic oscillator. Unlike traditional oscillators that rely on a fixed-length MA, the FlexiMA-VT adapts to market conditions by varying the length of the MA, offering a more responsive and nuanced view of market trends. (*The achieved method took reference from SuperTrend Polyfactor Oscillator)
This innovative design allows the FlexiMA-VT to capture a broader spectrum of market movements, making it highly effective in diverse trading environments. Whether in stable or volatile markets, its adaptability ensures consistent relevance, providing traders with deeper insights into potential market swings.
The proposed oscillator accentuates several key aspects through a distinctive mesh of bars, which are derived from the differences between the price and a set of 20 Moving Averages, each altered by varying factors. The intensity of the mesh's colors serves as an indicator, with brighter hues signifying a greater convergence of Moving Average signals.
Starting Length = 5
Starting Length = 40
🔶 Strategy, How it Works: Detailed Explanation
1. Core Concept:
The FlexiMA-VT operates by comparing the price or an average value (indicator source) against a set of moving averages with varying lengths.
These lengths are dynamically adjusted through a starting factor and multiple increment factors, ensuring a comprehensive analysis over different time scales.
2. Normalization and Standard Deviation Calculation:
Once deviations are calculated, they undergo a normalization process, which can be set to 'None', 'Max-Min', or 'Absolute Sum'.
This step is crucial as it standardizes the deviations, allowing for a consistent scale of comparison.
The standard deviation of these normalized deviations is then calculated, offering insights into the market’s volatility and potential trend strength.
🔹Normalization
3. Median Value and Oscillator Creation:
The median of the normalized deviations forms the core of the FlexiMA-VT oscillator.
This median value provides a balanced central point, reflecting the consensus of various MA lengths.
The standard deviation bands plotted around the median enhance the interpretative power of the oscillator, indicating potential overbought or oversold conditions.
4. Multi-Factor Analysis:
The FlexiMA-VT uses multiple increment factors to generate a range of MAs, each factor representing a different scale of trend analysis.
By averaging the results from these different scales, the FlexiMA-VT forms a more comprehensive and reliable oscillator.
🔹Consensus
5. Practical Application:
Traders can use the FlexiMA-VT for various purposes, including identifying trend reversals, gauging market momentum, and determining overbought or oversold conditions.
Its dynamic nature makes it adaptable to different trading strategies, from short-term scalping to long-term position trading.
🔶 Settings
1. Indicator Source (indicatorSource): Determines the base data for calculations, typically a price average (HLC3).
2. Indicator Length (indicatorLength): Sets the base length for Moving Averages, influencing initial calculations.
3. Starting Factor (startingFactor): Initial multiplier for MA length, impacting the starting point of analysis.
4. Increment Factors (incrementFactor_1, incrementFactor_2, incrementFactor_3): Modulate the rate of change in MA lengths, adding variability.
5. Normalization Method (normalizeMethod): Standardizes deviations, with methods like 'Max-Min' and 'Absolute Sum' for comparability.

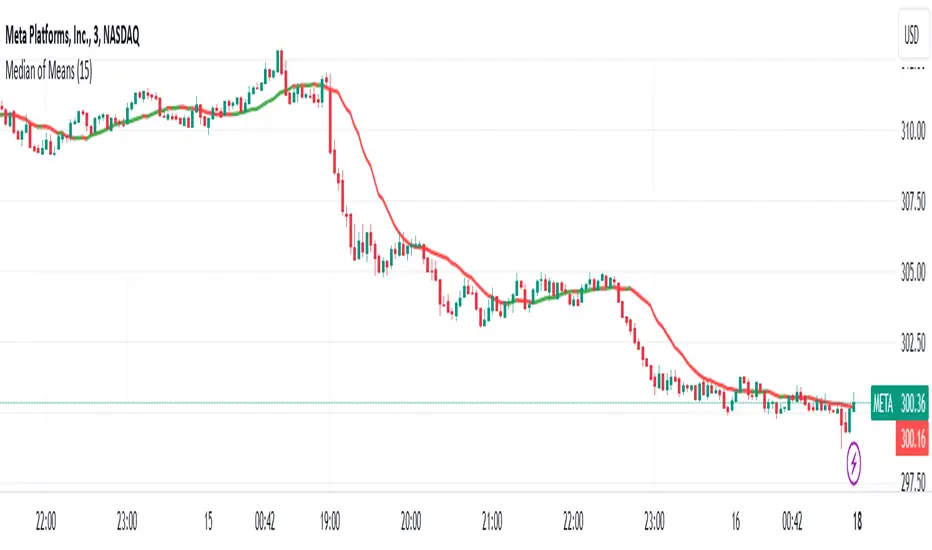
Trend Shift ProThe indicator is designed to identify shifts or changes in trends as blocks, the indicator's focus on analyzing the Median of Means, Interquartile Range, and Practical Significance for potential trend changes in the market using non parametric Cohen's D. The script is designed to operate on blocks of 21 bars. The key parts of the script related to this are the conditions inside the "if" statements: The bar_index % 21 == 0 condition checks if the current bar index is divisible by 21, meaning it's the beginning of a new block of 21 bars. This condition is used to reset and calculate new values at the start of each block.
Therefore, signals or calculations related to the median of means (MoM), interquartile range (IQR), and Cohen's D are updated and calculated once every 21 bars. What this means is the frequency of signals is shown once every 21 bars.
Price Movements of Blocks:
Block-Based Analysis: This approach divides the price data into blocks or segments, often a fixed number of bars or candles. Each block represents a specific interval of time or price action. It involves No Smoothing: Unlike moving averages, block-based analysis does not apply any smoothing to the price data within each block. It directly examines the raw prices within each block.
Let's break down the key concepts and how they are used for trading:
Median of Means (MoM):
The script calculates the median of the means of seven subgroups, each consisting of three bars in shuffled order.
Each subgroup's mean is calculated based on the typical price (hlc3) of the bars within that subgroup.
The median is then computed from these seven means, representing a central tendency measure.
Note: The Median of Means provides a robust measure of central tendency, especially in situations where the dataset may have outliers or exhibit non-normal distribution characteristics. By calculating means within smaller subgroups, the method is less sensitive to extreme values that might unduly influence the overall average. This can make the Median of Means more robust than a simple mean or median when dealing with datasets that have heterogeneity or skewed distributions.
Interquartile Range (IQR):
The script calculates the IQR for each block of 21 bars.
The IQR is a measure of statistical dispersion, representing the range between the first quartile (Q1) and the third quartile (Q3) of the data.
Q1 and Q3 are calculated from the sorted array of closing prices of the 21 bars.
Non-Parametric Cohen's D Calculation:
Cohen's D is a measure of effect size, indicating the standardized difference between two means.
In this script, a non-parametric version of Cohen's D is calculated, comparing the MoM values of the current block with the MoM values of the previous block.
The calculation involves the MoM difference divided by the square root of the average squared IQR values.
Practical Significance Threshold:
The user can set a threshold for practical significance using the Threshold input.
The script determines practical significance by comparing the calculated Cohen's D with this threshold.
Plotting:
The script plots the MoM values using both straight lines and circles, with the color of the circles indicating the direction of the MoM change (green for upward, red for downward, and blue for no change).
Triangular shapes are plotted when the absolute value of Cohen's D is less than the practical significance threshold.
Overall Purpose for Trading:
The indicator is designed to help traders identify potential turning points or shifts in market sentiment. and use it as levels which needs to be crossed to have a new trend.
Changes in MoM, especially when accompanied by practical significance as determined by Cohen's D, may signal the start of a new trend or a significant move in the market.
Traders using this indicator would typically look for instances where the MoM values and associated practical significance suggest a high probability of a trend change, providing them with potential entry or exit signals. It's important for users to backtest and validate the indicator's effectiveness in different market conditions before relying on it for trading decisions.

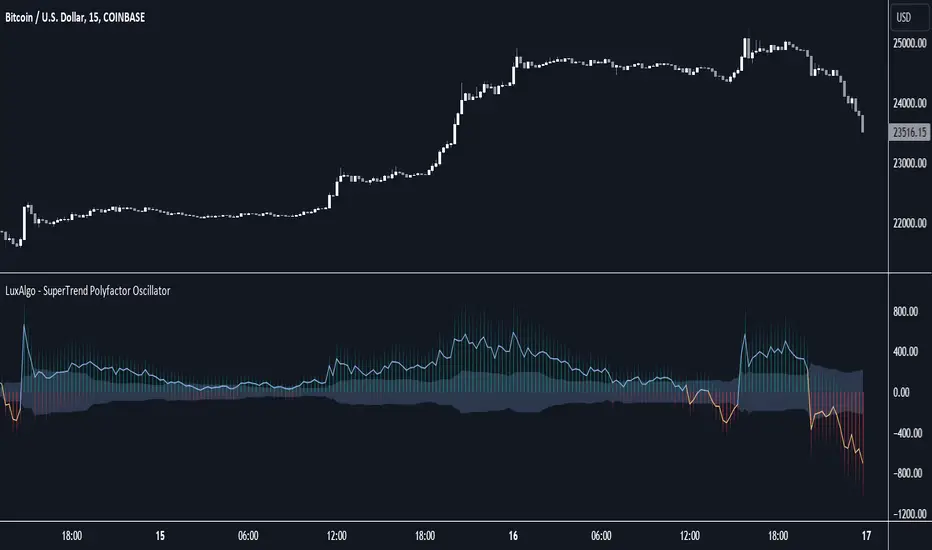
SuperTrend Polyfactor Oscillator [LuxAlgo]The SuperTrend Polyfactor Oscillator is an oscillator based on the popular SuperTrend indicator that aims to highlight information returned by a collection of SuperTrends with varying factors inputs.
A general consensus is calculated from all this information, returning an indication of the current market sentiment.
🔶 USAGE
Multiple elements are highlighted by the proposed oscillator. A mesh of bars is constructed from the difference between the price and a total of 20 SuperTrends with varying factors. Brighter colors of the mesh indicate a higher amount of aligned SuperTrends indications.
The factor input of the SuperTrends is determined by the user from the Starting Factor setting which determines the factor of the shorter-term SuperTrend, and the Increment settings which control the step between each factor inputs.
Using higher values for these settings will return information for longer-term term price variations.
🔹 Consensus
From the collection of SuperTrends, a consensus is obtained. It is calculated as the median of all the differences between the price and the collection of SuperTrends.
This consensus is highlighted in the script by a blue and orange line, with a blue color indicating an overall bullish market, and orange indicating a bearish market.
Both elements can be used together to highlight retracements within a trend. If we see various red bars while the general consensus is bullish, we can interpret it as the presence of a retracement.
🔹 StDev Area
The indicator includes an area constructed from the standard deviation of all the differences between the price and the collection of SuperTrends.
This area can be useful to see if the market is overall trending or ranging, with a consensus over the area indicative of a trending market.
🔹 Normalization
Users can decide to normalize the results and constrain them within a specific range, this can allow obtaining a lower degree of variations of the indicator outputs. Two methods are proposed "Absolute Sum", and "Max-Min".
The "Absolute Sum" method will divide any output returned by the indicator by the absolute sum of all the differences between the price and SuperTrends. This will constrain all the indicator elements in a (1, -1) scale.
The "Max-Min" method will apply min-max normalization to the indicator outputs (with the exception of the stdev area). This will constrain all the indicator elements in a (0, 1) scale.
🔶 SETTINGS
Length: ATR Length of all calculated SuperTrends.
Starting Factor: Factor input of the shorter-term SuperTrend.
Increment: Step value between all SuperTrends factors.
Normalize: Normalization method used to rescale the indicator output.
Median of Means Estimator Median of Means (MoM) is a measure of central tendency like mean (average) and median. However, it could be a better and robust estimator of central tendency when the data is not normal, asymmetric, have fat tails (like stock price data) and have outliers. The MoM can be used as a robust trend following tool and in other derived indicators.
Median of means (MoM) is calculated as follows, the MoM estimator shuffles the "n" data points and then splits them into k groups of m data points (n= k*m). It then computes the Arithmetic Mean of each group (k). Finally, it calculate the median over the resulting k Arithmetic Means. This technique diminishes the effect that outliers have on the final estimation by splitting the data and only considering the median of the resulting sub-estimations. This preserves the overall trend despite the data shuffle.
Below is an example to illustrate the advantages of MoM
Set A Set B Set C
3 4 4
3 4 4
3 5 5
3 5 5
4 5 5
4 5 5
5 5 5
5 5 5
6 6 8
6 6 8
7 7 10
7 7 15
8 8 40
9 9 50
10 100 100
Median 5 5 5
Mean 5.5 12.1 17.9
MoM 5.7 6.0 17.3
For all three sets the median is the same, though set A and B are the same except for one outlier in set B (100) it skews the mean but the median is resilient. However, in set C the group has several high values despite that the median is not responsive and still give 5 as the central tendency of the group, but the median of means is a value of 17.3 which is very close to the group mean 17.9. In all three cases (set A, B and C) the MoM provides a better snapshot of the central tendency of the group. Note: The MoM is dependent on the way we split the data initially and the value might slightly vary when the randomization is done sevral time and the resulting value can give the confidence interval of the MoM estimator.
Oscillator Profile IndicatorDescription:
The Oscillator Profile Indicator (OPI) is designed to provide insights into market trends and potential reversal points by profiling the value distribution of an oscillator or the price chart over a specified lookback period.
The OPI works by calculating the Point of Control (PoC) for the oscillator values or prices in the given lookback period. This PoC, essentially a median, is considered the fair value where most trading activities have happened. Along with this, OPI also calculates lower and upper boundaries by taking the specified percentile of the sorted distribution of values. These boundaries outline the value area within which a significant portion of trading activity has occurred.
The main feature of the OPI is the interpretation of PoC movement and how it relates to general market trends. If the PoC moves above 0 on the oscillator, it's a potential indication that we are in a general uptrend. Conversely, if the PoC moves below 0, this can be a signal for a general downtrend.
Usage:
While OPI can be used on both price charts and oscillators, its effectiveness is more pronounced when used on oscillators. Applying this indicator to oscillators such as the Relative Strength Index (RSI) or the Moving Average Convergence Divergence (MACD) can provide useful insights.
How to Read:
PoC line: The line represents the median of the past 'n' periods. Its movement above or below 0 can be used to identify general uptrends or downtrends respectively.
Upper and Lower Boundary lines: These lines represent the specified percentile of the value distribution in the lookback period.
Colored Fills: The fills between the upper and lower boundary lines visually represent the value area. The color changes based on the relative position of the source value (price or oscillator value) to the PoC.
Signals:
An uptrend is indicated when the PoC moves above 0 on the oscillator, especially when coupled with an upward crossover of the source value through the PoC.
A downtrend is signaled when the PoC drops below 0 on the oscillator, particularly when paired with a downward crossover of the source value through the PoC.
(!) Note: Like all indicators, OPI should be used in conjunction with other technical analysis tools for the best results. It is also advisable to backtest this indicator with your strategy before using it in live trading.

50% candlestick closeThis indicator is useful at important level, when you want to see some bullish or bearish signs in candlestick.
At your important support level you can buy, if candlestick close is above 50% of its range, with low of this candlestick as SL.
At your important resistance level you can sell, if candlestick close is below 50% of its range, with high of this candlestick as SL.

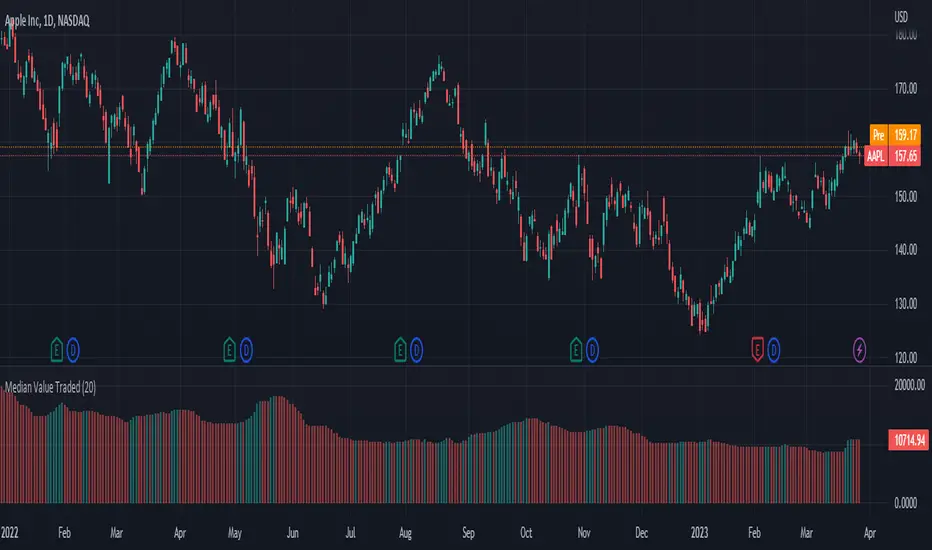
Median Value TradedThe Median Value Traded script is an indicator that allows traders to visualize the median value traded for a particular asset. The median value traded is an important metric as it provides a clearer understanding of the trading activity for an asset, which can be used to inform trading strategies.
To use this script, simply add it to your chart and adjust the "Lookback Period" input as desired. The "Lookback Period" input determines the number of bars used in the median calculation, with a default value of 20.
The median value traded is calculated by taking the product of the volume and closing price for each bar in the lookback period, calculates the median value, and then divides by one million for easier readability.
The script also includes color inputs for the positive and negative columns, allowing traders to customize the appearance of the plot to their liking.
Overall, the Median Value Traded script is a useful tool for traders looking to gain a deeper understanding of trading activity for a particular asset.