SMA MAD Trend [Alpha Extract]A sophisticated trend identification system that combines Simple Moving Average with Mean Absolute Deviation methodology to create adaptive Super Trend-style bands with advanced strength filtering and gradient visualization. Utilizing ADX-based trend strength validation and slope analysis for signal quality enhancement, this indicator delivers institutional-grade trend detection with dynamic ATR-based ribbon visualization and comprehensive strength measurement. The system's dual-filter architecture eliminates false signals during weak or choppy market conditions while maintaining sensitivity to genuine trend establishment and reversal events.
🔶 Advanced SMA-MAD Band Construction
Implements innovative Mean Absolute Deviation calculation around Simple Moving Average baseline to create volatility-adaptive bands with ratcheting logic for trend persistence. The system calculates MAD by measuring absolute price deviations from the mean, then applies configurable multipliers to generate upper and lower bands that adjust to changing market conditions while preventing premature band violations.
// Core SMA-MAD Framework
SMA_Value = ta.sma(close, SMA_Length)
Mean = ta.sma(close, MAD_Length)
Abs_Deviation = abs(close - Mean)
MAD_Value = ta.sma(Abs_Deviation, MAD_Length)
// Adaptive Bands
Upper_Band = SMA_Value + MAD_Factor * MAD_Value
Lower_Band = SMA_Value - MAD_Factor * MAD_Value
🔶 Intelligent Dual-Filter System
Features comprehensive trend validation using ADX strength measurement and slope analysis to eliminate low-conviction signals during ranging or consolidating markets. The system calculates normalized slope strength using ATR scaling and combines with ADX threshold analysis, generating filtered trend states that distinguish genuine trends from temporary price fluctuations.
🔶 Dynamic Trend Strength Engine
Implements sophisticated strength calculation combining slope intensity and ADX readings to produce normalized 0-100% strength scores with gradient colour intensity modulation. The system normalizes slope by minimum threshold and ADX by configurable level, multiplying factors to create composite strength measurement that drives visual feedback intensity across all indicator elements.
🔶 Super Trend-Style Direction Logic
Utilizes classic Super Trend methodology adapted for SMA-MAD bands, where trend direction flips occur on opposite band violations with persistent state maintenance. The system tracks previous band levels with ratcheting behaviour that adjusts bands only when price movement or new calculations warrant changes, preventing oscillation during normal volatility.
🔶 ATR-Based Ribbon Visualization
Provides dynamic ribbon overlay using ATR-scaled width around the trend line with opacity modulation based on trend strength for intuitive conviction assessment. The system creates upper and lower ribbon bounds at configurable ATR multiples, filling the channel with gradient-adjusted transparency that increases during strong trends and fades during weak conditions.
🔶 Multi-Dimensional Visual Architecture
Provides complete chart integration through trend line overlay, ATR ribbon fills, candle colouring, background glow, and transition signal labels with configurable visibility toggles. The system enables traders to customize display density from minimal (trend line only) to comprehensive (all visual elements) while maintaining consistent colour scheme and strength-based intensity across components.
🔶 Slope Strength Validation
Calculates ATR-normalized slope over configurable lookback periods to measure trend line momentum and filter sideways price action. The system compares absolute slope against minimum threshold requirements, preventing trend signals when price movement relative to the trend line lacks sufficient directional conviction regardless of band position.
🔶 Signal Generation Framework
Generates trend change signals when filtered direction state transitions from bearish to bullish or vice versa, with label placement and alert integration. The system implements state persistence that maintains previous trend until both ADX and slope filters confirm directional change, reducing whipsaw signals while capturing genuine reversals with minimal lag.
🔶 Performance Optimization Framework
Utilizes efficient calculation methods with optimized variable management and configurable parameters for balance between responsiveness and stability. The system includes intelligent state tracking with NA handling for initial bars and smooth gradient calculations that maintain performance across extended historical periods and real-time updates.
This indicator delivers sophisticated trend identification through Mean Absolute Deviation methodology combined with dual-strength filtering for superior signal quality. Unlike traditional Super Trend indicators that rely solely on ATR bands, the SMA-MAD approach uses statistical deviation measurement while incorporating ADX strength and slope validation to eliminate false signals during choppy conditions. The system's gradient-based visual feedback, ATR ribbon visualization, comprehensive dashboard, and multi-dimensional filtering make it essential for traders seeking reliable trend-following approaches with clear conviction measurement across cryptocurrency, forex, and equity markets. The combination of adaptive bands, strength-based transparency, and intelligent filtering creates an institutional-grade trend system suitable for systematic trading strategies.
Moving_average

Quant VWAP System 3.8 This is the lower-indicator companion to the "Quant VWAP System." While the main chart tells you where the price is, this oscillator tells you how statistically significant the move is.
It uses a Z-Score algorithm to normalize price action. This means it ignores dollar amounts and instead measures how many Standard Deviations (SD) the price is away from its mean (VWAP). This allows you to instantly spot "Overbought" or "Oversold" conditions on any asset (Bitcoin, Forex, or Stocks) without needing to guess.
Key Features:
1. Normalized Extremes (The "Kill Zones")
±2.0 SD: These dotted lines represent statistical extremes. When the signal line crosses above +2.0, the asset is mathematically expensive (Overbought). When it crosses below -2.0, it is mathematically cheap (Oversold).
The Logic: Price rarely sustains movement beyond 2 Standard Deviations without a reversion or a pause.
2. The Squeeze Radar (Yellow Dots)
Volatility Detection: A row of Yellow Dots appearing on the center line indicates a "Squeeze."
What it means: The Standard Deviation bands are compressing. Energy is building.
Warning: DO NOT trade Mean Reversion when you see Yellow Dots. A squeeze often leads to a violent breakout. Wait for the dots to disappear to confirm the direction of the explosion.
3. Momentum Coloring
Green Line: Z-Score is rising (Bullish Momentum).
Red Line: Z-Score is falling (Bearish Momentum).
This helps you spot divergences (e.g., Price makes a Higher High, but the Oscillator makes a Lower High = Exhaustion).
How to Trade with It
Strategy A: The "Zero Bounce" (Trend Continuation)
Scenario: You are in a Bull Trend.
Signal: The Oscillator line pulls back to the Zero Line (White), turns Green, and curls upward.
Meaning: Price has tested the average (VWAP) and buyers have stepped in. This is a high-probability entry for trend continuation.
Strategy B: The "Extreme Fade" (Reversion)
Scenario: The Oscillator pushes deep into the Red Zone (+2.0 SD).
Signal: The line turns Red and crosses back down below the +2.0 dotted line. A small Red Triangle will appear.
Meaning: The statistical extension has failed, and price is likely snapping back to the mean.
Strategy C: Squeeze Breakout
Scenario: Yellow Dots appear on the center line.
Action: Stop trading. Wait.
Signal: The dots disappear, and the line shoots aggressively through +1.0 SD (Long) or -1.0 SD (Short). Ride the momentum.

Multi-Fractal Trading Plan [Gemini] v22Multi-Fractal Trading Plan
The Multi-Fractal Trading Plan is a quantitative market structure engine designed to filter noise and generate actionable daily strategies. Unlike standard auto-trendline indicators that clutter charts with irrelevant data, this system utilizes Fractal Geometry to categorize market liquidity into three institutional layers: Minor (Intraday), Medium (Swing), and Major (Institutional).
This tool functions as a Strategic Advisor, not just a drawing tool. It calculates the delta between price and structural pivots in real-time, alerting you when price enters high-probability "Hot Zones" and generating a live trading plan on your dashboard.
Core Features
1. Three-Tier Fractal Engine The algorithm tracks 15 distinct fractal lengths simultaneously, aggregating them into a clean hierarchy:
Minor Structure (Thin Lines): Captures high-frequency volatility for scalping.
Medium Structure (Medium Lines): Identifies significant swing points and intermediate targets.
Major Structure (Thick Lines): Maps the "Institutional" defense lines where trend reversals and major breakouts occur.
2. The Strategic Dashboard A dynamic data panel in the bottom-right eliminates analysis paralysis:
Floor & Ceiling Targets: Displays the precise price levels of the nearest Support and Resistance.
AI Logic Output: The script analyzes market conditions to generate a specific command, such as "WATCH FOR BREAKOUT", "Near Lows (Look Long?)", or "WAIT (No Setup)".
3. "Hot Zone" Detection Never miss a critical test of structure.
Dynamic Alerting: When price trades within 1% (adjustable) of a Major Trend Line, the indicator’s labels turn Bright Yellow and flash a warning (e.g., "⚠️ WATCH: MAJOR RES").
Focus: This visual cue highlights the exact moment execution is required, reducing screen fatigue.
4. The Quant Web & Markers
Pivot Validation: Deep blue fractal markers (▲/▼) identify the exact candles responsible for the structure.
Inter-Timeframe Web: Faint dotted lines connect Minor pivots directly to Major pivots, visualizing the "hidden" elasticity between short-term noise and long-term trend anchors.
5. Enterprise Stability Engine Engineered to solve the "Vertical Line" and "1970 Epoch" glitches common in Pine Script trend indicators. This engine is optimized for Futures (NQ/ES), Forex, and Crypto, ensuring stability across all timeframes (including gaps on ETH/RTH charts).
Operational Guide
Consult the Dashboard: Before executing, check the "Strategy" output. If it says "WAIT", the market is in chop. If it says "WATCH FOR BOUNCE", prepare your entry criteria.
Monitor Hot Zones: A Yellow Label indicates price is testing a major liquidity level. This is your signal to watch for a rejection wick or a high-volume breakout.
Utilize the Web: Use the faint web lines to find "confluence" where a short-term pullback aligns with a long-term trend line.
Configuration
Show History: Toggles "Ghost Lines" (Blue) to display historical structure and broken trends.
Fractal Points: Toggles the geometric pivot markers.
Hot Zone %: Adjusts the sensitivity of the Yellow Warning system (Default: 1%).
Max Line Length: A noise filter that removes stale or "spiderweb" lines that are no longer statistically relevant.

cd_VW_Cx IMPROVED - Quant VWAP System: Regime, Magnets & Z-ScoQuant VWAP System: Regime, Magnets & Z-Score Matrix
This indicator is a comprehensive Quantitative Trading System designed to move beyond simple support and resistance. Instead of static lines, it uses Statistical Probability (Z-Score) and Standard Deviation to define the current market regime, identify institutional value zones, and project high-probability liquidity targets.
It is engineered for Day Traders and Scalpers (Crypto & Futures) who need to know if the market is Trending, Ranging, or preparing for a Breakout.
1. The "Regime" System (Standard Deviation Bands)
The core engine anchors a VWAP (Volume Weighted Average Price) to your chosen timeframe (Daily, Weekly, or Monthly) and projects volatility bands based on market variance.
The Trend Zone (Inner Band / 1.0 SD): This is the "Fair Value" zone. In a healthy trend, price will pull back into this zone and hold. A hold here signals a high-probability continuation (Trend Following).
The Reversion Zone (Outer Band / 2.0 SD): This represents a statistical extreme. Price rarely sustains movement beyond 2 Standard Deviations without a reversion. A touch of this band signals "Overbought" or "Oversold" conditions.
2. Liquidity Magnets (Virgin VWAPs)
The script automatically tracks "Unvisited VWAPs" from previous sessions. These are price levels where significant volume occurred but have not yet been re-tested.
The Logic: Algorithms often target these "open loops." The script visualizes them as Blue Dashed Lines with price tags.
Smart Scaling (Anti-Scrunch): Includes a custom "Ghost Engine" that automatically hides or "ghosts" magnets that are too far away. This prevents your chart from being squashed (scrunched) on lower timeframes, keeping your candles perfectly readable while still tracking targets in the background.
3. The Quant Matrix (Dashboard)
A real-time Heads-Up Display (HUD) that interprets the data for you:
Regime: Detects Volatility Squeezes. If the bands compress, it signals "⚠ SQUEEZE", warning you to stop mean-reversion trading and prepare for an explosive breakout.
Bias: Color-coded Trend Direction (Bullish/Bearish) based on VWAP slope.
Signal: actionable text prompts such as "BUY DIP" (Trend Following), "FADE EXT" (Mean Reversion), or "PREP BREAK" (Squeeze).
4. Visual Intelligence
Bold Day Separators: Clear, vertical dotted dividers with Date Stamps to instantly separate trading sessions.
Dynamic Labels: Floating labels on the right axis identify exactly which deviation level is which, preventing chart confusion.
How to Use
Strategy A: The Trend Pullback (continuation)
Check Matrix: Ensure Bias is BULLISH (Green).
Wait: Allow price to pull back into the Inner Band (Dark Green Zone).
Trigger: If price holds the Center VWAP or the -1.0 SD line, enter Long.
Target: The next Liquidity Magnet above or the +2.0 SD band.
Strategy B: The Reversion Fade (Counter-Trend)
Check Matrix: Ensure price is labeled "EXTREME" or Signal says "FADE EXT".
Trigger: Price touches or pierces the Outer Band (2.0 SD).
Action: Enter counter-trend (Short) with a target back to the Center VWAP (Mean Reversion).
Strategy C: The Magnet Target
Identify a "MAGNET" line (Blue Dashed) near current price.
These act as high-probability Take Profit levels. Price will often rush to these levels to "close the loop" before reversing.
Settings
Anchor: Daily (default), Weekly, or Monthly.
Magnet Focus Range: Adjusts how aggressively the script hides distant magnets to fix chart scaling (Default: 2%).
Visuals: Fully customizable colors, label sizes, and dashboard position.

CryptoFlux Dynamo [JOAT]CryptoFlux Dynamo: Velocity Scalping Strategy
This Pine Script v6 strategy is designed for cryptocurrency markets operating on 5-minute and faster timeframes. It combines volatility regime detection, multi-path signal confirmation, and adaptive risk management to identify momentum-based trading opportunities in perpetual futures markets.
Core Design Principles
The strategy addresses three challenges specific to cryptocurrency trading:
24/7 market operation without session boundaries requires continuous monitoring and execution logic
Volatility regimes shift rapidly, demanding adaptive stop and target calculations
Tick-level responsiveness is critical for capturing momentum moves before they complete
Strategy Architecture
1. Signal Generation Stack
The strategy uses multiple technical indicators calibrated for cryptocurrency momentum:
MACD with parameters 8/21/5 (fast/slow/signal) optimized for crypto acceleration phases
EMA ribbon using 8/21/34 periods with slope analysis to assess trend structure
Volume impulse detection combining SMA baseline, standard deviation, and z-score filtering
RSI (21 period) and MFI (21 period) for momentum confirmation
Bollinger Bands and Keltner Channels for squeeze detection
2. Volatility Regime Classification
The strategy normalizes ATR as a percentage of price and classifies market conditions into three regimes:
Compression (< 0.8% ATR): Reduced position sizing, tighter stops (1.05x ATR), lower profit targets (1.6x ATR)
Expansion (0.8% - 1.6% ATR): Standard risk parameters, balanced risk-reward (1.55x stop, 2.05x target)
Velocity (> 1.6% ATR): Wider stops (2.1x ATR), amplified targets (2.8x ATR), tighter trailing offsets
ATR is calculated over 21 periods and smoothed with a 13-period EMA to reduce noise from wicks.
3. Multi-Path Entry System
Four independent signal pathways contribute to a composite strength score (0-100):
Trend Break (30 points): Requires EMA ribbon alignment, positive slope, and structure breakout above/below recent highs/lows
Momentum Surge (30 points): MACD histogram exceeds adaptive baseline, MACD line crosses signal, RSI/MFI above/below thresholds, with volume impulse confirmation
Squeeze Release (25 points): Bollinger Bands compress inside Keltner Channels, then release with momentum bias
Micro Pullback (15 points): Shallow retracements within trend structure that reset without breaking support/resistance
Additional scoring modifiers:
Volume impulse: +5 points when present, -5 when absent
Regime bonus: +5 in velocity, -2 in compression
Cycle bias: +5 when aligned, -5 when counter-trend
Trades only execute when the composite score reaches the minimum threshold (default: 55) and all filters agree.
4. Risk Management Framework
Position sizing is calculated from:
RiskCapital = Equity × (riskPerTradePct / 100)
StopDistance = ATR × StopMultiplier(regime)
Quantity = min(RiskCapital / StopDistance, MaxExposure / Price)
The strategy includes:
Risk per trade: 0.65% of equity (configurable)
Maximum exposure: 12% of equity (configurable)
Regime-adaptive stop and target multipliers
Adaptive trailing stops based on ATR and regime
Kill switch that disables new entries after 6.5% drawdown
Momentum fail-safe exits when MACD polarity flips or ribbon structure breaks
5. Additional Filters
Cycle Oscillator : Measures price deviation from 55-period EMA. Requires cycle bias alignment (default: ±0.15%) before entry
BTC Dominance Filter : Optional filter using CRYPTOCAP:BTC.D to reduce long entries during risk-off periods (rising dominance) and short entries during risk-on periods
Session Filter : Optional time-based restriction (disabled by default for 24/7 operation)
Strategy Parameters
All default values used in backtesting:
Core Controls
Enable Short Structure: true
Restrict to Session Window: false
Execution Session: 0000-2359:1234567 (24/7)
Allow Same-Bar Re-Entry: true
Optimization Constants
MACD Fast Length: 8
MACD Slow Length: 21
MACD Signal Length: 5
EMA Fast: 8
EMA Mid: 21
EMA Slow: 34
EMA Slope Lookback: 8
Structure Break Window: 9
Regime Intelligence
ATR Length: 21
Volatility Soothing: 13
Low Vol Regime Threshold: 0.8% ATR
High Vol Regime Threshold: 1.6% ATR
Cycle Bias Length: 55
Cycle Bias Threshold: 0.15%
BTC Dominance Feed: CRYPTOCAP:BTC.D
BTC Dominance Confirmation: true
Signal Pathways
Volume Baseline Length: 34
Volume Impulse Multiplier: 1.15
Volume Z-Score Threshold: 0.5
MACD Histogram Smoothing: 5
MACD Histogram Sensitivity: 1.15
RSI Length: 21
RSI Momentum Trigger: 55
MFI Length: 21
MFI Momentum Trigger: 55
Squeeze Length: 20
Bollinger Multiplier: 1.5
Keltner Multiplier: 1.8
Squeeze Release Momentum Gate: 1.0
Micro Pullback Depth: 7
Minimum Composite Signal Strength: 55
Risk Architecture
Risk Allocation per Trade: 0.65%
Max Exposure: 12% of Equity
Base Risk/Reward Anchor: 1.8
Stop Multiplier • Low Regime: 1.05
Stop Multiplier • Medium Regime: 1.55
Stop Multiplier • High Regime: 2.1
Take Profit Multiplier • Low Regime: 1.6
Take Profit Multiplier • Medium Regime: 2.05
Take Profit Multiplier • High Regime: 2.8
Adaptive Trailing Engine: true
Trailing Offset Multiplier: 0.9
Quantity Granularity: 0.001
Kill Switch Drawdown: 6.5%
Strategy Settings
Initial Capital: $100,000
Commission: 0.04% (0.04 commission_value)
Slippage: 1 tick
Pyramiding: 1 (no position stacking)
calc_on_every_tick: true
calc_on_order_fills: true
Visualization Features
The strategy includes:
EMA ribbon overlay (8/21/34) with customizable colors
Regime-tinted background (compression: indigo, expansion: purple, velocity: magenta)
Dynamic bar coloring based on signal strength divergence
Signal labels for entry points
On-chart dashboard displaying regime, ATR%, signal strength, position status, stops, targets, and risk metrics
Recommended Usage
Timeframes
The strategy is optimized for 5-minute charts. It can operate on 3-minute and 1-minute timeframes for faster scalping, or 15-minute for swing confirmation. When using higher timeframes, consider:
Increasing structure lookback windows
Raising RSI trigger thresholds above 58 to filter noise
Extending volume baseline length
Markets
Designed for high-liquidity cryptocurrency perpetual futures:
BTC/USDT, BTC/USD perpetuals
ETH perpetuals
Major L1 tokens with sufficient volume
For thinner order books, increase volume impulse multiplier and adjust quantity granularity to match exchange minimums.
Limitations and Compromises
Backtesting Considerations
TradingView strategy backtesting does not replicate broker execution. Actual fills, slippage, and commissions may differ
The strategy uses calc_on_every_tick=true and calc_on_order_fills=true to reduce bar-close distortions, but real execution still depends on broker infrastructure
At least 200 historical bars are required to stabilize regime classification, volume baselines, and cycle context
Market Structure Dependencies
BTC dominance feed ( CRYPTOCAP:BTC.D ) may lag during low-liquidity periods or weekends. Consider disabling the filter if data quality degrades
Volume impulse detection assumes consistent order book depth. During extreme volatility or exchange issues, volume signatures may be unreliable
Regime classification based on ATR percentage assumes normal volatility distributions. During black swan events, regime thresholds may not adapt quickly enough
Parameter Sensitivity
Default parameters are tuned for BTC/ETH perpetuals on 5-minute charts. Different assets or timeframes require recalibration
The composite signal strength threshold (55) balances selectivity vs. opportunity. Higher values reduce false signals but may miss valid setups
Risk per trade (0.65%) and max exposure (12%) are conservative defaults. Aggressive scaling increases drawdown risk
Execution Constraints
Same-bar re-entry requires broker support for rapid order placement
Quantity granularity must match exchange contract minimums
Kill switch drawdown (6.5%) may trigger during normal volatility cycles, requiring manual reset
Performance Expectations
This strategy is a framework for momentum-based cryptocurrency trading. Performance depends on:
Market conditions (trending vs. ranging)
Exchange execution quality
Parameter calibration for specific assets
Risk management discipline
Backtest results shown in publications reflect specific market conditions and parameter sets. Past performance does not indicate future results. Always forward test with paper trading or broker simulation before deploying live capital.
Code Structure
The strategy is organized into functional sections:
Configuration groups for parameter organization
Helper functions for position sizing and normalization
Core indicator calculations (MACD, EMA, ATR, RSI, MFI, volume analytics)
Regime classification logic
Multi-path signal generation and composite scoring
Entry/exit orchestration with risk management
Visualization layer with dashboard and chart elements
The source code is open and can be modified to suit your trading requirements. Everyone is encouraged to understand the logic before deploying and to test thoroughly in their target markets.
Modification Guidelines
When adapting this strategy:
Document any parameter changes in your publication
Test modifications across different market regimes
Validate position sizing logic for your exchange's contract specifications
Consider exchange-specific limitations (funding rates, liquidation mechanics, order types)
Conclusion
This strategy provides a structured approach to cryptocurrency momentum trading with regime awareness and adaptive risk controls. It is not a guaranteed profit system, but rather a framework that requires understanding, testing, and ongoing calibration to market conditions.
You should thoroughly understand the logic, test extensively in their target markets, and manage risk appropriately. The strategy's effectiveness depends on proper parameter tuning, reliable execution infrastructure, and disciplined risk management.
Disclaimer
This script and its documentation are for educational and informational purposes only. They do not constitute financial advice, investment recommendations, or trading advice of any kind. Trading cryptocurrencies and derivatives involves substantial risk of loss and is not suitable for all investors. Past performance, whether real or indicated by backtesting, does not guarantee future results.
This strategy is provided "as is" without any warranties or guarantees of profitability
You should not rely solely on this strategy for making trading decisions
Always conduct your own research and analysis before making any financial decisions
Consider consulting with a qualified financial advisor before engaging in trading activities
The authors and contributors are not responsible for any losses incurred from using this strategy
Cryptocurrency trading can result in the loss of your entire investment
Only trade with capital you can afford to lose
Use this strategy at your own risk. The responsibility for any trading decisions and their consequences lies entirely with you.

Peace of Mind Trader: MA Trend SystemPeace of Mind Trader: MA Trend System (Free Edition)
Developed by: Peace of Mind Trader
Trade with Logic, Profit with Peace.
Contact : wizardkidtrader@gmail.com
facebook : Peace of Mind Trader
----
🇬🇧 English
Simple & Elegant Trend Following System
Stop guessing the market direction. This system is designed to guide you with clarity and peace of mind.
- Trend Ribbon: Auto-coloring EMA ribbon (🟢 Green = Uptrend / 🔴 Red = Downtrend).
- Smart Dashboard: Real-time market status (BULLISH / BEARISH) on your screen.
- Clear Signals: Non-overlapping labels for entry/exit points.
- Clean Chart: Option to hide historical signals and show only the latest one.
How to use: Buy when the ribbon is Green + "BULL" label. Sell when the ribbon is Red + "BEAR" label.
-----
🇹🇭 Thai
ระบบจับเทรนด์ ดูง่าย สบายตา
เลิกเดาทิศทางตลาดด้วยตัวเอง! ให้ระบบช่วยจับจังหวะเทรนด์ใหญ่ให้คุณ ด้วยดีไซน์ที่ทันสมัยและใช้งานง่ายที่สุด
- Trend Ribbon: ริบบิ้นเปลี่ยนสีอัตโนมัติ (🟢 เขียว = ขาขึ้น / 🔴 แดง = ขาลง)
- Smart Dashboard: แผงควบคุมบอกสถานะตลาด (BULLISH / BEARISH) ทันที
- Clear Signals: มีป้ายบอกจุดเปลี่ยนเทรนด์ชัดเจน ไม่ทับแท่งเทียน
- Clean Chart: เลือกปิดสัญญาณเก่าๆ ได้ โชว์แค่สถานะล่าสุด กราฟไม่รก
วิธีใช้: หาจังหวะ Buy เมื่อริบบิ้นสีเขียว และหาจังหวะ Sell เมื่อริบบิ้นสีแดง
----
Developed by: Peace of Mind Trader
Trade with Logic, Profit with Peace.
Contact : wizardkidtrader@gmail.com

ARDO (v2.4.7) Moving Averages v1.1ARDO Moving Averages v1.1 (Overlay)
Companion overlay that recreates ARDO driver states (Spreads A/B, LinReg state + slope/gradient, tiers/MK tiers, gate pass/block) and maps those states onto up to 5 moving average overlays + one optional MA-to-MA fill.
ARDO v2.4.6 (original indicator)
What this overlay does
Computes ARDO “driver states” internally (no external source required): Spread A, Spread B, LinReg (4-state), LinReg slope/accel → gradient opacity, quartile/tier regimes, MK tiers, and Gate pass/block.
Paints MA overlays using selectable “Color Modes” (Spread A, Spread B, ARDO LinReg, MK Tier, Quartile Background, Gate Pass, Bull/Bear A vs B, or Fixed).
Optional Fill between two overlay MAs using a selected color mode (intended for regime/bull-bear shading between MA lines).
Core concepts (quick read)
Baseline / MA A / MA B define Spread A and Spread B (% distance vs baseline).
LinReg is a regression of a selected source (Spread A, Spread B, or Spread(A+B)).
LinReg State (4 colors) is derived from slope sign and acceleration (trend speeding up vs slowing down): Green / Orange / Red / Gray.
Gradient Opacity scales line opacity based on slope magnitude (strong vs weak).
Tier / Quartile maps current regime into bins (Q0–H4) using rolling percentiles (or manual thresholds).
MK Tier is an alternate tier engine (Standard / Asymmetric / Mirror BG).
Gate is a boolean pass/block that can combine spread and trend requirements (optional).
How to set it up (recommended workflow)
Pick ARDO Core MAs (Baseline, MA A, MA B) and your main LinReg Source.
Tune LinReg Length + Gradient Scale to match your timeframe (shorter = faster flips, longer = smoother).
Decide Tier mode (Standard vs Asymmetric) and whether tiers use All Bars or Pivots Only .
Set up Gate (or leave off): use it as a “permission layer” for entries.
Configure your overlay MAs (1–5) and assign each a Color Mode aligned to its job:
MA1 = fast impulse (often Spread A)
MA2 = trend state (often ARDO LinReg)
MA3 = slower confirmation (often Spread B)
MA4 = gate/permission readout (Gate Pass)
MA5 = regime (MK Tier)
Enable Fill only if you want regime shading between two MAs (keep it simple: one fill only).
Inputs explained (by group)
1) Sources & Moving Averages (ARDO Core)
Price Source : price used for MA calculations (default close).
Baseline MA Type/Length : reference MA for spreads.
MA A Type/Length : “A” spread driver (usually faster).
MA B Type/Length : “B” spread driver (often slower fast MA).
EMA Fast / EMA Slow : used only if the EMA gate toggle is enabled.
2) Linear Regression & Gradient
LinReg Length : lookback used by regression.
LinReg Source : Spread A, Spread B, or Spread(A+B).
Slope Lookback : bars used to compute slope as (linreg - linreg ) / n.
Adaptive Opacity Scale : derives slope “cap” from a rolling percentile (reduces volatility-regime distortion).
Fixed Scale Cap : used if adaptive scaling is off.
Min/Max Opacity : clamps gradient range.
3) Tiers & Population
Tier Mode : Standard vs Asymmetric (changes percentile boundary logic).
Tier Population : All Bars vs Pivots Only.
Manual Thresholds : if enabled, uses user cutoffs instead of computed percentiles.
Auto-Percentile Window : rolling window size for percentiles.
4) Region Rendering (BG / regime palette)
BG colors for Q0/Q1/Q2/Q3/Q4/H4 : the palette used for “Quartile Background” color mode and MK “Mirror BG”.
Pivot Sensitivity : relevant only for Pivots Only population.
5) Gate (Pass/Block)
Gate: SpreadA > LinReg (toggle)
Gate: EMA Fast > EMA Slow (toggle)
Min Spread A (%)
Min |LinReg Slope|
Gate PASS/BLOCK colors : also used by Gate Pass color mode.
6) Overlay Moving Averages (MA1–MA5)
MA Len / Type : SMA, EMA, WMA, Wilder, Triangular, HMA, Adaptive.
Color Mode :
Fixed
ARDO Spread A
ARDO Spread B
ARDO LinReg (4-state + gradient opacity)
MK Tier
Quartile Background (Q0–H4 palette)
Gate Pass
Bull/Bear (A vs B)
Base Color : used for Fixed (and as fallback).
Line Width
Style (if present): line / stepline / markers depending on the MA slot.
Bull/Bear (A vs B) definition
Bull when MA A > MA B
Bear when MA A < MA B
Alerts (built-in alertconditions in v1.1)
Spread A State
State changed (any change)
Turned Green / Orange / Red / Gray
LinReg State
State changed (any change)
Turned Green / Orange / Red / Gray
LinReg Gradient
Gradient High (slope strength high)
Gradient Low (slope strength low)
Gate
Gate Pass ON
Gate Pass OFF
Bull/Bear Flip
Bullish flip (A crosses above B)
Bearish flip (A crosses below B)
Tier / Quartile
Entered Q0
Entered Q1
Entered H3
Entered H4
Simple Alignment
LinReg Green AND SpreadA Green (basic “momentum aligned” condition)
How to use Gate (and how to loosen/tighten it)
Use Gate as a filter , not as the entire strategy: it’s best as “permission to trade” plus your own trigger.
If Gate is too strict :
Disable EMA Fast > EMA Slow gate (trend filter) OR disable SpreadA > LinReg gate (structure filter).
Lower Min Spread A threshold.
Lower Min |LinReg Slope| threshold.
Increase LinReg Length slightly to reduce noisy flips (sometimes helps pass stability).
If Gate is too loose :
Enable both gate components (SpreadA>LinReg AND EMA Fast>Slow).
Raise Min Spread A and/or Min |LinReg Slope|.
Shorten LinReg Length to react faster (but can increase chop).
Practical “read” using the default overlay roles
MA1 (fast, Spread A mode) : impulse / early acceleration cues.
MA2 (trend, LinReg mode) : regime + momentum state; opacity tells you strength.
MA3 (confirmation, Spread B) : slower confirmation; helps avoid “one-candle impulse traps”.
MA4 (Gate Pass) : permission layer; reduces counter-trend entries.
MA5 (MK Tier) : regime band; helps distinguish “deep OS/OB context” vs mid-zone noise.
Notes
This is an overlay; it’s designed to complement the original ARDO oscillator pane.

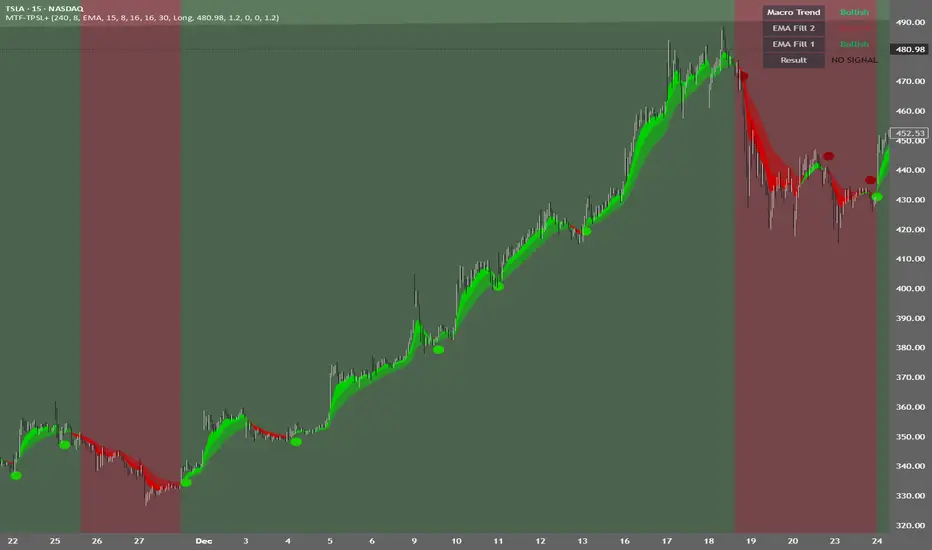
MTF TPSL Scalper System TP/SL Integration [TheScalpingAnt]MTF TPSL Scalper System TP/SL Integration
Credit: Aballard11 (Original Moving Average Shaded Fill Area Crossover Concept & Foundation) Developed / Implemented by: The Scalping Ant
OVERVIEW
MTF-TPSL Enhanced is a professional multi-timeframe TradingView indicator engineered to align macro market bias with micro execution timing, while simultaneously delivering visual trade management via integrated Take-Profit and Stop-Loss projections.
It is a complete execution framework:
• Macro context before entry
• Clean directional bias
• Precision entry timing
• Disciplined risk visualization
Built using an advanced dual-EMA fill model, MTF-TPSL filters noise, aligns directional momentum, and helps traders execute only high-probability opportunities. Whether you are scalping, day trading, or swing trading, this tool delivers the clarity and confidence required for professional-grade decision making.
Works on Forex, Crypto, Indices, Stocks, and Futures on any liquid market.
CORE CONCEPTS
MTF-TPSL is structured around three professional trading pillars:
1) Macro Bias (Higher-Timeframe Context)
A customizable higher-timeframe moving average defines directional bias:
• Bullish macro → long focus
• Bearish macro → short focus
This reduces counter-trend trades and improves directional consistency.
2) Micro Structure (Execution Layer)
On your trading timeframe, the system uses two EMA fill zones:
• EMA Fill 2 → Trend confirmation layer
• EMA Fill 1 → Precision entry timing layer
Signals are generated only when momentum, structure, and macro bias align, significantly improving execution quality.
3) Integrated TP/SL Visualization
Built-in trade projection tools allow you to:
• Input a manual entry price
• Visualize structured Stop-Loss placement
• Project one or multiple Take-Profit levels
This encourages planned trades, not emotional trades.
KEY FEATURES
Multi-Timeframe Intelligence
• Independent Macro and Micro engines
• Adjustable Macro MA length & type (SMA / EMA / WMA / VWMA)
• Dynamic higher-timeframe background bias visualization
Advanced Entry Logic
• Standard EMA alignment + crossover confirmation
• Optional Early Reversal Detection (captures momentum shifts before lagging crossovers)
• Optional Wait-For-Candle-Close confirmation filter
Trade earlier when aggressive. Trade later when conservative. You decide.
Signal Matrix (Optional Professional HUD)
• Real-time validation of Macro + Micro conditions
• Explains why a signal prints or does not
• Excellent for learning, strategy discipline, and confidence building
Signal Matrix – How to Read It
The Signal Matrix does not simply tell you if the market is bullish or bearish. It separates market context from execution timing, which prevents traders from entering too late or during weak signals.
The matrix has two roles:
1️⃣ Market Context (Trend Alignment)
• Macro Trend = Higher-timeframe bias
• EMA Fill 2 = Micro trend confirmation
• EMA Fill 1 = Short-term execution layer
If these are Bullish, the market has bullish structure.
If these are Bearish, the market has bearish structure.
This tells you the environment, not the entry.
2️⃣ Result (Signal Decision)
“Result” only shows LONG or SHORT when a valid trade setup is actually triggered.
A signal requires:
• Macro Trend aligned
• EMA Fill 2 aligned
• EMA Fill 1 alignment
• PLUS a trigger event
o EMA crossover or
o EMA color-shift reversal (if enabled)
o and optionally, candle close confirmation if selected
So you may sometimes see:
• Macro Trend → Bullish
• EMA Fill 2 → Bullish
• EMA Fill 1 → Bullish
• Result → NO SIGNAL
This is correct and intentional.
It means:
The market is bullish, but there is no fresh trade entry yet.
The indicator avoids late entries and only signals when a new high-probability setup forms.
If “Wait for Candle Close” is enabled, signals will only confirm after the bar closes to reduce noise and false entries.
Interpretation Summary
• Bullish + NO SIGNAL = Market is bullish, wait for entry trigger
• Bearish + NO SIGNAL = Market bearish, wait for entry trigger
• LONG = Valid bullish entry setup detected
• SHORT = Valid bearish entry setup detected
This keeps trading disciplined, structured, and prevents emotional entries.
Visual Trade Management
• Dynamic TP/SL Projection System
• Automatically plots:
– Entry reference
– Stop Loss
– TP / TP1 / TP2 levels
• Professional clean color coding
• Works for both Long and Short execution
You do not just enter trades—you execute structured plans.
CUSTOMIZATION
MTF-TPSL adapts to any trading style.
Macro Settings
• Select timeframe (example: 4H or Daily)
• Choose MA type
• Adjust sensitivity
Micro Execution Settings
• Two EMA Fill systems
• Adjustable fast/slow lengths
• Precision momentum logic
Signal Behavior
• Enable Early Reversal Detection
• Enable Candle Close Confirmation
• Toggle entry labels
• Toggle background bias
Risk Settings
• Manual entry input
• Direction selection (Long / Short)
• TP %, TP1 %, TP2 %
• Stop Loss %
• Fully visualized execution roadmap
Everything is transparent. Everything is trader-controlled.
USAGE – HOW TO TRADE WITH IT
1️⃣ Identify Macro Bias
Background color instantly shows market context.
2️⃣ Wait for Micro Alignment
EMA Fill 2 confirms trend
EMA Fill 1 provides execution timing
3️⃣ Enter on Confirmed Signal
LONG or SHORT label appears only when rules align.
4️⃣ Manage Risk Professionally
Activate TP/SL projection
Plan targets
Control risk
This workflow promotes discipline, patience, and consistency.
EXAMPLE SCENARIO
Bullish Setup Example
• Macro timeframe closes above macro MA → bullish bias
• EMA Fill 2 turns bullish → structure confirmed
• EMA Fill 1 shifts bullish → execution timing
• LONG signal appears
• Entry, Stop Loss, TP, TP1, TP2 are automatically visualized
Result:
A clean, structured trade aligned with higher-timeframe direction and supported by visual risk structure.
SETTINGS SUMMARY
Macro Controls
• Timeframe
• MA length & type
Micro Controls
• EMA Fill configurations
• Sensitivity tuning
Signal Filters
• Early Reversal toggle
• Candle Close confirmation
Visual Tools
• Background bias
• Entry labels
• Signal Matrix
Risk Engine
• Entry price
• Direction
• TP / TP1 / TP2
• SL
CONCLUSION
MTF-TPSL Enhanced delivers:
• Higher-timeframe clarity
• Precise execution logic
• Professional trade management
• Customizable flexibility
• Clean presentation and usability
In a world full of distractions, MTF-TPSL provides a structured, disciplined, and professional trading framework. It merges Trend + Momentum + Risk Management into one seamless execution system.
If you want to trade with confidence, structure, and real strategic clarity, this indicator is built for you.
DISCLAIMER
This is an analytical tool, not financial advice.
Trading involves risk and no indicator guarantees results.
Always backtest, practice risk management, and never risk more than you can afford to lose.
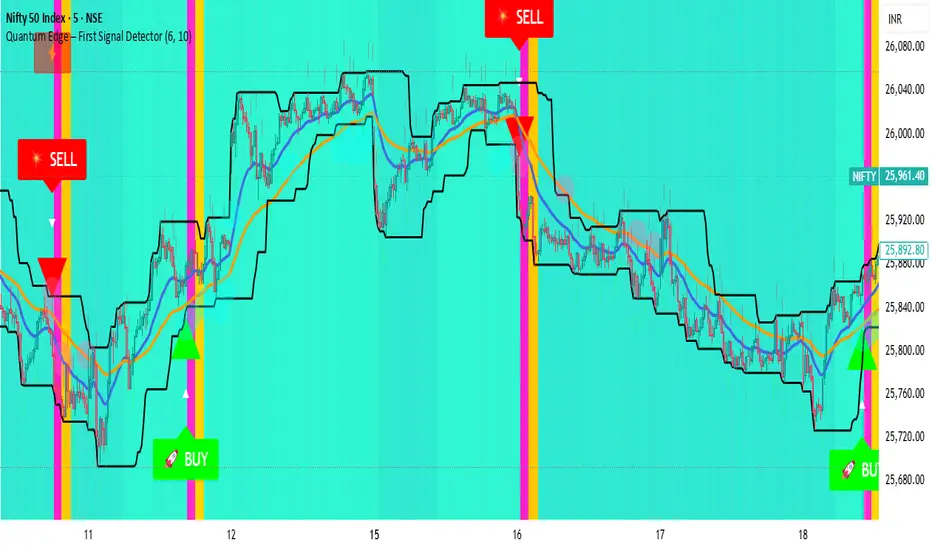
Quantum Edge First Signal DetectorQuantum Edge is a non-repainting, multi-confirmation indicator that detects the first high-probability BUY & SELL signals using momentum, trend, volume, volatility, and price-action voting logic.
🧠 About This Indicator
Quantum Edge – First Signal Detector is designed to solve one common trader problem:
too many late or repeated signals.
Instead of firing continuous entries, this indicator focuses only on the FIRST valid signal after a market shift — helping traders enter early, reduce noise, and avoid over-trading.
It uses a quantum-style voting engine where multiple independent market factors must align before a signal is confirmed.
⚙️ Core Logic (How It Works)
Each candle is evaluated using 6 independent factors:
RSI Momentum
Bullish when RSI > 50
Bearish when RSI < 40
Price Location
Price near recent highs or lows
Volume Expansion
Current volume above moving average
EMA Trend Direction
EMA 20 vs EMA 50
Candle Strength
Strong bullish or bearish candle bodies
Volatility Filter
ATR-based low volatility confirmation
Each factor gives 1 vote.
When minimum confirmations are met, a FIRST BUY or FIRST SELL signal is generated.
🚀 Key Features
✅ First-Signal-Only Logic
Only the first BUY or SELL after trend change
No repeated signals in the same direction
Built-in signal cooldown (user-controlled)
✅ Non-Repainting
Signals are confirmed on candle close
No future data, no repainting
✅ Smart Trend Filtering
EMA-based directional bias
Avoids weak counter-trend entries
✅ Advanced Visual System
Clear BUY / SELL triangles
Trend, volume & momentum backgrounds
Support & resistance zones
Market sentiment bar coloring
✅ Alert Support
Buy alert
Sell alert
📊 Best Timeframes
Scalping: 1m – 5m
Intraday: 5m – 15m
Swing Confirmation: 30m – 1H
Works on:
Forex
Crypto
Indices
Stocks
🎯 How to Trade (Simple Guide)
BUY Setup
✔ First BUY signal appears
✔ Trend is bullish
✔ Use nearby support as reference
SELL Setup
✔ First SELL signal appears
✔ Trend is bearish
✔ Use nearby resistance as reference
Always combine with risk management.
Disclaimer: This indicator is for educational purposes only and does not constitute financial advice. Trading involves risk. Use proper risk management.
EAB: Distance (%) to EMAs/MAsRPL: Distance (%) to EMAs/MAs displays a compact table showing the percentage distance between the current price and selected moving averages, helping to quickly assess price extension relative to key technical references.
Features
• Distance to EMA 10, EMA 20, MA 50 and MA 200 (individually toggleable).
• Up to two custom moving averages , with selectable EMA or MA type and configurable period.
• Customizable colors, opacity, text size and vertical offset to fit the table cleanly on the chart.
How to use
1. Enable or disable moving averages from the “Show” section.
2. To add another average, enable “Custom Moving Average 1/2” and define its type and period.
3. Adjust the visual style from the “Table” section (colors, opacity, size and position).
Notes
• Distance is calculated as: (Close − Moving Average) / Moving Average × 100 .
• Informational indicator only; no entry or exit signals are provided .

Horizontal Dynamic Moving Averages [TheScalpingAnt]Overview
This indicator is a complete professional moving average framework designed for traders who want structured market insight, flexibility, and powerful visual clarity.
Instead of being limited to static moving averages, this tool gives you up to 10 independently configurable moving averages, full style control, forward-projected price lines, automatic labeling, and the freedom to build your own trend system exactly the way you trade.
This is not just a moving average indicator.
It is a market structure workstation.
Concepts
This tool is built around three core trading concepts:
Market Structure Visualization
Different moving averages represent short-term momentum, medium-term trend, and long-term bias. Seeing how they align instantly shows whether the market is trending, compressing, or reversing.
Precision and Control
Every MA can use any of the following calculation methods:
SMA — EMA — RMA — WMA — HMA — VWMA
This allows the trader to tailor the indicator to their trading system instead of being forced into one logic.
Clarity & Forward Guidance
Each moving average can be extended into the future with horizontal projections, allowing the trader to visualize reaction zones, support/resistance expectations, and confluence ahead of price.
Features
• Up to 10 fully independent moving averages
• Multiple calculation types (SMA / EMA / RMA / WMA / HMA / VWMA)
• Individual enable/disable control
• Adjustable length per MA
• Custom color per MA
• Individual line thickness and style
• Forward extension into future bars
• Optional on-price-scale value display
• Automatic price labels with length identification
• Extremely clean chart visualization
• Works on any market and timeframe
• Non-repainting
Every moving average becomes a strategic tool, not just a line.
Customization
This indicator is engineered to adapt to every trading style:
You Control:
• Which MAs are active
• Their length
• Their calculation method
• Their color
• Their thickness
• Their line style
• Whether values display on scale
• Forward extension distance
This makes the tool equally valuable for:
Scalpers – Day Traders – Swing Traders – Long-Term Investors.
Usage
Typical use cases include:
• Identifying trend direction
• Spotting pullbacks inside trends
• Recognizing trend shifts early
• Mapping dynamic support and resistance
• Aligning entries with trend bias
• Confirming breakout validity
• Detecting consolidation phases
Shorter MAs provide reaction signals
Mid-range MAs provide structural control
Higher MAs define long-term bias
Projected future lines allow traders to visually anticipate market reactions instead of reacting late.
Example Workflow
Example practical trading workflow:
1. Short-term MAs (e.g., 8 / 16 / 30) track entry conditions and momentum.
2. Mid-term MAs (50 / 100) define structural bias.
3. Long-term MAs (150 / 200 / 800 / 1500 / 3000) define macro trend.
4. If short-term averages remain above structural ones → trend continuation confidence.
5. If they compress and cross downward → structural weakness.
6. Extended forward bands mark dynamic areas where the market may react next.
Simple. Clear. Actionable.
Settings
Default design structure includes:
• Enable/Disable per MA
• Length defaults: 8 → 3000
• Full color customization
• Individual width selection
• Solid / Dashed / Dotted styles
• Price scale value toggle
• Forward extension bar length selector
Everything is designed to make the indicator powerful without cluttering the chart.
Conclusion
This indicator delivers:
✓ Professional-grade market structure visualization
✓ Absolute flexibility
✓ Clear and readable market information
✓ Better decision-making support
✓ Reduced uncertainty and guesswork
Whether you trade crypto, forex, indices, or stocks — this is a powerful tool to elevate your technical analysis.
Disclaimer
This indicator does not guarantee profits and is not financial advice. Trading involves risk. Users are fully responsible for their trading decisions.

MA Candle Color [TheScalpingAnt]MA Candle Color
OVERVIEW
MA Candle Color is a visual indicator that transforms your trading experience by providing instant, real-time feedback on price position relative to your chosen Moving Average.
What makes it unique?
• Real-time visual clarity: The current forming candle changes color dynamically based on its position relative to the MA
• Zero lag: Instant visual feedback as price moves
• Clean charts: Only the active candle is colored - no chart clutter
• Professional design: Sleek, minimalist approach that enhances decision-making
Perfect for:
• Day traders seeking instant trend confirmation
• Scalpers who need split-second decision support
• Swing traders monitoring trend alignment
• Any trader who values visual clarity and speed
CONCEPTS
The Power of Visual Trading
Traditional indicators require constant interpretation. MA Candle Color eliminates this cognitive load by providing instant visual feedback through intelligent candle coloring.
Core Principle
The indicator operates on a simple but powerful concept:
• Green Candle = Price is above the Moving Average (bullish territory)
• Red Candle = Price is below the Moving Average (bearish territory)
Why Only the Current Candle?
-Unlike other indicators that color all candles, MA Candle Color focuses exclusively on the NOW:
-Eliminates visual noise
-Keeps your focus on current market conditions
-Prevents analysis paralysis
-Maintains clean chart aesthetics
-The Moving Average Foundation
-Moving Averages are one of the most trusted tools in technical analysis. This indicator leverages reliability while adding a modern, intuitive visual layer.
FEATURES
Real-Time Dynamic Coloring
• Current candle changes color instantly as it forms
• Green when price crosses above MA
• Red when price crosses below MA
• Automatic color reset when candle closes
Precision Engineering
• Zero repainting - what you see is what you get
• Lightweight code - no performance impact
• Compatible with all timeframes and instruments
Full Color Customization
-Choose your own bullish color (default: vibrant green)
-Choose your own bearish color (default: professional red)
-Match your chart theme perfectly
-High visibility options for all screen types
-Clean Visual Design
-MA plotted as subtle gray line
-Works seamlessly with other indicators
CUSTOMIZATION
Complete Control Over Your Trading Experience
MA Length (Default: 8)
Adjust from 1 to any value
Shorter periods (5-20): Responsive, ideal for scalping/day trading
Medium periods (20-50): Balanced for swing trading
Longer periods (50-200): Trend following and position trading
MA Type (Default: EMA)
• SMA: Best for identifying major support/resistance levels, classic, smooth trend identification
• EMA: Ideal for fast-moving markets and quick trend changes, responsive to recent price action
• WMA: Great for balanced trend analysis, balanced approach with recent price emphasis
• VWMA: Perfect when volume analysis is crucial, incorporates volume for institutional insight
• HMA: Excellent for reducing noise in volatile markets, incorporates volume for institutional insight
Recommended Configurations
For Day Trading:
• MA Length: 8-13
• MA Type: EMA or HMA
• High contrast colors
For Swing Trading:
• MA Length: 21-50
• MA Type: EMA or SMA
• Professional, subtle colors
For Scalping:
• MA Length: 5-8
• MA Type: EMA or HMA
• Bright, high-visibility colors
USAGE
Getting Started (3 Simple Steps)
Step 1: Add to Chart
• Search "MA Candle Color" in TradingView indicators
• Click to add to your chart
• Indicator loads with optimized default settings
Step 2: Customize (Optional)
• Click the settings gear icon
• Adjust MA length to match your trading timeframe
• Select your preferred MA type
• Choose your custom colors
Step 3: Trade with Confidence
• Watch the current candle color in real-time
• Green = Bullish momentum (price above MA)
• Red = Bearish momentum (price below MA)
• Use as confirmation with your existing strategy
Trading Applications
Trend Confirmation
• Green candle confirms uptrend continuation
• Red candle confirms downtrend continuation
• Color changes signal potential trend shifts
Entry Timing
• Enter long when candle turns green with other confirmations
• Enter short when candle turns red with other confirmations
• Use as a filter to avoid counter-trend trades
Exit Signals
• Exit longs when candle turns red
• Exit shorts when candle turns green
• Protect profits by respecting color changes
Multi-Timeframe Analysis
• Use on higher timeframe for trend direction
• Use on lower timeframe for precise entries
• Align colors across timeframes for high-probability setups
Pro Tips
Combine with Support/Resistance: Use color changes at key levels for powerful signals
Volume Confirmation: Look for color changes with volume spikes for stronger moves
Multiple MAs: Add multiple instances with different lengths (e.g., 8 EMA, 21 EMA, 50 SMA)
Risk Management: Never trade on color alone - use proper stop losses and position sizing
CONCLUSION
Why MA Candle Color is Essential for Modern Traders?
In today's fast-paced markets, speed and clarity are everything. MA Candle Color delivers both by transforming complex Moving Average analysis into instant visual feedback.
Key Benefits Recap
-Faster Decision Making - No more mental calculations
-Reduced Errors - Visual clarity prevents mistakes
-Professional Appearance - Clean, distraction-free charts
-Universal Application - Works with any strategy or market
-Fully Customizable - Adapts to your exact needs
-Zero Repainting - Reliable, honest signals
-Lightweight - No performance impact
Who Benefits Most?
-Day Traders: Instant trend confirmation for quick entries/exits
-Scalpers: Split-second visual feedback for rapid trading
-Swing Traders: Clear trend alignment across timeframes
-Beginners: Simplified MA analysis without complexity
-Professionals: Clean visual layer for existing strategies
The Competitive Edge
While others are calculating price vs MA in their heads, you'll have instant visual confirmation. While they're second-guessing crossovers, you'll be executing with confidence. While their charts are cluttered with colored history, yours will be clean and focused on NOW.

Standard Deviation Vidya Moving Average | QuantLapseStandard Deviation Vidya MA by QuantLapse
Overview
The Standard Deviation Vidya MA indicator by QuantLapse is an dynamic and unique trend-following tool that leverages Variable Index Dynamic Average (VIDYA) along with a statistical measure of standard deviation to assess trend strength, direction and volatility. By utilizing adaptive smoothing and volatility adjustment this indicator provides a more responsive and robust signal framework for traders.
______
Technical Composition, Calculation, Key Components & Features
📌 VIDYA (Variable Index Dynamic Average)
An adaptive moving average that automatically adjusts its sensitivity based on prevailing market volatility.
Employs a volatility-weighted smoothing constant derived from standard deviation ratios, allowing the average to respond faster during high-momentum phases and slow down during consolidation.
Reduces lag during trend expansion while suppressing noise in low-volatility environments.
Provides clearer trend structure and regime awareness compared to fixed-length moving averages.
Serves as a dynamic baseline for volatility envelopes and trend-state classification within the system.
📌 Volatility Adjustment – Standard Deviation
The system constructs a volatility-adaptive envelope around the VIDYA baseline using standard deviation, allowing band width to expand and contract dynamically with changing market conditions.
VIDYA’s smoothing factor is adjusted by comparing short-term and longer-term standard deviation, increasing responsiveness during volatility expansion and dampening noise during compression.
Upper and lower bands are calculated by applying a configurable standard deviation multiplier to the VIDYA value, creating a proportional volatility boundary rather than a fixed offset.
Price movement beyond these bands confirms volatility-supported momentum, while price contained within the bands signals consolidation or transitional phases.
📌 Trend Signal Calculation
A bullish trend state is triggered when price closes above the upper standard deviation band, indicating sustained upward momentum with volatility confirmation.
A bearish trend state is triggered when price closes below the lower band, confirming downside momentum under expanding volatility.
Once established, the trend state persists until an opposing volatility break occurs, reducing whipsaw and improving regime stability.
Trend direction is visually reinforced through dynamic color-coding of the VIDYA line and its envelope, providing immediate directional context at a glance.
______
How It Works in Trading
✅ Trend Strength Detection – Evaluates cumulative price movement over a defined window to assess directional conviction.
✅ Noise Reduction – Applies adaptive smoothing techniques to minimize whipsaws during choppy conditions.
✅ Dynamic Thresholding – Utilizes volatility-aware bands to define customizable trend continuation and invalidation levels.
✅ Color-Coded Visualization – Enhances chart readability by clearly distinguishing bullish, bearish, and neutral states.
______
Visual Representation
Trend Signals on Moving Average and Background Color:
🟢 Green/Teal Moving Average – Strong Uptrend
🔴 Red/Pink Candles – Strong Downtrend
✅ Long & Short Labels can be turned on or off for trade signal clarity.
📊 Display of entry & exit points based on entry and exit criteria's.
📊 Display of Indicators equity and buy and hold equity to compare performance.
______
Features and User Inputs
The Standard Deviation Vidya MA framework incorporates a flexible set of user-defined inputs designed to balance adaptability, clarity, and analytical control.
VIDYA Configuration – Customize the Variable Index Dynamic Average length and price source to control trend responsiveness based on volatility-adjusted smoothing.
Volatility & Deviation Controls – Adjust standard deviation lookback periods and multipliers to fine-tune adaptive upper and lower thresholds used for trend qualification.
Backtesting & Date Filters – Define a start date for historical evaluation and enable range filtering to analyze performance during specific market periods.
Display & Visualization Options – Toggle labels, equity curves, and visual overlays to tailor the chart presentation to personal trading preferences.
Color Customization – Fully configurable buy/sell colors for both trend signals and equity curves, allowing intuitive visual differentiation between bullish and bearish phases.
______
Practical Applications
The Standard Deviation VIDYA MA is designed for traders seeking an adaptive trend-following framework that dynamically responds to changing market volatility. By combining VIDYA’s volatility-sensitive smoothing with standard deviation–based thresholds, the indicator offers a robust approach to directional analysis across multiple market conditions.
Key applications include:
Adaptive Trend Identification – Detect sustained bullish and bearish trends using a volatility-adjusted moving average that automatically accelerates or slows based on market activity.
Volatility-Aware Entry & Exit Signals – Utilize standard deviation bands to define dynamic breakout and invalidation zones, helping reduce false signals during low-volatility consolidation phases.
Noise-Filtered Trend Participation – Avoid whipsaws by requiring price expansion beyond adaptive deviation thresholds before confirming trend direction.
Systematic Backtesting & Evaluation – Analyze historical trend performance using built-in equity curves and date filters to assess effectiveness across different market regimes.
Visual Trend Confirmation – Leverage color-coded VIDYA lines, deviation zones, and optional labels to clearly interpret trend state and momentum strength in real time.
This framework bridges volatility analysis with adaptive trend logic, providing a disciplined and data-driven method for trend participation while maintaining clarity and interpretability in live trading environments.
______
Conclusion
The Standard Deviation VIDYA MA by QuantLapse represents a modern evolution of adaptive trend analysis, blending volatility-weighted smoothing with statistically driven deviation thresholds. By integrating VIDYA’s responsiveness with standard deviation-based confirmation, the system delivers clearer trend structure, reduced noise, and more reliable directional context across varying market regimes.
This indicator is particularly well-suited for traders who value adaptability, clarity, and rule-based decision-making over static moving average techniques.
🔹 Who should use Standard Deviation VIDYA MA:
📊 Trend-Following Traders – Identify and stay aligned with sustained directional moves while avoiding premature reversals.
⚡ Momentum Traders – Capture volatility-supported expansions when price breaks beyond adaptive deviation bands.
🤖 Systematic & Algorithmic Traders – Ideal as a volatility-aware trend filter for rule-based entries, exits, and portfolio frameworks.
🔹 Disclaimer: Past performance does not guarantee future results. All trading involves risk, and no indicator or methodology can ensure profitability.
🔹 Strategic Advice: Always backtest thoroughly, optimize parameters responsibly, and align settings with your personal risk tolerance, timeframe, and market conditions before deploying the indicator in live trading.

Ace Algo [Anson5129]🏆 Exclusive Indicator: Ace Algo
📈 Works for stocks, forex, crypto, indices
📈 Easy to use, real-time alerts, no repaint
📈 No grid, no martingale, no hedging
📈 One position at a time
----------------------------------------------------------------------------------------
Ace Algo
A trend-following TradingView strategy using a confluence of technical indicators and time-based rules for structured long/short entries and exits:
----------------------------------------------------------------------------------------
Parameters Explanation
Moving Average Length
Indicates the number of historical data points used for the average price calculation.
Shorter = volatile (short-term trends); longer = smoother (long-term trends, less noise).
Default: 20
Entry delay in bars
After a trade is closed, delay the next entry in bars. The lower the number, the more trades you will get.
Default: 4
Take Profit delay in bars
After a trade is opened, delay the take profit in bars. The lower the number, the more trades you will get.
Default: 3
Enable ADX Filter
No order will be placed when ADX < 20
Default: Uncheck
Block Period
Set a block period during which no trading will take place.
----------------------------------------------------------------------------------------
Entry Condition:
Only Long when the price is above the moving average (Orange line).
Only Short when the price is below the moving average (Orange line).
* Also, with some hidden parameter that I set in the backend.
Exit Condition:
When getting profit:
Trailing Stop Activates after a position has been open for a set number of bars (to avoid premature exits).
When losing money:
In a long position, when the price falls below the moving average, and the conditions for a short position are met, the long position will be closed, and the short position will be opened.
In a short position, when the price rises above the moving average, and the conditions for a long position are met, the short position will be closed, and the long position will be opened.
----------------------------------------------------------------------------------------
How to get access to the strategy
Read the author's instructions on the right to learn how to get access to the strategy.

MultiTimeFrame SMA/EMA & clouds [PACHI]This will allow you to plot multiple moving averages and clouds for the current timeframe and also up to 5 from different timeframes

Miela Labs | John Dee's Watchtower [257-463]Bridging the gap between 16th-century esoteric mathematics and modern algorithmic trading.
The Enochian Watchtower is not merely a trend indicator; it is a computational artifact developed by Miela Labs LLC. This script translates Dr. John Dee’s "Great Table of the Watchtowers" and the "Sigil Dei Aemeth" into actionable financial data points.
Using our proprietary Occultator V2.0 Engine, we have derived specific mathematical constants that resonate with the current market structure.
🏛️ The Algorithmic Logic
This indicator utilizes three sacred numbers to construct a "Future Vision" of the market:
1. The Axis Mundi (Vector 257): derived from Fermat Primes and John Dee’s Grid coordinates. This Weighted Moving Average (WMA) acts as the spinal cord of the trend.
2. The Gates (Cipher 463): A prime number derived from the "Galethog" cipher stride. These bands define the absolute volatility limits (Heaven & Earth Gates).
3. Future Vision (Offset 21): Utilizing Fibonacci time sequences, the indicator projects Support and Resistance levels 21 bars into the future, allowing traders to anticipate market movements before they occur.
⚡ How to Use
• The Trend: If price is above the Purple Axis (257), the market is in a bullish phase.
• The Entry: Look for "L" (Long) and "S" (Short) signals. These are confirmed when the signal path crosses the Axis.
• The Future: Watch the projected lines on the right side of the chart to identify upcoming resistance zones.
About Miela Labs
Miela Labs is a Technomancy Research Institute based in McKinney, Texas. We specialize in building open-source esoteric trading tools and the Magic Programming Language (MPL).
🌐 Official Hub: Visit Miela Labs
💻 Source Code & Research: GitHub Repository
Disclaimer: This tool is for educational and research purposes only. It demonstrates the application of esoteric mathematics in financial analysis. Trade responsibly.

The Abramelin Protocol [MPL]"Any sufficiently advanced technology is indistinguishable from magic." — Arthur C. Clarke
🌑 SYSTEM OVERVIEW
The Abramelin Protocol is not a standard technical indicator; it is a "Technomantic" trading algorithm engineered to bridge the gap between 15th-century esoteric mathematics and modern high-frequency markets.
This script is the flagship implementation of the MPL (Magic Programming Language) project—an open-source experimental framework designed to compile metaphysical intent into executable Python and Pine Script algorithms.
Unlike traditional indicators that rely on arbitrary constants (like the 14-period RSI or 200 SMA), this protocol calculates its parameters using "Dynamic Entity Gematria." We utilize a custom Python backend to analyze the ASCII vibrational frequencies of specific metaphysical archetypes, reducing them via Tesla's 3-6-9 harmonic principles to derive market-responsive periods.
🧬 WHAT IS ?
MPL (Magic Programming Language) is a domain-specific language and research initiative created to explore Technomancy—the art of treating code as a spellbook and the market as a chaotic entity to be tamed.
By integrating the logic of ancient Grimoires (such as The Book of Abramelin) with modern Data Science, MPL aims to discover hidden correlations in price action that standard tools overlook.
🔗 CONNECT WITH THE PROJECT:
If you are a developer, a trader, or a seeker of hidden knowledge, examine the source code and join the order:
• 📂 Official Project Site: hakanovski.github.io
• 🐍 MPL Source Code (GitHub): github.com
• 👨💻 Developer Profile (LinkedIn): www.linkedin.com
🔢 THE ALGORITHM: 452 - 204 - 50
The inputs for this script are mathematically derived signatures of the intelligence governing the system:
1. THE PAIMON TREND (Gravity)
• Origin: Derived from the ASCII summation of the archetype PAIMON (King of Secret Knowledge).
• Function: This 452-period Baseline acts as the market's "Event Horizon." It represents the deep, structural direction of the asset.
• Price > Line: Bullish Domain.
• Price < Line: Bearish Void.
2. THE ASTAROTH SIGNAL (Trigger)
• Origin: Derived from the ASCII summation of ASTAROTH (Knower of Past & Future), reduced by Tesla’s 3rd Harmonic.
• Function: This is the active trigger line. It replaces standard moving averages with a precise, gematria-aligned trajectory.
3. THE VOLATILITY MATRIX (Scalp)
• Origin: Based on the 9th Harmonic reduction.
• Function: Creates a "Cloud" around the signal line to visualize market noise.
🛡️ THE MILON GATE (Matrix Filter)
Unique to this script is the "MILON Gate" toggle found in the settings.
• ☑️ Active (Default): The algorithm applies the logic of the MILON Magic Square. Signals are ONLY generated if Volume and Volatility align with the geometric structure of the move. This filters out ~80% of false signals (noise).
• ⬜ Inactive: The algorithm operates in "Raw Mode," showing every mathematical crossover without the volume filter.
⚠️ OPERATIONAL USAGE
• Timeframe: Optimized for 4H (The Builder) and Daily (The Architect) charts.
• Strategy: Use the Black/Grey Line (452) as your directional bias. Take entries only when the "EXECUTE" (Long) or "PURGE" (Short) sigils appear.
Use this tool wisely. Risk responsibly. Let the harmonics guide your entries.
— Hakan Yorganci
Technomancer & Full Stack Developer

MorphWave Bands [JOAT]MorphWave Bands - Adaptive Volatility Envelope System
MorphWave Bands create a dynamic price envelope that automatically adjusts its width based on current market conditions. Unlike static Bollinger Bands, this indicator blends ATR and standard deviation with an efficiency ratio to expand during trending conditions and contract during consolidation.
What This Indicator Does
Plots adaptive upper and lower bands around a customizable moving average basis
Automatically adjusts band width using a blend of ATR and standard deviation
Detects volatility squeezes when bands contract to historical lows
Highlights breakouts when price moves beyond the bands
Provides squeeze alerts for anticipating volatility expansion
Adaptive Mechanism
The bands adapt through a multi-step process:
// Blend ATR and Standard Deviation
blendedVol = useAtrBlend ? (atrVal * 0.6 + stdVal * 0.4) : stdVal
// Normalize volatility to its historical range
volNorm = (blendedVol - volLow) / (volHigh - volLow)
// Create adaptive multiplier
adaptMult = baseMult * (0.5 + volNorm * adaptSens)
This creates bands that respond to market regime changes while maintaining stability.
Squeeze Detection
A squeeze is identified when band width drops below a specified percentile of its historical range:
Background highlighting indicates active squeeze conditions
Low percentile readings suggest compressed volatility
Squeeze exits often precede directional moves
Inputs Overview
Band Length — Period for basis calculation (default: 20)
Base Multiplier — Starting band width multiplier (default: 2.0)
MA Type — Choose from SMA, EMA, WMA, VWMA, or HMA
Adaptation Lookback — Historical period for normalization (default: 50)
Adaptation Sensitivity — How much bands respond to volatility changes
Squeeze Threshold — Percentile below which squeeze is detected
Dashboard Information
Current trend direction relative to basis and bands
Band width percentage
Squeeze status (Active or None)
Efficiency ratio
Current adaptive multiplier value
How to Use It
Look for squeeze conditions as potential precursors to breakouts
Use band touches as dynamic support/resistance references
Monitor breakout signals when price closes beyond bands
Combine with momentum indicators for directional confirmation
Alerts
Upper/Lower Breakout — Price exceeds band boundaries
Squeeze Entry/Exit — Volatility compression begins or ends
Basis Crosses — Price crosses the center line
This indicator is provided for educational purposes. It does not constitute financial advice.
— Made with passion by officialjackofalltrades

Session Sweep System – WarRoomXYZ V1WarRoom Session Sweep System v1 is a open-source institutional trading framework built to identify liquidity behavior across Asia, London, and New York sessions.
It combines session-based liquidity mapping, sweep detection, daily expansion modeling, and trend confirmation into a unified, timing-driven system optimized for XAUUSD, FX pairs, indices, and any instrument with session-dependent volatility.
This tool does not attempt to predict direction with arbitrary oscillators.
Instead, it focuses on the underlying market mechanisms that drive price:
liquidity, timing, expansion, and trend alignment.
Below is a detailed explanation of what the script does, how its components work, and how traders can use it effectively.
🔹 1. Session Liquidity Mapping
The script automatically identifies the Asia (00:00–06:00 GMT), London (07:00–12:00 GMT), and New York (13:00–17:00 GMT) sessions and builds real-time session ranges.
Each session creates a liquidity pool.
Trading institutions frequently sweep the high or low of one session before delivering the real move in the next session.
This script captures that behavior by:
►Drawing session range boxes
►Tracking previous session highs/lows
►Highlighting high-probability sweep locations
These ranges are essential reference points for timing entries and exits.
🔹 2. Liquidity Sweep Detection (Buy & Sell Sweeps)
The indicator identifies when price runs a previous session high/low and rejects back inside the range, which is commonly interpreted as a liquidity sweep.
The following sweep types are monitored:
►London sweeping Asia
►New York sweeping London
►Asia sweeping New York
►Daily sweep of PDH/PDL
Sweeps signal that liquidity has been collected and that a potential reversal or continuation is likely.
These are marked clearly on the chart for real-time decision-making.
🔹 3. Killzone Timing Model (GMT Time)
Market manipulation and expansion often occur during specific time windows.
The script highlights these institutional killzones:
►London Killzone: 07:00–10:00 GMT
►New York Killzone: 13:30–15:30 GMT
►NY PM Session: 19:00–21:00 GMT
Sweeps occurring inside these windows carry a significantly higher probability.
The timing layer helps filter out low-quality setups.
🔹 4. Daily Range & ADR Expansion Engine
A dedicated panel displays:
►Current day range
►ADR (Average Daily Range)
►Expansion stage (Early / Developed / Extended)
►PDH/PDL swept or intact
►Overall session bias
This allows traders to understand whether the daily move is likely to continue or reverse.
For example:
►Early expansion → trend continuation likely
►Extended expansion → reversal setups become more probable
This is useful for intraday targets and risk management.
🔹 5. MA Cloud Trend Model (Fast/Slow Structure)
To align liquidity behavior with directional conviction, the script includes a configurable MA engine:
►Fast & slow MA
►MA cloud
►Slope-based trend coloring
►Trend background
►MA cross alerts
The cloud provides trend confirmation without relying on oscillators.
Trades are higher quality when the sweep direction aligns with the MA trend.
🔹 6. How the Components Work Together
The script integrates several institutional concepts into one coherent model:
►Sessions define liquidity pools
►Sweeps identify stop-hunts and reversals
►Killzones define optimal timing
►MA Cloud confirms directional bias
►ADR engine indicates expansion potential
This creates a structured framework:
Sweep → Timing → Trend → Expansion → Execution
Each component strengthens the others, forming a robust decision-making model.
🔹 7. How to Use the Indicator (Practical Guide)
✔ Look for a sweep of a previous session level
When price runs a session high/low and closes back inside, liquidity has likely been collected.
✔ Confirm timing
Sweeps inside London or NY killzones tend to produce the strongest moves.
✔ Confirm trend
Use MA cloud direction and slope:
►Cloud green → long setups preferred
►Cloud red → short setups preferred
✔ Check ADR panel
If the day has already expanded significantly, reversal setups are more likely.
If expansion is still early, continuation setups are favored.
✔ Plan your trade
Common targets include:
►Opposite side of session range
►ADR High/Low
►PDH/PDL
Stops are typically placed beyond the sweep wick.
This creates a repeatable, rule-based approach to intraday liquidity trading.
🔹 8. Why This Script Is Original
This is not a mashup of existing open-source indicators.
It introduces:
►A custom session-linked liquidity sweep engine
►A structured daily expansion model
►Integrated killzone timing aligned with GMT
►A unified bias panel merging sweeps, ADR, and session manipulation
►A trend confirmation layer designed around session behavior
While it uses known institutional concepts, their integration, execution, and timing framework are unique, purpose-built, and not directly found in open-source scripts.
🔹 9. Suitable Markets
This indicator works best on:
►XAUUSD
►Major FX pairs
►US indices
►Synthetic markets with session cycles
Ideal timeframes: 1m, 5m, 15m, 30m
🔹 10. Limitations / Notes
This is an analytical tool, not a buy/sell signal generator
All sweeps are confirmed at candle close (non-repaint)
The tool assumes GMT session windows unless chart time differs
Users must practice risk management and entry triggers manually
Disclaimer
This script is provided for informational and educational purposes only. It does not provide financial, investment, or trading advice, and it does not guarantee profits or future performance. All decisions made based on this script are solely the responsibility of the user.
This script does not execute trades, manage risk, or replace the need for trader discretion. Market behavior can change quickly, and past behavior detected by the script does not ensure similar future outcomes.
Users should test the script on demo or simulation environments before applying it to live markets and must maintain full responsibility for their own risk management, position sizing, and trade execution.
Trading involves risk, and losses can exceed deposits. By using this script, you acknowledge that you understand and accept all associated risks.

Institutional Trend & Liquidity Nexus [Pro]Concept & Methodology
The core philosophy of this script is "Confluence Filtering." It does not simply overlay indicators; it forces them to work together. A signal is only valid if it aligns with the macro trend and liquidity structure.
Key Components:
Trend Engine: Uses a combination of EMA (7/21) for fast entries and SMA (200) for macro trend direction. The script includes a logical filter that invalidates Buy signals below the SMA 200 to prevent counter-trend trading.
Liquidity Imbalance (FVG): Automatically detects Fair Value Gaps to identify areas where price is likely to react. Unlike standalone FVG scripts, this module is visually optimized to show support/resistance zones without obscuring price action.
Smart Confluence Zones (Originality):
The script calculates a background "State" based on multiple factors.
Bullish Zone (Green Background): Triggers ONLY when Price > SMA 200 AND RSI > 50 AND Price > Baseline EMA.
Bearish Zone (Red Background): Triggers ONLY when Price < SMA 200 AND RSI < 50 AND Price < Baseline EMA.
This visual aid helps traders stay out of choppy markets and only focus when momentum and trend are aligned.
█ How to Use
Entry: Wait for a "Triangle" signal (Buy/Sell).
Validation: Check the Background Color. Is it highlighting a Confluence Zone?
Example: A Buy Signal inside a Green Confluence Zone is a high-probability setup.
Example: A Buy Signal with no background color suggests weak momentum and should be taken with caution.
Targets: Use the plotted FVG boxes as potential take-profit targets or re-entry zones.

Magic Moving AveragesThis indicator plots up to three adaptive “Magic MAs” plus a weighted combo line, with optional traditional SMAs for comparison.
Instead of averaging only closes, each Magic MA:
looks at the midpoints of highs/lows and opens/closes
decides whether recent behaviour favours the highs or the lows
builds a series of either highs or lows, then smooths it over your chosen length
You can run:
Short / Medium / Long Magic MAs
A weighted combo line (using 1–10 weights)
Optional traditional short/long SMAs on close
How I use it:
Price above the combo line → bullish bias
Price below the combo line → bearish bias
Short/medium/long Magic MAs together → dynamic support/resistance and trend structure
Traditional SMAs on for comparison with “classic” moving average behaviour
Inputs:
Magic MA lengths control how reactive vs smooth each regime is
Weights (1–10) let you emphasise short, medium or long regimes in the combo
This is a free / educational version of the Magic MAs.
It’s not financial advice – always manage your own risk.

Impulse Reactor RSI-SMA Trend Indicator [ApexLegion]Impulse Reactor RSI-SMA Trend Indicator
Introduction and Theoretical Background
Design Rationale
Standard indicators frequently generate binary 'BUY' or 'SELL' signals without accounting for the broader market context. This often results in erratic "Flip-Flop" behavior, where signals are triggered indiscriminately regardless of the prevailing volatility regime.
Impulse Reactor was engineered to address this limitation by unifying two critical requirements: Quantitative Rigor and Execution Flexibility.
The Solution
Composite Analytical Framework This script is not a simple visual overlay of existing indicators. It is an algorithmic synthesis designed to function as a unified decision-making engine. The primary objective was to implement rigorous quantitative analysis (Volatility Normalization, Structural Filtering) directly within an alert-enabled framework. This architecture is designed to process signals through strict, multi-factor validation protocols before generating real-time notifications, allowing users to focus on structurally validated setups without manual monitoring.
How It Works
This is not a simple visual mashup. It utilizes a cross-validation algorithm where the Trend Structure acts as a gatekeeper for Momentum signals:
Logic over Lag: Unlike simple moving average crossovers, this script uses a 15-layer Gradient Ribbon to detect "Laminar Flow." If the ribbon is knotted (Compression), the system mathematically suppresses all signals.
Volatility Normalization: The core calculation adapts to ATR (Average True Range). This means the indicator automatically expands in volatile markets and contracts in quiet ones, maintaining accuracy without constant manual tweaking.
Adaptive Signal Thresholding: It incorporates an 'Anti-Greed' algorithm (Dynamic Thresholding) that automatically adjusts entry criteria based on trend duration. This logic aims to mitigate the risk of entering positions during periods of statistical trend exhaustion.
Why Use It?
Market State Decoding: The gradient Ribbon visualizes the underlying trend phase in real-time.
◦ Cyan/Blue Flow: Strong Bullish Trend (Laminar Flow).
◦ Magenta/Pink Flow: Strong Bearish Trend.
◦ Compressed/Knotted: When the ribbon lines are tightly squeezed or overlapping, it signals Consolidation. The system filters signals here to avoid chop.
Noise Reduction: The goal is not to catch every pivot, but to isolate high-confidence setups. The logic explicitly filters out minor fluctuations to help maintain position alignment with the broader trend.
⚖️ Chapter 1: System Architecture
Introduction: Composite Analytical Framework
System Overview
Impulse Reactor serves as a comprehensive technical analysis engine designed to synthesize three distinct market dimensions—Momentum, Volatility, and Trend Structure—into a unified decision-making framework. Unlike traditional methods that analyze these metrics in isolation, this system functions as a central processing unit that integrates disparate data streams to construct a coherent model of market behavior.
Operational Objective
The primary objective is to transition from single-dimensional signal generation to a multi-factor assessment model. By fusing data from the Impulse Core (Volatility), Gradient Oscillator (Momentum), and Structural Baseline (Trend), the system aims to filter out stochastic noise and identify high-probability trade setups grounded in quantitative confluence.
Market Microstructure Analysis: Limitations of Conventional Models
Extensive backtesting and quantitative analysis have identified three critical inefficiencies in standard oscillator-based strategies:
• Bounded Oscillator Limitations (The "Oscillation Trap"): Traditional indicators such as RSI or Stochastics are mathematically constrained between fixed values (0 to 100). In strong trending environments, these metrics often saturate in "overbought" or "oversold" zones. Consequently, traders relying on static thresholds frequently exit structurally valid positions prematurely or initiate counter-trend trades against prevailing momentum, resulting in suboptimal performance.
• Quantitative Blindness to Quality: Standard moving averages and trend indicators often fail to distinguish the qualitative nature of price movement. They treat low-volume drift and high-velocity expansion identically. This inability to account for "Volatility Quality" leads to delayed responsiveness during critical market events.
• Fractal Dissonance (Timeframe Disconnect): Financial markets exhibit fractal characteristics where trends on lower timeframes may contradict higher timeframe structures. Manual integration of multi-timeframe analysis increases cognitive load and susceptibility to human error, often resulting in conflicting biases at the point of execution.
Core Design Principles
To mitigate the aforementioned systemic inefficiencies, Impulse Reactor employs a modular architecture governed by three foundational principles:
Principle A:
Volatility Precursor Analysis Market mechanics demonstrate that volatility expansion often functions as a leading indicator for directional price movement. The system is engineered to detect "Volatility Deviation" — specifically, the divergence between short-term and long-term volatility baselines—prior to its manifestation in price action. This allows for entry timing aligned with the expansion phase of market volatility.
Principle B:
Momentum Density Visualization The system replaces singular momentum lines with a "Momentum Density" model utilizing a 15-layer Simple Moving Average (SMA) Ribbon.
• Concept: This visualization represents the aggregate strength and consistency of the trend.
• Application: A fully aligned and expanded ribbon indicates a robust trend structure ("Laminar Flow") capable of withstanding minor counter-trend noise, whereas a compressed ribbon signals consolidation or structural weakness.
Principle C:
Adaptive Confluence Protocols Signal validity is strictly governed by a multi-dimensional confluence logic. The system suppresses signal generation unless there is synchronized confirmation across all three analytical vectors:
1. Volatility: Confirmed expansion via the Impulse Core.
2. Momentum: Directional alignment via the Hybrid Oscillator.
3. Structure: Trend validation via the Baseline. This strict filtering mechanism significantly reduces false positives in non-trending (choppy) environments while maintaining sensitivity to genuine breakouts.
🔍 Chapter 2: Core Modules & Algorithmic Logic
Module A: Impulse Core (Normalized Volatility Deviation)
Operational Logic The Impulse Core functions as a volatility-normalized momentum gauge rather than a standard oscillator. It is designed to identify "Volatility Contraction" (Squeeze) and "Volatility Expansion" phases by quantifying the divergence between short-term and long-term volatility states.
Volatility Z-Score Normalization
The formula implements a custom normalization algorithm. Unlike standard oscillators that rely on absolute price changes, this logic calculates the Z-Score of the Volatility Spread.
◦ Numerator: (atr_f - atr_s) captures the raw momentum of volatility expansion.
◦ Denominator: (std_f + 1e-6) standardizes this value against historical variance.
◦ Result: This allows the indicator scales consistently across assets (e.g., Bitcoin vs. Euro) without manual recalibration.
f_impulse() =>
atr_f = ta.atr(fastLen) // Fast Volatility Baseline
atr_s = ta.atr(slowLen) // Slow Volatility Baseline
std_f = ta.stdev(atr_f, devLen) // Volatility Standard Deviation
(atr_f - atr_s) / (std_f + 1e-6) // Normalized Differential Calculation
Algorithmic Framework
• Differential Calculation: The system computes the spread between a Fast Volatility Baseline (ATR-10) and a Slow Volatility Baseline (ATR-30).
• Normalization Protocol: To standardize consistency across diverse asset classes (e.g., Forex vs. Crypto), the raw differential is divided by the standard deviation of the volatility itself over a 30-period lookback.
• Signal Generation:
◦ Contraction (Squeeze): When the Fast ATR compresses below the Slow ATR, it registers a potential volatility buildup phase.
◦ Expansion (Release): A rapid divergence of the Fast ATR above the Slow ATR signals a confirmed volatility expansion, validating the strength of the move.
Module B: Gradient Oscillator (RSI-SMA Hybrid)
Design Rationale To mitigate the "noise" and "false reversal" signals common in single-line oscillators (like standard RSI), this module utilizes a 15-Layer Gradient Ribbon to visualize momentum density and persistence.
Technical Architecture
• Ribbon Array: The system generates 15 sequential Simple Moving Averages (SMA) applied to a volatility-adjusted RSI source. The length of each layer increases incrementally.
• State Analysis:
Momentum Alignment (Laminar Flow): When all 15 layers are expanded and parallel, it indicates a robust trend where buying/selling pressure is distributed evenly across multiple timeframes. This state helps filter out premature "overbought/oversold" signals.
• Consolidation (Compression): When the distance between the fastest layer (Layer 1) and the slowest layer (Layer 15) approaches zero or the layers intersect, the system identifies a "Non-Tradable Zone," preventing entries during choppy market conditions.
// Laminar Flow Validation
f_validate_trend() =>
// Calculate spread between Ribbon layers
ribbon_spread = ta.stdev(ribbon_array, 15)
// Only allow signals if Ribbon is expanded (Laminar Flow)
is_flowing = ribbon_spread > min_expansion_threshold
// If compressed (Knotted), force signal to false
is_flowing ? signal : na
Module C: Adaptive Signal Filtering (Behavioral Bias Mitigation)
This subsystem, operating as an algorithmic "Anti-Greed" Mechanism, addresses the statistical tendency for signal degradation following prolonged trends.
Dynamic Threshold Adjustment
• Win Streak Detection: The algorithm internally tracks the outcome of closed trade cycles.
• Sensitivity Multiplier: Upon detecting consecutive successful signals in the same direction, a Penalty_Factor is applied to the entry logic.
• Operational Impact: This effectively raises the Required_Slope threshold for subsequent signals. For example, after three consecutive bullish signals, the system requires a 30% steeper trend angle to validate a fourth entry. This enforces stricter discipline during extended trends to reduce the probability of entering at the point of trend exhaustion.
Anti-Greed Logic: Dynamic Threshold Calculation
f_adjust_threshold(base_slope, win_streak) =>
// Adds a 10% penalty to the difficulty for every consecutive win
penalty_factor = 0.10
risk_scaler = 1 + (win_streak * penalty_factor)
// Returns the new, harder-to-reach threshold
base_slope * risk_scaler
Module D: Trend Baseline (Triple-Smoothed Structure)
The Trend Baseline serves as the structural filter for all signals. It employs a Triple-Smoothed Hybrid Algorithm designed to balance lag reduction with noise filtration.
Smoothing Stages
1. Volatility Banding: Utilizes a SuperTrend-based calculation to establish the upper and lower boundaries of price action.
2. Weighted Filter: Applies a Weighted Moving Average (WMA) to prioritize recent price data.
3. Exponential Smoothing: A final Exponential Moving Average (EMA) pass is applied to create a seamless baseline curve.
Functionality
This "Heavy" baseline resists minor intraday volatility spikes while remaining responsive to sustained structural shifts. A signal is only considered valid if the price action maintains structural integrity relative to this baseline
🚦 Chapter 3: Risk Management & Exit Protocols
Quantitative Risk Management (TP/SL & Trailing)
Foundational Architecture: Volatility-Adjusted Geometry Unlike strategies relying on static nominal values, Impulse Reactor establishes dynamic risk boundaries derived from quantitative volatility metrics. This design aligns trade invalidation levels mathematically with the current market regime.
• ATR-Based Dynamic Bracketing:
The protocol calculates Stop-Loss and Take-Profit levels by applying Fibonacci coefficients (Default: 0.786 for SL / 1.618 for TP) to the Average True Range (ATR).
◦ High Volatility Environments: The risk bands automatically expand to accommodate wider variance, preventing premature exits caused by standard market noise.
◦ Low Volatility Environments: The bands contract to tighten risk parameters, thereby dynamically adjusting the Risk-to-Reward (R:R) geometry.
• Close-Validation Protocol ("Soft Stop"):
Institutional algorithms frequently execute liquidity sweeps—driving prices briefly below key support levels to accumulate inventory.
◦ Mechanism: When the "Soft Stop" feature is enabled, the system filters out intraday volatility spikes. The stop-loss is conditional; execution is triggered only if the candle closes beyond the invalidation threshold.
◦ Strategic Advantage: This logic distinguishes between momentary price wicks and genuine structural breakdowns, preserving positions during transient volatility.
• Step-Function Trailing Mechanism:
To protect unrealized PnL while allowing for normal price breathing, a two-phase trailing methodology is employed:
◦ Phase 1 (Activation): The trailing function remains dormant until the price advances by a pre-defined percentage threshold.
◦ Phase 2 (Dynamic Floor): Once armed, the stop level creates a moving floor, adjusting relative to price action while maintaining a volatility-based (ATR) buffer to systematically protect unrealized PnL.
• Algorithmic Exit Protocols (Dynamic Liquidity Analysis)
◦ Rationale: Inefficiencies of Static Targets Static "Take Profit" levels often result in suboptimal exits. They compel traders to close positions based on arbitrary figures rather than evolving market structure, potentially capping upside during significant trends or retaining positions while the underlying trend structure deteriorates.
◦ Solution: Structural Integrity Assessment The system utilizes a Dynamic Liquidity Engine to continuously audit the validity of the position. Instead of targeting a specific price point, the algorithm evaluates whether the trend remains statistically robust.
Multi-Factor Exit Logic (The Tri-Vector System)
The Smart Exit protocol executes only when specific algorithmic invalidation criteria are met:
• 1. Momentum Exhaustion (Confluence Decay): The system monitors a 168-hour rolling average of the Confluence Score. A significant deviation below this historical baseline indicates momentum exhaustion, signaling that the driving force behind the trend has dissipated prior to a price reversal. This enables preemptive exits before a potential drawdown.
• 2. Statistical Over-Extension (Mean Reversion): Utilizing the core volatility logic, the system identifies instances where price deviates beyond 2.0 standard deviations from the mean. While the trend may be technically bullish, this statistical anomaly suggests a high probability of mean reversion (elastic snap-back), triggering a defensive exit to capitalize on peak valuation.
• 3. Oscillator Rejection (Immediate Pivot): To manage sudden V-shaped volatility, the system monitors RSI pivots. If a sharp "Pivot High" or divergence is detected, the protocol triggers an immediate "Peak Exit," bypassing standard trend filters to secure liquidity during high-velocity reversals.
🎨 Chapter 4: Visualization Guide
Gradient Oscillator Ribbon
The 15-layer SMA ribbon visualized via plot(r1...r15) represents the "Momentum Density" of the market.
• Visuals:
◦ Cyan/Blue Ribbon: Indicates Bullish Momentum.
◦ Pink/Magenta Ribbon: Indicates Bearish Momentum.
• Interpretation:
◦ Laminar Flow: When the ribbon expands widely and flows in parallel, it signifies a robust trend where momentum is distributed evenly across timeframes. This is the ideal state for trend-following.
◦ Compression (Consolidation): If the ribbon becomes narrow, twisted, or knotted, it indicates a "Non-Tradable Zone" where the market lacks a unified direction. Traders are advised to wait for clarity.
◦ Over-Extension: If the top layer crosses the Overbought (85) or Oversold (15) lines, it visually warns of potential market overheating.
Trend Baseline
The thick, color-changing line plotted via plot(baseline) represents the Structural Backbone of the market.
• Visuals: Changes color based on the trend direction (Blue for Bullish, Pink for Bearish).
• Interpretation:
Structural Filter: Long positions are statistically favored only when price action sustains above this baseline, while short positions are favored below it.
Dynamic Support/Resistance: The baseline acts as a dynamic support level during uptrends and resistance during downtrends.
Entry Signals & Labels
Text labels ("Long Entry", "Short Entry") appear when the system detects high-probability setups grounded in quantitative confluence.
• Visuals: Labeled signals appear above/below specific candles.
• Interpretation:
These signals represent moments where Volatility (Expansion), Momentum (Alignment), and Structure (Trend) are synchronized.
Smart Exit: Labels such as "Smart Exit" or "Peak Exit" appear when the system detects momentum exhaustion or structural decay, prompting a defensive exit to preserve capital.
Dynamic TP/SL Boxes
The semi-transparent colored zones drawn via fill() represent the risk management geometry.
• Visuals: Colored boxes extending from the entry point to the Take Profit (TP) and Stop Loss (SL) levels.
• Function:
Volatility-Adjusted Geometry: Unlike static price targets, these boxes expand during high volatility (to prevent wicks from stopping you out) and contract during low volatility (to optimize Risk-to-Reward ratios).
SAR + MACD Glow
Small glowing shapes appearing above or below candles.
• Visuals: Triangle or circle glows near the price bars.
• Interpretation:
This visual indicates a secondary confirmation where Parabolic SAR and MACD align with the main trend direction. It serves as an additional confluence factor to increase confidence in the trade setup.
Support/Resistance Table
A small table located at the bottom-right of the chart.
• Function: Automatically identifies and displays recent Pivot Highs (Resistance) and Pivot Lows (Support).
• Interpretation: These levels can be used as potential targets for Take Profit or invalidation points for manual Stop Loss adjustments.
🖥️ Chapter 5: Dashboard & Operational Guide
Integrated Analytics Panel (Dashboard Overview)
To facilitate rapid decision-making without manual calculation, the system aggregates critical market dimensions into a unified "Heads-Up Display" (HUD). This panel monitors real-time metrics across multiple timeframes and analytical vectors.
A. Intermediate Structure (12H Trend)
• Function: Anchors the intraday analysis to the broader market structure using a 12-hour rolling window.
• Interpretation:
◦ Bullish (> +0.5%): Indicates a positive structural bias. Long setups align with the macro flow.
◦ Bearish (< -0.5%): Indicates structural weakness. Short setups are statistically favored.
◦ Neutral: Represents a ranging environment where the Confluence Score becomes the primary weighting factor.
B. Composite Confluence Score (Signal Confidence)
• Definition: A probability metric derived from the synchronization of Volatility (Impulse Core), Momentum (Ribbon), and Trend (Baseline).
• Grading Scale:
Strong Buy/Sell (> 7.0 / < 3.0): Indicates full alignment across all three vectors. Represents a "Prime Setup" eligible for standard position sizing.
Buy/Sell (5.0–7.0 / 3.0–5.0): Indicates a valid trend but with moderate volatility confirmation.
Neutral: Signals conflicting data (e.g., Bullish Momentum vs. Bearish Structure). Trading is not recommended ("No-Trade Zone").
C. Statistical Deviation Status (Mean Reversion)
• Logic: Utilizes Bollinger Band deviation principles to quantify how far price has stretched from the statistical mean (20 SMA).
• Alert States:
Over-Extended (> 2.0 SD): Warning that price is statistically likely to revert to the mean (Elastic Snap-back), even if the trend remains technically valid. New entries are discouraged in this zone.
Normal: Price is within standard distribution limits, suitable for trend-following entries.
D. Volatility Regime Classification
• Metric: Compares current ATR against a 100-period historical baseline to categorize the market state.
• Regimes:
Low Volatility (Lvl < 1.0): Market Compression. Often precedes volatility expansion events.
Mid Volatility (Lvl 1.0 - 1.5): Standard operating environment.
High Volatility (Lvl > 1.5): Elevated market stress. Risk parameters should be adjusted (e.g., reduced position size) to account for increased variance.
E. Performance Telemetry
• Function: Displays the historical reliability of the Trend Baseline for the current asset and timeframe.
• Operational Threshold: If the displayed Win Rate falls below 40%, it suggests the current market behavior is incoherent (choppy) and does not respect trend logic. In such cases, switching assets or timeframes is recommended.
Operational Protocols & Signal Decoding
Visual Interpretation Standards
• Laminar Flow (Trade Confirmation): A valid trend is visually confirmed when the 15-layer SMA Ribbon is fully expanded and parallel. This indicates distributed momentum across timeframes.
• Consolidation (No-Trade): If the ribbon appears twisted, knotted, or compressed, the market lacks a unified directional vector.
• Baseline Interaction: The Triple-Smoothed Baseline acts as a dynamic support/resistance filter. Long positions remain valid only while price sustains above this structure.
System Calibration (Settings)
• Adaptive Signal Filtering (Prev. Anti-Greed): Enabled by default. This logic automatically raises the required trend slope threshold following consecutive wins to mitigate behavioral bias.
• Impulse Sensitivity: Controls the reactivity of the Volatility Core. Higher settings capture faster moves but may introduce more noise.
⚙️ Chapter 6: System Configuration & Alert Guide
This section provides a complete breakdown of every adjustable setting within Impulse Reactor to assist you in tailoring the engine to your specific needs.
🌐 LANGUAGE SETTINGS (Localization)
◦ Select Language (Default: English):
Function: Instantly translates all chart labels, dashboard texts into your preferred language.
Supported: English, Korean, Chinese, Spanish
⚡ IMPULSE CORE SETTINGS (Volatility Engine)
◦ Deviation Lookback (Default: 30): The period used to calculate the standard deviation of volatility.
Role: Sets the baseline for normalizing momentum. Higher values make the core smoother but slower to react.
◦ Fast Pulse Length (Default: 10): The short-term ATR period.
Role: Detects rapid volatility expansion.
◦ Slow Pulse Length (Default: 30): The long-term ATR baseline.
Role: Establishes the background volatility level. The core signal is derived from the divergence between Fast and Slow pulses.
🎯 TP/SL SETTINGS (Risk Management)
◦ SL/TP Fibonacci (Default: 0.786 / 1.618): Selects the Fibonacci ratio used for risk calculation.
◦ SL/TP Multiplier (Default: 1.5 / 2): Applies a multiplier to the ATR-based bands.
Role: Expands or contracts the Take Profit and Stop Loss boxes. Increase these values for higher volatility assets (like Altcoins) to avoid premature stop-outs.
◦ ATR Length (Default: 14): The lookback period for calculating the Average True Range used in risk geometry.
◦ Use Soft Stop (Close Basis):
Role: If enabled, Stop Loss alerts only trigger if a candle closes beyond the invalidation level. This prevents being stopped out by wick manipulations.
🔊 RIBBON SETTINGS (Momentum Visualization)
◦ Show SMA Ribbon: Toggles the visibility of the 15-layer gradient ribbon.
◦ Ribbon Line Count (Default: 15): The number of SMA lines in the ribbon array.
◦ Ribbon Start Length (Default: 2) & Step (Default: 1): Defines the spread of the ribbon.
Role: Controls the "thickness" of the momentum density visualization. A wider step creates a broader ribbon, useful for higher timeframes.
📎 DISPLAY OPTIONS
◦ Show Entry Lines / TP/SL Box / Position Labels / S/R Levels / Dashboard: Toggles individual visual elements on the chart to reduce clutter.
◦ Show SAR+MACD Glow: Enables the secondary confirmation shapes (triangles/circles) above/below candles.
📈 TREND BASELINE (Structural Filter)
◦ Supertrend Factor (Default: 12) & ATR Period (Default: 90): Controls the sensitivity of the underlying Supertrend algorithm used for the baseline calculation.
◦ WMA Length (40) & EMA Length (14): The smoothing periods for the Triple-Smoothed Baseline.
◦ Min Trend Duration (Default: 10): The minimum number of bars the trend must be established before a signal is considered valid.
🧠 SMART EXIT (Dynamic Liquidity)
◦ Use Smart Exit: Enables the momentum exhaustion logic.
◦ Exit Threshold Score (Default: 3): The sensitivity level for triggering a Smart Exit. Lower values trigger earlier exits.
◦ Average Period (168) & Min Hold Bars (5): Defines the rolling window for momentum decay analysis and the minimum duration a trade must be held before Smart Exit logic activates.
🛡️ TRAILING STOP (Step)
◦ Use Trailing Stop: Activates the step-function trailing mechanism.
◦ Step 1 Activation % (0.5) & Offset % (0.5): The price must move 0.5% in your favor to arm the first trail level, which sets a stop 0.5% behind price.
◦ Step 2 Activation % (1) & Offset % (0.2): Once price moves 1%, the trail tightens to 0.2%, securing the position.
🌀 SAR & MACD SETTINGS (Secondary Confirmation)
◦ SAR Start/Increment/Max: Standard Parabolic SAR parameters.
◦ SAR Score Scaling (ATR): Adjusts how much weight the SAR signal has in the overall confluence score.
◦ MACD Fast/Slow/Signal: Standard MACD parameters used for the "Glow" signals.
🔄 ANTI-GREED LOGIC (Behavioral Bias)
◦ Strict Entry after Win: Enables the negative feedback loop.
◦ Strict Multiplier (Default: 1.1): Increases the entry difficulty by 10% after each win.
Role: Prevents overtrading and entering at the top of an extended trend.
🌍 HTF FILTER (Multi-Timeframe)
◦ Use Auto-Adaptive HTF Filter: Automatically selects a higher timeframe (e.g., 1H -> 4H) to filter signals.
◦ Bypass HTF on Steep Trigger: Allows an entry even against the HTF trend if the local momentum slope is exceptionally steep (catch powerful reversals).
📉 RSI PEAK & CHOPPINESS
◦ RSI Peak Exit (Instant): Triggers an immediate exit if a sharp RSI pivot (V-shape) is detected.
◦ Choppiness Filter: Suppresses signals if the Choppiness Index is above the threshold (Default: 60), indicating a flat market.
📐 SLOPE TRIGGER LOGIC
◦ Force Entry on Steep Slope: Overrides other filters if the price angle is extremely vertical (high velocity).
◦ Slope Sensitivity (1.5): The angle required to trigger this override.
⛔ FLAT MARKET FILTER (ADX & ATR)
◦ Use ADX Filter: Blocks signals if ADX is below the threshold (Default: 20), indicating no trend.
◦ Use ATR Flat Filter: Blocks signals if volatility drops below a critical level (dead market).
🔔 Alert Configuration Guide
Impulse Reactor is designed with a comprehensive suite of alert conditions, allowing you to automate your trading or receive real-time notifications for specific market events.
How to Set Up:
Click the "Alert" (Clock) icon in the TradingView toolbar.
Select "Impulse Reactor " from the Condition dropdown.
Choose one of the specific trigger conditions below:
🚀 Entry Signals (Trend Initiation)
Long Entry:
Trigger: Fires when a confirmed Bullish Setup is detected (Momentum + Volatility + Structure align).
Usage: Use this to enter new Long positions.
Short Entry:
Trigger: Fires when a confirmed Bearish Setup is detected.
Usage: Use this to enter new Short positions.
🎯 Profit Taking (Target Levels)
Long TP:
Trigger: Fires when price hits the calculated Take Profit level for a Long trade.
Usage: Automate partial or full profit taking.
Short TP:
Trigger: Fires when price hits the calculated Take Profit level for a Short trade.
Usage: Automate partial or full profit taking.
🛡️ Defensive Exits (Risk Management)
Smart Exit:
Trigger: Fires when the system detects momentum decay or statistical exhaustion (even if the trend hasn't fully reversed).
Usage: Recommended for tightening stops or closing positions early to preserve gains.
Overbought / Oversold:
Trigger: Fires when the ribbon extends into extreme zones.
Usage: Warning signal to prepare for a potential reversal or pullback.
💡 Secondary Confirmation (Confluence)
SAR+MACD Bullish:
Trigger: Fires when Parabolic SAR and MACD align bullishly with the main trend.
Usage: Ideal for Pyramiding (adding to an existing winning position).
SAR+MACD Bearish:
Trigger: Fires when Parabolic SAR and MACD align bearishly.
Usage: Ideal for adding to short positions.
⚠️ Chapter 7: Conclusion & Risk Disclosure
Methodological Synthesis
Impulse Reactor represents a shift from reactive price tracking to proactive energy analysis. By decomposing market activity into its atomic components — Volatility, Momentum, and Structure — and reconstructing them into a coherent decision model, the system aims to provide a quantitative framework for market engagement. It is designed not to predict the future, but to identify high-probability conditions where kinetic energy and trend structure align.
Disclaimer & Risk Warnings
◦ Educational Purpose Only
This indicator, including all associated code, documentation, and visual outputs, is provided strictly for educational and informational purposes. It does not constitute financial advice, investment recommendations, or a solicitation to buy or sell any financial instruments.
◦ No Guarantee of Performance
Past performance is not indicative of future results. All metrics displayed on the dashboard (including "Win Rate" and "P&L") are theoretical calculations based on historical data. These figures do not account for real-world trading factors such as slippage, liquidity gaps, spread costs, or broker commissions.
◦ High-Risk Warning
Trading cryptocurrencies, futures, and leveraged financial products involves a substantial risk of loss. The use of leverage can amplify both gains and losses. Users acknowledge that they are solely responsible for their trading decisions and should conduct independent due diligence before executing any trades.
◦ Software Limitations
The software is provided "as is" without warranty. Users should be aware that market data feeds on analysis platforms may experience latency or outages, which can affect signal generation accuracy.

Multi EMA (10)Allows you to add and configure up to 10 EMAs to your chart with a single indicator. Enjoy.
