TechDash+Deliv: EMA+RSI+Supertrend + Delivery Volume Dashboar Strategy Logic
This dashboard combines 6 key conditions to generate a BUY signal:
Price above EMA 21 – Short‑term uptrend.
Price above EMA 50 – Medium‑term uptrend.
Price above EMA 200 – Long‑term uptrend.
RSI between 45–65 – Not overbought, not oversold (sweet spot).
Volume > 1.25× 5‑bar average – Strong participation.
Supertrend bullish – Trend in favor of longs.
A BUY signal is generated when 4 or more conditions are satisfied (configurable).
📊 Dashboard Features
The top‑right table shows:
Technical Signals
EMA 21 / 50 / 200
RSI 45–65
Volume > 1.25× avg
Supertrend direction
Delivery Volume (proxy)
Delivery Qty (K)
Avg Delivery Qty (K)
Delivery Qty × Avg
Sector & Market Context
Sector, Industry
Sector Index % Change (e.g., NIFTY, BANKNIFTY, etc.)
🚨 Delivery Volume Highlight
Delivery Qty × Avg is highlighted in light green when:
Delivery Qty > 2× Avg Delivery Qty
This helps quickly spot stocks with unusually high delivery volume, which often indicates strong accumulation.
🎯 How to Use
Apply on daily or higher timeframes for swing/position trading.
Use the BUY arrow as a trigger, but always confirm with:
Price action (support / breakout)
Sector strength
Risk management (SL, position size).
⚠️ Important Notes
Delivery Qty is a proxy based on volume (since TradingView does not provide real delivery data).
You can later replace volume with real delivery data if you have access to it (e.g., via screener or broker).
This is a dashboard + signal, not a fully automated trading bot. Use it as a decision‑support tool.
Moyennes mobiles

V-Max L1: Strategic Horizon & Trend Navigator Overview V-Max L1 is a strategic trend-following indicator designed to filter market noise and identify macro inertia. It combines multiple classical technical theories into a unified visual system to help traders maintain direction in volatile markets.
Technical Logic & Calculations This script integrates several key components to justify its invite-only status:
Trend Filter: Uses a 200/233 EMA (Vegas Tunnel) as the core trend boundary.
Momentum Integration: Uses a multi-length RSI algorithm to detect overbought/oversold conditions (Yellow/Pink signals).
Volume Analysis: Monitors relative volume spikes (>1.5x average) to identify institutional "Ignition Candles."
Signal Smoothing: Employs MTF (Multi-Timeframe) confirmation logic to reduce signal flickering on lower timeframes.
How to Use
Background Color: Indicates the macro trend (Gray for Bullish, Dark Red for Bearish).
Launch Signals: "Long/Short" labels appear when 10/30 MA crossovers occur under specific RSI conditions.
Top/Bottom Signals: Based on long-cycle RSI extremes for strategic reversals.
產品概述 V-Max L1 戰略地圖是一款趨勢跟蹤指標,旨在過濾市場雜訊並識別宏觀慣性。它將多種經典技術理論整合到統一的視覺系統中,幫助交易者在波動市場中保持方向。
技術邏輯與計算 本腳本整合了以下核心組件:
趨勢過濾:使用 200/233 EMA (維加斯通道) 作為核心趨勢分水嶺。
動能整合:使用多長度 RSI 算法檢測超買/超賣狀況(黃燈/粉燈)。
量價分析:監測超過 1.5 倍的異常成交量,標註機構級「點火 K 線」。
訊號平滑:採用多時區確認邏輯,減少低時區的訊號閃爍。
如何使用
背景顏色:顯示宏觀趨勢(灰色代表多頭,暗紅色代表空頭)。
發射訊號:當 10/30 MA 在特定 RSI 條件下完成交叉時顯示。
This is an invite-only indicator. For access and authorization, please contact: 👉 Telegram: @VMax_Helper_bot
Disclaimer: This script is for technical analysis only and does not constitute financial advice.

RAHU1System Overview
This is a comprehensive "Confluence-Only" execution tool designed for intraday trend following. It removes the clutter of traditional charts by hiding all calculation lines and only displaying high-probability execution labels and objective exit targets.
The Four Execution Pillars
The system logic is built on four distinct "Smart-Entry" models:
Velocity Alignment: Triggers when price momentum synchronizes with a multi-period average, ensuring you enter as the move accelerates.
Structural Expansion: Detects when price aggressively breaks through short-term and medium-term trend baselines with a high-expansion candle.
The Reversion Bounce: Identifies "buy-the-dip" or "sell-the-rally" opportunities where price tests a trend line and shows a strong rejection.
Two-Stage Confirmation: A specialized logic that requires momentum to clear two separate "strength gates" before a signal is printed.
The "Anti-Trap" Filter Logic
To prevent entries during sideways or "fake" market moves, every signal must pass a Triple-Check Validation:
Volume Breakthrough: The signal candle must show higher-than-average participation.
Relative Value Filter: The system tracks the volume-weighted mean of the day; it strictly forbids buying when price is "expensive" or selling when "cheap" relative to this mean.
Directional Flow: Uses internal flow data to ensure "Smart Money" is actively pushing in the direction of the trade.
Dynamic Target Mapping
The system does not just tell you when to enter; it provides immediate objective targets. Once a "B" signal appears, three dashed levels are projected:
Level 1 (--- T1): Scalp/Partial Exit.
Level 2 (--- T2): Trend Extension.
Level 3 (--- T3): Volatility Expansion.
Visual Interface
B (Green): Bullish Execution (Call side).
B (Red): Bearish Execution (Put side).
Dashed Lines: Clear, non-intrusive profit targets.
Chart Style: Ultra-clean. No moving averages or oscillators are visible, keeping your focus on Price Action. No guaranteed profits
Clear disclaimer like: “This is not financial advice”

banks: basic plan compatible 🌟 Banking Basket Analysis v5.9 (Vol/RSI Always ON) – Works perfectly on FREE/Basic plan! 🌟
Only 14 security calls – super low, no lag, fully compatible with TradingView basic accounts.
Track strength in US & EU banks instantly:
• Basket MA crossover signals (strong/medium/weak) with labels
• Always-active Volume + RSI confirmation (shows • dot on active stocks)
• Live table: 14 major banks (JPM, BAC, GS, INGA, HSBA etc.) with price, % change & signals
• Main chart MAs, buy/sell arrows, Bollinger Bands, Supply/Demand zones, high-volume alerts, USD trend arrows & index tracker
Perfect for trading bank stocks or indices. Add to any chart – clean, fast, reliable.
Try it now – completely basic-plan friendly!
Add this script to any chart (works best on bank stocks, XLF, EUFN or indices).
Key features you’ll see:
• Top-right table: lists all 14 banks with current price, daily % change, MA signal (S/M/W Buy/Sell) and white • dot when Volume+RSI confirms momentum.
• Chart labels: “Xs USs/EUs” etc. show basket strength + count of stocks with Vol/RSI signal.
• Green/blue lines = EU/US basket MAs.
• Standard MA cross buy/sell arrows, background color, BB, S/D zones, volume alerts & USD trend arrows all active by default.
“Note: white dot ⚪️ rsi in table has to be checked on it’s specific ticker chart for sell or buy rsi.”
This is a completely free invitation script. Everyone out there (probably the few who notice) is invited 🙂. Works with basic plan security call limits.
[The purpose of this scrip is most intended as a basic industry sector screener, it's not a multi layer confluence or price projection aid.
"Buy and Sell labels are only standard moving average theories and should not be taken as prompts alone".

Malama's DivergenceMalama's Divergence is a comprehensive momentum oscillator designed to filter noise and identify high-probability reversal points. It achieves this by unifying the Relative Strength Index (RSI) with advanced volatility and trend-following tools directly on the oscillator pane.
Why this is useful: Most traders look at RSI in isolation. Malama's Divergence adds context by applying tools normally reserved for price action (Bollinger Bands and Moving Averages) directly to the momentum line itself. This reveals "Momentum Squeezes" and "Momentum Trend Breaks" that standard RSI misses.
Key Features:
RSI Foundation: Dynamic color-coding highlights Overbought (>70) and Oversold (<30) conditions instantly.
Volatility Squeezes: Bollinger Bands wrapped around the RSI line turn orange when volatility compresses ("Squeeze"). This often precedes an explosive move in price.
Trend Confirmation: Fast and Slow Moving Averages on the RSI provide crossover signals to confirm if momentum is shifting, rather than just overextended.
Automated Divergence: The script automatically draws Regular Bullish and Bearish divergences, connecting price pivots with RSI pivots to spot market reversals.
How to Use:
Reversals: Look for "BULL DIV" or "BEAR DIV" labels. These indicate price is making a new extreme while momentum is failing to confirm it.
Breakouts: Watch for the Bollinger Bands on the RSI to squeeze (turn orange) and then expand as RSI breaks out of the bands.
Trend Entry: Use the MA Cross circles (Green/Red) as entry triggers in the direction of the dominant trend.
Settings:
MA Type: Select between EMA, Double EMA, or VIDYA (Adaptive) for the signal lines.
Divergence Lookback: Adjust the Pivot Left/Right bars to tune the sensitivity of divergence detection.
Disclaimer: Trading involves risk. This tool is for educational purposes only and should be used as part of a complete trading system.

Momentum Structure Breakout IndexMomentum Structure Breakout Index (MSBI) is a momentum-based reversal indicator designed to help traders identify when a trend is losing strength and a reversal may be approaching.
Instead of using RSI or EMA alone, MSBI combines:
✅RSI momentum
✅EMA trend direction
✅Divergence signals
✅Line intersections
✅By waiting for multiple conditions to align, MSBI reduces false signals and highlights high-probability reversal zones where momentum structure begins to shift.
✅This indicator works on any market and timeframe, making it suitable for scalping, day trading, and swing trading.
✨ Key Features
✅ RSI Divergence Detection
Identifies when price makes a new high/low but RSI fails to follow — a sign of weakening momentum.
✅ EMA Divergence Detection
Highlights loss of trend strength when EMA movement no longer supports price direction.
✅ RSI & EMA Intersection Signals
Intersections act as momentum confirmation points, signaling a potential structure break.
✅ Confluence-Based Signals
Best signals appear when divergence + intersection occur together.
✅ Clean & Visual
Designed for clarity without clutter, easy for beginners to read.
📘 How to Use MSBI (Step-by-Step)
🔄 Bullish Reversal Setup (Buy Example)
🔹Downtrend or Pullback
🔹Price is moving down or making lower lows.
🔹Bullish Divergence Appears
🔹Price makes a lower low
🔹RSI and/or EMA momentum makes a higher low
🔹Intersection Confirmation
🔹RSI momentum line intersects upward with EMA-based momentum line
Entry Idea
Enter long after confirmation
Stop loss below recent swing low
Targets at previous highs or resistance
📈 This setup suggests selling pressure is weakening and buyers may take control.
🔻 Bearish Reversal Setup (Sell Example)
🔹Uptrend or Rally
🔹Price is moving up or making higher highs.
🔹Bearish Divergence Appears
🔹Price makes a higher high
🔹RSI and/or EMA momentum makes a lower high
🔹Intersection Confirmation
🔹RSI momentum line intersects downward with EMA-based momentum line
Entry Idea
Enter short after confirmation
Stop loss above recent swing high
Targets at previous lows or support
📉 This setup signals momentum exhaustion and potential trend reversal.
⚠️ Trading Tips
🔹 Best used with market structure, support & resistance, or higher-timeframe bias
🔹 Avoid trading divergence alone — wait for intersection confirmation
🔹 Works especially well near key levels or range extremes

Zippo Traffic v3Zippo Traffic v3
Zippo Traffic v3 is an advanced trend-following system that analyzes price movements to determine market direction. Not only does it generate buy and sell signals, but it also highlights uncertain market periods with yellow bars, signaling when new positions should not be opened.
How It Works
This system operates on a traffic light principle:
🟡 Yellow Bars: Indicate market uncertainty – refrain from opening new positions and exercise caution if you are already in a trade.
🟢 Green Bars: Signal a Long/Buy – indicating an uptrend.
🔴 Red Bars: Signal a Short/Sell – indicating a downtrend.
The Alligator (3 EMA) parameters (JawLen, TeethLen, LipsLen) are the only inputs that users can modify; all other technical indicators and calculations are fixed. This minimizes the risk of over-optimization and false signals, preserving the system’s core methodology.
Key Features
Neutral Zones: Unlike conventional trend-following indicators that only provide buy and sell signals, this indicator also identifies neutral areas (yellow bars) in the market.
Momentum + Trend Analysis: It combines multiple criteria to more accurately analyze the market direction.
Standard Price Data: All calculations are based on standard OHLC values. While Heikin Ashi or other candlestick styles may be used solely for enhanced visual clarity, they do not affect signal generation.
How to Use
🟢 Green Bars: Indicate a strong uptrend (Long).
🔴 Red Bars: Indicate a downtrend (Short).
🟡 Yellow Bars: Represent uncertain market conditions; avoid opening new positions during these periods.
Timeframe and Usage Recommendations
Signal quality may be poor in low-volume or illiquid securities.
For optimal results, it is recommended to use timeframes of 30 minutes or higher.
It has proven particularly effective on 4-hour, 8-hour, and daily charts.
Although it can be applied to shorter timeframes, increased price volatility may reduce signal accuracy.
Important Notice
This indicator is developed solely for technical analysis purposes and does not constitute investment advice. Market conditions can change rapidly— even a single candle can break through support or resistance levels. Yellow bars indicate that you should close your existing position and wait, or monitor for trend clarification, but do not necessarily signal an imminent trend reversal. All investment decisions should be made based on your own research and risk management strategies.

ZeroProfit_Trading_Inc - Black Asp Strategy V1.0WMA/RSI/MACD combined in one for a good lower (1/2 min) time frame chart, either follow the signals manually or automate the trades and relax. Has opening range as well as previous day/week/month high and lows.

S&P Discipline SystemS&P Discipline System - User Guide By Macro-Guy
Welcome to the S&P Discipline System. This indicator is designed to enforce trading discipline, help you avoid "chasing" the market, and ensure you only trade when high-probability conditions align.
Follow me (Macro-Guy) on TradingView for script updates and market insights.
WHAT THIS INDICATOR DOES
Session Filtering: Identifies optimal US trading hours (Blue Tint).
Entry Zones: Signals pullbacks to the 21-period Moving Average (Yellow Line).
Short Protection: A built-in filter to stop you from shorting into "oversold" or "strong trend" conditions.
Risk Management: Provides ATR-based and Swing-based stop loss levels.
QUICK START GUIDE
Apply to Chart: Best used on SPX, SPY, ES, or US500.
Check the Status Table: Located in the top-right.
Green Action: Good to go.
Red Action: Stay out/Wait.
Wait for Signals:
Green "BUY ZONE": Look for long entries.
Red "SHORT ZONE": Look for short entries.
Muted Labels: Setup is forming but it is currently outside US Session hours.
UNDERSTANDING THE VISUALS Background Colors:
Light Green: Bullish trend; favor longs.
Light Red: Bearish trend; shorts permitted.
Gray: Choppy market; exercise caution.
Blue Tint: Active US trading session.
Orange Tint: Outside US hours (Observe only).
Moving Averages:
Yellow (21 MA): The primary entry zone for pullbacks.
Blue (50 MA): Intermediate trend filter.
White (200 MA): Major institutional trend direction.
THE SHORT FILTER (IMPORTANT) To prevent "shorting the bottom," the indicator only permits shorts when:
Price is below the 50 MA.
The 21 MA and 50 MA are both sloping down.
RSI is between 45-65. If the table says "NO SHORTS," do not fight the algorithm.
HOW TO TRADE THE SYSTEM For Longs:
Wait for Green background (Bullish).
Price must pull back to the Yellow 21 MA line.
"BUY ZONE" label must appear during the US Session (Blue tint).
Enter Long. Place stop at the Red Circle or Orange Cross.
For Shorts:
Wait for Red background (Bearish).
Price must bounce up to the Yellow 21 MA line.
Table must show "SHORTS OK" in green.
Enter Short. Place stop at the Red Circle or Orange Cross.
SETTING UP ALERTS
Right-click chart > Add Alert.
Select S&P Discipline System as the condition.
Choose: Buy Zone - US Session or Short Zone - US Session.
DISCLAIMER This indicator is a tool to assist with discipline and timing. It does not guarantee profits. Always manage your risk and never trade more than you can afford to lose. Past performance does not guarantee future results.
Happy Trading!

Simple VWMA Smooth | QuantEdgeBSimple VWMA Smooth (SVS) | QuantEdgeB
🔍 What Is Simple VWMA Smooth?
SVS is a smoothed, volume-aware trend filter that blends a Gaussian-pre-filtered, low-lag moving average with dynamic standard-deviation bands. It identifies trends by measuring when price moves decisively above or below a VWMA (Volume-Weighted Moving Average) baseline—filtering out noise while letting high-volume moves carry more influence than low-volume noise.
⚙️ Core Components
1) DEMA Pre-Filter
A double-EMA smoothing step to reduce initial noise before further processing.
2) Gaussian Smoothing
Applies a small-kernel Gaussian filter to produce a cleaner input series that suppresses rapid spikes.
3) VWMA Baseline (Volume-Weighted Average)
Computes a moving average where each bar is weighted by volume, so the baseline tracks “meaningful” price moves more than low-liquidity fluctuations.
• In high volume → the baseline reacts more to those candles
• In low volume → price changes have less impact
4) Volatility Bands
Surrounds the VWMA line with ± N × SD bands (separate multipliers for upper and lower) to capture current market volatility, creating dynamic thresholds for trend detection.
5) Trend Signal
• Long when price closes above the upper band
• Short when price closes below the lower band
• Otherwise neutral
💡 Why It’s Special
• Volume-Validated Responsiveness: VWMA prioritizes moves backed by volume, helping reduce signals caused by thin-market noise.
• Multi-Stage Filtering: The DEMA → Gaussian → VWMA sequence suppresses noise while keeping trend structure clear.
• Asymmetric Bands: Separate multipliers for upper/lower bands let you tune bullish vs bearish sensitivity independently.
• Visual Clarity: Color-coded candles and filled bands highlight trending phases at a glance, while backtest tables quantify performance.
📊 Backtest Mode
SVS includes an optional backtest table, enabling traders to assess historical effectiveness before using it live.
Backtest Metrics Displayed:
• Equity Max Drawdown
• Profit Factor
• Sharpe Ratio
• Sortino Ratio
• Omega Ratio
• Half Kelly
• Total Trades & Win Rate
💼 Ideal Use Cases
• Trend Identification: Spot cleaner trend starts/exits across stocks, FX, or crypto with reduced lag and fewer false breakouts.
• Volume Regimes: Helps distinguish “real” moves (high participation) from weak moves (low participation).
• Multitimeframe Alignment: Confirm direction across timeframes before entries.
• System Building Block: Use as a volume-aware filter inside broader strategies.
🎨 Default Configuration
• DEMA Length: 7
• Gaussian Kernel: length = 4, sigma = 2.0
• VWMA Length: 14
• Volatility Bands: SD length = 40
📌 In Summary
Simple VWMA Smooth | QuantEdgeB is a volume-weighted, noise-suppressed trend filter that combines DEMA smoothing, Gaussian filtering, a VWMA baseline, and dynamic SD bands to separate genuine directional moves from market noise—across any asset or timeframe.
🔹 Disclaimer : Past performance is not indicative of future results. Always backtest and align settings with your risk tolerance and objectives before live trading.
🔹 Strategic Advice : Always backtest, optimize, and align parameters with your trading objectives and risk tolerance before live trading.

Stage Analysis & MinerviniScript with Stage Analysis and Minervini set data set ups
Candle stick colors:
Lime - Green candle with volume > 50day moving avg vol - Bullish
Yellow - Red or green candle with wick with volume > 50day moving avg vol - Bearish
Black - indecisive candle with volume
Table has the moving averages, ATR, ADR, minervini set ups.
Swing highs and swing lows are printed to identify the latest stop loss markers for swing traders who follow Stan Weinstein stage analysis method of stop loss management
Volume labels and markers are present in the candle if applicable.

Rapid Signal GeometryMechanism Explained (Simple & Practical)
1. Fair Value Baseline
A smoothed moving average (RMA) is used to represent price equilibrium. This baseline filters noise and avoids reacting to minor fluctuations.
2. Volatility Envelope
ATR or Standard Deviation (user selectable) defines how far price must move away from equilibrium to be considered meaningful. This adaptive range expands and contracts with market conditions.
3. Regime Shift Detection
A bullish regime is confirmed when price decisively breaks above the upper volatility boundary.
A bearish regime is confirmed when price decisively breaks below the lower volatility boundary.
The logic resets on every candle — there is no trailing or repainting behaviour.
4. Signal Candle Geometry
On the first candle of a new regime, RSG draws two short horizontal guides:
• 50% Body Level
The midpoint of the signal candle’s body, representing balance within the impulse.
• Projected Wick Level
A mirrored wick projection calculated from the candle’s close:
– Bullish signal: upper wick distance projected downward
– Bearish signal: lower wick distance projected upward
These levels provide a geometric framework for execution planning.
Signals & Alerts
• Buy signal prints only on the first confirmed bullish regime
• Sell signal prints only on the first confirmed bearish regime
• No repeated signals during the same trend
Alert options include:
• Buy only
• Sell only
• Combined Buy/Sell
All alerts are bar-close confirmed.
How to Use Rapid Signal Geometry
RSG is best used as an execution aid, not a standalone strategy.
Common use cases:
• Refining entries after a confirmed directional bias
• Identifying pullback or reaction zones on signal candles
• Aligning discretionary entries with volatility-aware structure
• Complementing higher-timeframe analysis or session-based strategies
The geometric levels are reference points — traders should always apply their own risk management.
Recommended Timeframes
RSG performs best on:
• 15-minute
• 1-hour
These timeframes provide a strong balance between signal clarity and noise reduction.
Lower timeframes may produce more frequent regime changes, while higher timeframes offer fewer but broader signals.
Important Notes
• This indicator does not predict future price movement
• Signals are not trade recommendations
• Designed for educational and analytical purposes
• Always combine with your own market context and risk rules
Summary
Rapid Signal Geometry focuses on one thing only:
revealing the internal geometry of decisive market moments .
By combining volatility-aware regime detection with precise candle-level reference marks, RSG offers a clean and disciplined approach to execution-focused chart analysis.

Instant Start EMA RibbonHave you noticed that EMAs on Tradingview start to appear on chart after the number of candles required by the EMA has fulfilled?
Example, 200 EMA shows up only when 200 candles have been printed on the canvas irrespective of the timeframe.
You might also have noticed that in some other charting software, the EMAs start from the very first candle of the instrument/asset class, a good example is a newly listed stock. And then the EMA automatically aligns itself once the amount of candles required by the EMA is fulfilled.
So if you want similar behavior of EMAs on Tradingview, you can use this "Instant Start EMA Ribbon" specifically coded in Pinescript to exactly and accurately mimic the behavior of EMAs like the other software. You can check that EMAs with this custom indicator start from the very first candles after listing of the instrument/asset class. This indicator will optimize the EMAs and work as a normal EMA once the amount of candles required are fulfilled, until then, it will use custom parameters to calculate the EMAs (that is the available current candle data).
Tip: You can change the values and colors of EMAs from the indicator settings.
Disclaimer/Warning: This indicator does not provide Buy/Sell signals or nor is an investment advice. This indicator solely for the purpose of study of price and Exponential Moving Averages. Users are responsible for their own actions, profit/loss of the users is not the liability of author.

Peace of Mind Trader: MA Trend SystemPeace of Mind Trader: MA Trend System
ระบบนี้ถูกออกแบบมาเพื่อให้การดูเทรนด์เป็นเรื่องง่ายและ "สบายใจ" ที่สุด (Peace of Mind) โดยลดความซับซ้อนของการตีเส้นกราฟ ช่วยให้คุณโฟกัสกับภาพใหญ่ของตลาดได้ทันที ด้วยหลักการ EMA Cross ที่เรียบง่ายแต่ทรงพลัง
ฟีเจอร์หลัก:
- Trend Ribbon (แถบสีบอกเทรนด์): แสดงพื้นที่ระบายสีระหว่างเส้น EMA สองเส้น เปลี่ยนสีเขียว/แดงตามแนวโน้ม ช่วยให้มองแวบเดียวก็รู้ว่าตลาดเป็นขาขึ้นหรือขาลง
- สัญญาณซื้อขายที่ชัดเจน:
ขึ้นป้าย "🟢 BULL" เมื่อเริ่มเข้าสู่เทรนด์ขาขึ้น
ขึ้นป้าย "🔴 BEAR" เมื่อเริ่มเข้าสู่เทรนด์ขาลง
- พิเศษ: มีฟังก์ชัน "Show Signal History" สามารถเลือกปิดประวัติเก่าๆ เพื่อให้โชว์แค่ "สัญญาณล่าสุด" เพียงอันเดียวได้ (ทำให้กราฟสะอาดตามาก)
- Dashboard สถานะ: ตารางสรุปมุมขวาล่าง (ปรับตำแหน่งได้) บอกสถานะปัจจุบันทันทีว่าควร Buy หรือ Sell
- เปลี่ยนสีแท่งเทียนอัตโนมัติ: ระบบจะย้อมสีแท่งเทียนให้เป็นสีเขียว/แดงตามเทรนด์ เพื่อลดความสับสนช่วงที่กราฟย่อตัว
วิธีใช้งาน:
🟢 โซนสีเขียว: โฟกัสหน้า Buy หรือถือรันเทรนด์ต่อไป
🔴 โซนสีแดง: โฟกัสหน้า Sell หรือถือเงินสดรอจังหวะ
การตั้งค่า: สามารถปรับค่า EMA และสีต่างๆ ได้ตามสไตล์การเทรดของคุณ
ขอให้มีความสุขกับการเทรดแบบ Peace of Mind ครับ
พีร์ Peace of Mind Trader
-------------
English Description
Peace of Mind Trader: MA Trend System
This indicator is designed to simplify your trading routine by visualizing the market trend clearly and effectively. Built on the classic logic of Moving Average crossovers (EMA), it helps you stay on the right side of the market without the noise.
Key Features:
Trend Ribbon: A visual fill between the Fast and Slow EMA that changes color based on the trend (Green for Bullish, Red for Bearish). This makes it easy to spot the strength and direction of the trend at a glance.
Clear Buy/Sell Signals:
Displays "🟢 BULL" labels when the Fast EMA crosses above the Slow EMA.
Displays "🔴 BEAR" labels when the Fast EMA crosses below the Slow EMA.
New Feature: You can toggle "Show Signal History". Uncheck this option to keep your chart clean by showing only the latest active signal.
Status Dashboard: A customizable panel on the chart (position adjustable) that tells you the current market status immediately (BULL or BEAR).
Trend-Colored Candles: Automatically colors the candlesticks to match the trend, helping you filter out noise during corrections.
How to Use:
Green Zone (Bullish): Look for buying opportunities or hold your position (Run Trend).
Red Zone (Bearish): Look for selling opportunities or stay in cash.
Settings: You can adjust the EMA lengths and all visual colors to fit your personal trading style.
Trade with Logic, Profit with Peace.

Signals, Emas Bahena Indicator: Emas Bahena Signals
This indicator uses three Exponential Moving Averages (EMAs) to identify buy and sell entries based on crossovers and trend.
🔹 EMAs used
EMA 9 → fast (signals)
EMA 21 → intermediate (confirmation)
EMA 85 → slow (main trend)
🟢 BUY Signal
Generated when:
The EMA 9 crosses above the EMA 21
The EMA 9 is above the EMA 85 ➡️ Indicates the start of an uptrend
🔴 SELL Signal
Generated when:
The EMA 9 crosses below the EMA 21
The EMA 9 is below the EMA 85 ➡️ Indicates the start of a downtrend
📌 Visualization
EMAs drawn on the chart
BUY arrow below the price
SELL arrow above the price
Compatible with TradingView alerts
⚠️ Recommendation
Works best in trending markets and on medium and high timeframes (15m, 1H, 4H)

Ultimate Pattern Engine - Elite Suite v54Here's the description I wrote for your Pine Script publication:
Ultimate Pattern Engine - Elite Suite v54
A comprehensive technical analysis tool combining multiple pattern recognition algorithms and indicators in one powerful suite.
Pattern Recognition:
Head & Shoulders patterns with automatic neckline detection
Bull and Bear flag formations
9-count sequential patterns
Breakout pattern detection with alerts
Support/Resistance zones with dynamic S/R levels
Reversal cloud visualization
Moving Averages:
Multiple Simple Moving Averages (SMA) - 9, 50, 200 periods
Exponential Moving Averages (EMA) with customizable lengths
Color-coded for easy trend identification
Visual Features:
Pattern fill areas for clear visualization
Breakout labels showing price action
Customizable color schemes (bullish green, bearish red, neutral gray)
H&S neckline highlighting
Volume multiplier analysis
Configuration:
Adjustable sensitivity and flatness thresholds
Toggle individual patterns on/off
Customizable moving average periods and colors
Full control over visual elements
Ideal for traders looking to identify key chart patterns, trend reversals, and breakout opportunities across all timeframes.

Neural Trend Engine [JOAT]Neural Trend Engine - Multi-Layer Adaptive Trend Detection
Neural Trend Engine uses a multi-layer filtering approach inspired by neural network concepts. It combines multiple adaptive moving averages with proprietary momentum and volatility weighting to generate trend signals with reduced lag and improved confidence scoring.
Why This Script is Protected
This script is published as closed-source to protect the proprietary signal composition algorithm and the specific weighting methodology from unauthorized republishing. The unique combination of adaptive layer calculations, momentum normalization, and volatility integration represents original work that goes beyond standard indicator implementations.
What Makes This Indicator Unique
Unlike simple moving average crossover systems, Neural Trend Engine:
Uses three Kaufman Adaptive Moving Averages (KAMA) that automatically adjust their smoothing based on market efficiency
Combines layer alignment, momentum, and volatility into a single "neural signal"
Provides signal strength percentages so you know the conviction level of each signal
Creates a visual trend cloud that makes direction immediately obvious
What This Indicator Does
Plots three adaptive moving average "layers" that respond dynamically to market efficiency
Creates a trend cloud between fast and slow layers for visual trend identification
Generates weighted composite signals from layer alignment, momentum, and volatility
Displays buy/sell labels with signal strength percentages
Provides a comprehensive dashboard with multi-component breakdown
Colors the neural line and cloud based on current trend direction
Core Methodology
The indicator employs a three-layer adaptive system where each layer responds to market conditions at different speeds:
Fast Layer (default: 8) — Quick response for short-term direction changes
Medium Layer (default: 21) — Intermediate trend reference
Slow Layer (default: 55) — Long-term trend anchor
Each layer uses efficiency-based adaptation, meaning they become more responsive during trending conditions and smoother during choppy markets.
The neural signal is a proprietary composite that weighs three distinct market components:
Momentum Component (default: 40%) — Measures directional price velocity, normalized to its recent range
Trend Component (default: 35%) — Evaluates alignment between the three adaptive layers
Volatility Component (default: 25%) — Incorporates market volatility state into signal generation
These components are combined using a weighted formula that has been calibrated to balance responsiveness with noise reduction.
Signal Generation
Direction changes occur when the smoothed neural signal crosses a configurable strength threshold:
Bullish — Signal exceeds positive threshold with layer alignment confirmation
Bearish — Signal drops below negative threshold with layer alignment confirmation
Neutral — Signal remains within threshold range, indicating consolidation
Signal strength percentages indicate the conviction level of each signal, helping traders assess trade quality. Higher percentages suggest stronger trend conviction.
Visual Features
Trend Cloud — Filled area between fast and slow layers, colored by trend direction
Neural Line with Glow — Weighted average of all three layers with glow effect
Medium Layer — Subtle white line showing intermediate trend
Signal Labels — BUY/SELL labels with strength percentages at signal points
Small Markers — Alternative triangle markers when labels are disabled
Color Scheme
Bullish Color — Default: #26A69A (teal green) — Used for bullish trends and signals
Bearish Color — Default: #EF5350 (red) — Used for bearish trends and signals
Cloud Fill — 85% transparent version of trend color
Neural Line Glow — 60% transparent version for glow effect
Dashboard Information
The on-chart table (top-right corner) displays:
Current direction (BULLISH, BEARISH, or NEUTRAL)
Neural signal percentage
Layer alignment status (ALIGNED UP, ALIGNED DOWN, or MIXED)
Momentum direction and percentage
Trend strength percentage
Inputs Overview
Neural Layers:
Fast Layer — Period for fast adaptive MA (default: 8, range: 2-50)
Medium Layer — Period for medium adaptive MA (default: 21, range: 5-100)
Slow Layer — Period for slow adaptive MA (default: 55, range: 10-200)
Source — Price source for calculations (default: close)
Sensitivity:
Momentum Weight — Weight for momentum component (default: 0.4)
Trend Weight — Weight for trend/layer alignment (default: 0.35)
Volatility Weight — Weight for volatility component (default: 0.25)
ATR Period — Period for volatility calculations (default: 14)
Visual Settings:
Bullish/Bearish Colors — Customizable color scheme
Show Trend Cloud — Toggle the filled cloud area
Show Signal Labels — Toggle BUY/SELL labels with percentages
Show Neural Line — Toggle the main trend line
Show Dashboard — Toggle the information table
Alerts:
Await Bar Confirmation — Wait for bar close before triggering (recommended)
Min Signal Strength — Threshold for direction changes (default: 0.3 = 30%)
How to Use It
For Trend Following:
Follow the trend cloud color for overall market direction
Enter long when cloud turns bullish (teal) and signal strength is high
Enter short when cloud turns bearish (red) and signal strength is high
Use the neural line as a trailing stop reference
For Signal Trading:
Wait for BUY/SELL labels to appear
Check the signal strength percentage—higher is better
Confirm with dashboard showing aligned layers
Avoid signals during MIXED layer alignment
For Confirmation:
Use Neural Trend Engine to confirm signals from other systems
Strong confirmation when all three layers are aligned
Dashboard shows momentum and trend strength for additional context
Alerts Available
NTE Buy Signal — Bullish direction change detected
NTE Sell Signal — Bearish direction change detected
NTE Direction Change — Any trend direction change
Best Practices
Higher signal strength percentages indicate more reliable signals
Wait for layer alignment (shown in dashboard) before entering trades
Use on higher timeframes for more reliable trend identification
Combine with support/resistance levels for entry timing
This indicator is provided for educational purposes. It does not constitute financial advice. Past performance does not guarantee future results. Always conduct your own analysis and use proper risk management before making trading decisions.
— Made with passion by officialjackofalltrades

[STRATEGY] Adaptive Multi Factor Trend Trading v1.1Daily Filters
Close vs. short/long daily SMAs (customizable) defines directional priority.
Use the daily Short Long MA spread (or ATR‑normalized) to filter out range‑bound conditions and reduce false breakouts.
30‑Minute Entry Logic
Buy
Daily bullish regime confirmed
High breaks above the trend
Protected by trailing take‑profit and fixed stop‑loss.
Sell #1
Daily bearish regime confirmed
Low breaks below the trend
Long MA slope must be strong (trend‑quality filter).
Sell #2
Day‑session only, limited to high‑probability hours
Triggered by an aggregated bear score (multi‑factor stack) + a downward linear‑regression slope
Friday uses special thresholds/intervals (event‑risk control).
Multi‑Factor Framework
MACD, RSI, Stoch (KD), Ichimoku, CCI, PSAR, Williams %R, Heikin Ashi, Bias, Force Index, plus regression‑slope.
Signals are stacked into bull/bear totals and used as filters or weights—no single indicator dominance.
Risk & Position Management
Fixed TP/SL + trailing TP across entry types
Position size adapts to recent performance (loss‑streak counter) and slope state
Auto pause when the loss streak hits the threshold (configurable duration).
Trading‑Day Controls
Optional pre‑holiday blackout list
Date‑range limiter for backtests or deployment windows.
Design Intent
The goal is to keep net P&L stable while lifting win rate.
In strong‑trend environments, the system leans into trend signals (Sell #1 / Buy).
In short‑term chop, Sell #2 timing and the slope filter reduce noise and avoid low‑quality entries.
Scaled SMAs + Bollinger BandsScales another symbol's SMAs to the price of the symbol on the chart you are trading.

FL Core Signals Only 4AM 4PMFL Core – Signals Only is a confirmation-based trading indicator designed to highlight structured entry and exit points during active market hours.
This script is not predictive and does not generate trade recommendations. It provides visual confirmation only after conditions are met and candles are closed.
Core characteristics:
• Signals are limited to 4:00 AM – 4:00 PM (exchange time)
• Designed for lower timeframes (1–5 minute charts)
• No indicator clutter — entries, exits, and profit target references only
• Logic is based on trend alignment and momentum confirmation
• Customizable profit target distances for different instruments
This indicator is intended for experienced traders who already understand risk management and execution. Users are responsible for their own trade decisions.
This is not an indicator you trade into.
It is a confirmation system you wait for.
Past performance does not guarantee future results.

SMC Confluence Suite [Pure Score Alerts]🚀 The Missing Link in SMC Trading: Timing & Confluence
Knowing "Where" to trade (Order Blocks/FVG) is only half the battle. Knowing "When" to pull the trigger is what separates amateurs from professionals.
The SMC Confluence Suite is a sophisticated Market Scoring Engine designed to validate your trade setups. It acts as a "Market Weather Station," analyzing Structure, Momentum, Extension, and Volatility in real-time to generate a single Confidence Score (0-100).
🧠 How It Works (The Logic)
This indicator processes 5 key dimensions to calculate a Long and Short Score:
Structure: Is the trend Bullish, Bearish, or in a Pullback?
Momentum: Analyzes RSI and divergence (Bull/Bear Div).
Extension (The Dux Logic): Detects if price is "Parabolic" (Overheated) or at a "Discount". It prevents FOMO buying at the top.
Rotation: Analyzes Volume Churn. Is the volume supporting the move, or is it stalling (distribution)?
Mood: A synthesis of market sentiment (Greed vs. Fear).
📊 The Dashboard
Long/Short Score:
> 80 (Aggressive 🚀): Market is priming for a strong move (Setup B / Unicorn).
60 - 80 (Standard ✅): Healthy trend, safe for Pullbacks (Setup C / Golden Swing).
< 40 (No Entry ⛔): Weak market or dangerous conditions.
Warning Flags:
PARABOLIC 🔥: Price moved too fast. Score resets to 0 to prevent chasing.
HIGH CHURN 🌪️: High volume but no price movement. Potential reversal.
✨ Key Features in V8.1
Score Trace (History): See historical scores printed directly on the chart (above/below candles). This allows you to backtest: "Did my winning trade have a high score?"
Asset Modes: optimized settings for Crypto, Stocks, and Metals (Gold/Silver).
Pure Alerts: Simplified alert system. Get notified only when Score > 80 (The "Sniper" moment).
💡 How to Trade (The Strategy)
Use this script alongside an SMC Structure indicator (like the SMC Strategy Companion).
Setup B (Breakout): Requires Score > 80 + High Volatility.
Setup C (Pullback): Requires Score > 60 + No "Parabolic" warning.
Kill Switch: If the Dashboard shows "PARABOLIC" or "CHURN", cancel all entries immediately.


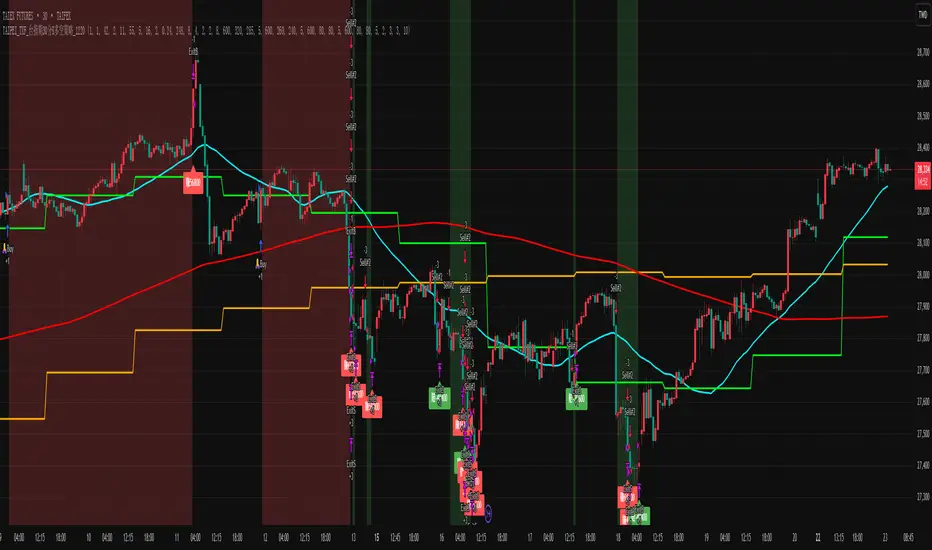
Su Shen Comprehensive Trading System V2.0Su Shen Comprehensive Trading System V2.0
Su Shen Comprehensive Trading System is an intelligent trading assistant indicator that integrates multiple technical analysis tools. This system provides a comprehensive market perspective by combining multi-timeframe trend analysis, key level identification, and intelligent trading signals.
Core Features
Multi-dimensional Trend Analysis: Analyzes market trends across multiple timeframes simultaneously
Intelligent Trading Signals: Automatically identifies potential entry, take-profit, and exit opportunities
Key Level Identification: Marks important support and resistance zones
Risk Alerts: Indicates current risk level based on market conditions
Applicable Scenarios
Day trading
Swing trading
Trend following
How to Use
After adding the indicator to your chart, the system will automatically display analysis results and trading signals. Users can refer to these signals in conjunction with their own trading strategies.
