Adaptive ATR% Grid + SuperTrend + OrderFlipDescription:
This indicator combines multiple technical analysis tools to identify key price levels and trading signals:
ATR% Grid – automatic plotting of support and resistance levels based on current price and volatility (ATR). Useful for identifying potential targets and entry/exit zones.
SuperTrend – a classic trend indicator with an adaptive ATR multiplier that adjusts based on average volatility.
OrderFlip – identifies price reversal points relative to a moving average with ATR-based sensitivity, optionally filtered by OBV and DMI.
MTF Confirmation – multi-timeframe trend verification using EMA to reduce false signals.
Signal Labels – "LONG" and "SHORT" labels appear on the chart with an offset from the price for better visibility.
JSON Alerts – ready-to-use format for automated alerts, including price, SuperTrend direction, Fair Zone, and ATR%.
Features:
Fully compatible with Pine Script v6
Lines and signals are fixed on the chart, do not shift with new bars
Configurable grid, ATR, SuperTrend, and filter parameters
Works with MTF analysis and classic indicators (OBV/DMI)
Usage:
Best used with additional indicators and risk management strategies. ATR% Grid is ideal for both positional trading and intraday setups.
перевод на русский
Описание:
Этот индикатор объединяет несколько методов технического анализа для выявления ключевых уровней цены и сигналов на покупку/продажу:
Сетка ATR% (ATR% Grid) – автоматическое построение уровней поддержки и сопротивления на основе текущей цены и волатильности (ATR). Позволяет видеть потенциальные цели и зоны входа/выхода.
SuperTrend – классический трендовый индикатор с адаптивным множителем ATR, который корректируется на основе средней волатильности.
OrderFlip – определение моментов разворота цены относительно скользящей средней с учетом ATR, с возможностью фильтрации по OBV и DMI.
MTF-подтверждение – проверка направления тренда на нескольких таймфреймах с помощью EMA, чтобы снизить ложные сигналы.
Сигнальные метки – на графике появляются "LONG" и "SHORT" с отступом от цены для наглядности.
JSON Alerts – готовый формат для автоматических уведомлений, включающий цену, направление SuperTrend, Fair Zone и ATR%.
Особенности:
Поддержка Pine Script v6
Линии и сигналы закреплены на графике, не двигаются при обновлении свечей
Настраиваемые параметры сетки, ATR, SuperTrend и фильтров
Совместимость с MTF-анализом и классическими индикаторами OBV/DMI
Рекомендации:
Используйте в сочетании с другими индикаторами и стратегиями управления риском. Сетка ATR% отлично подходит для позиционной торговли и интрадей.
ATR% Grid – automatic plotting of support and resistance levels based on current price and volatility (ATR). Useful for identifying potential targets and entry/exit zones.
SuperTrend – a classic trend indicator with an adaptive ATR multiplier that adjusts based on average volatility.
Mtf

TrendDetectorLibLibrary "TrendDetector_Lib"
method formatTF(timeframe)
Namespace types: series string, simple string, input string, const string
Parameters:
timeframe (string) : (string) The timeframe to convert (e.g., "15", "60", "240").
Returns: (string) The formatted timeframe (e.g., "15M", "1H", "4H").
f_ma(type, src, len)
Computes a Moving Average value based on type and length.
Parameters:
type (simple string) : (string) One of: "SMA", "EMA", "RMA", "WMA", "VWMA".
src (float) : (series float) Source series for MA (e.g., close).
len (simple int) : (simple int) Length of the MA.
Returns: (float) The computed MA series.
render(tbl, trendDetectorSwitch, frameColor, frameWidth, borderColor, borderWidth, textColor, ma1ShowTrendData, ma1Timeframe, ma1Value, ma2ShowTrendData, ma2Timeframe, ma2Value, ma3ShowTrendData, ma3Timeframe, ma3Value)
Fills the provided table with Trend Detector contents.
@desc This renderer does NOT plot and does NOT create tables; call from indicator after your table exists.
Parameters:
tbl (table) : (table) Existing table to render into.
trendDetectorSwitch (bool) : (bool) Master toggle to draw the table content.
frameColor (color) : (color) Table frame color.
frameWidth (int) : (int) Table frame width (0–5).
borderColor (color) : (color) Table border color.
borderWidth (int) : (int) Table border width (0–5).
textColor (color) : (color) Table text color.
ma1ShowTrendData (bool) : (bool) Show MA #1 in table.
ma1Timeframe (simple string) : (string) MA #1 timeframe.
ma1Value (float)
ma2ShowTrendData (bool) : (bool) Show MA #2 in table.
ma2Timeframe (simple string) : (string) MA #2 timeframe.
ma2Value (float)
ma3ShowTrendData (bool) : (bool) Show MA #3 in table.
ma3Timeframe (simple string) : (string) MA #3 timeframe.
ma3Value (float)

lower_tfLibrary "lower_tf"
█ OVERVIEW
This library is an enhanced (opinionated) version of the library originally developed by PineCoders contained in lower_tf .
It is a Pine Script® programming tool for advanced lower-timeframe selection and intra-bar analysis.
█ CONCEPTS
Lower Timeframe Analysis
Lower timeframe analysis refers to the analysis of price action and market microstructure using data from timeframes shorter than the current chart period. This technique allows traders and analysts to gain deeper insights into market dynamics, volume distribution, and the price movements occurring within each bar on the chart. In Pine Script®, the request.security_lower_tf() function allows this analysis by accessing intrabar data.
The library provides a comprehensive set of functions for accurate mapping of lower timeframes, dynamic precision control, and optimized historical coverage using request.security_lower_tf().
█ IMPROVEMENTS
The original library implemented ten precision levels. This enhanced version extends that to twelve levels, adding two ultra-high-precision options:
Coverage-Based Precision (Original 5 levels):
1. "Covering most chart bars (least precise)"
2. "Covering some chart bars (less precise)"
3. "Covering fewer chart bars (more precise)"
4. "Covering few chart bars (very precise)"
5. "Covering the least chart bars (most precise)"
Intrabar-Count-Based Precision (Expanded from 5 to 7 levels):
6. "~12 intrabars per chart bar"
7. "~24 intrabars per chart bar"
8. "~50 intrabars per chart bar"
9. "~100 intrabars per chart bar"
10. "~250 intrabars per chart bar"
11. "~500 intrabars per chart bar" ← NEW
12. "~1000 intrabars per chart bar" ← NEW
The key enhancements in this version include:
1. Extended Precision Range: Adds two ultra-high-precision levels (~500 and ~1000 intrabars) for advanced microstructure analysis requiring maximum granularity.
2. Market-Agnostic Implementation: Eliminates the distinction between crypto/forex and traditional markets, removing the mktFactor variable in favor of a unified, predictable approach across all asset classes.
3. Explicit Precision Mapping: Completely refactors the timeframe selection logic using native Pine Script® timeframe properties ( timeframe.isseconds , timeframe.isminutes , timeframe.isdaily , timeframe.isweekly , timeframe.ismonthly ) and explicit multiplier-based lookup tables. The original library used minute-based calculations with market-dependent conditionals that produced inconsistent results. This version provides deterministic, predictable mappings for every chart timeframe, ensuring consistent precision behavior regardless of asset type or market hours.
An example of the differences can be seen side-by-side in the chart below, where the original library is on the left and the enhanced version is on the right:
█ USAGE EXAMPLE
// This Pine Script® code is subject to the terms of the Mozilla Public License 2.0 at mozilla.org
// © andre_007
//@version=6
indicator("lower_tf Example")
import andre_007/lower_tf/1 as LTF
import PineCoders/Time/5 as PCtime
//#region ———————————————————— Example code
// ————— Constants
color WHITE = color.white
color GRAY = color.gray
string LTF1 = "Covering most chart bars (least precise)"
string LTF2 = "Covering some chart bars (less precise)"
string LTF3 = "Covering less chart bars (more precise)"
string LTF4 = "Covering few chart bars (very precise)"
string LTF5 = "Covering the least chart bars (most precise)"
string LTF6 = "~12 intrabars per chart bar"
string LTF7 = "~24 intrabars per chart bar"
string LTF8 = "~50 intrabars per chart bar"
string LTF9 = "~100 intrabars per chart bar"
string LTF10 = "~250 intrabars per chart bar"
string LTF11 = "~500 intrabars per chart bar"
string LTF12 = "~1000 intrabars per chart bar"
string TT_LTF = "This selection determines the approximate number of intrabars analyzed per chart bar. Higher numbers of
intrabars produce more granular data at the cost of less historical bar coverage, because the maximum number of
available intrabars is 200K.
The first five options set the lower timeframe based on a specified relative level of chart bar coverage.
The last five options set the lower timeframe based on an approximate number of intrabars per chart bar."
string TAB_TXT = "Uses intrabars at the {0} timeframe. Avg intrabars per chart bar:
{1,number,#.#} Chart bars covered: {2} of {3} ({4,number,#.##}%)"
string ERR_TXT = "No intrabar information exists at the {1}{0}{1} timeframe."
// ————— Inputs
string ltfModeInput = input.string(LTF3, "Intrabar precision", options = , tooltip = TT_LTF)
bool showInfoBoxInput = input.bool(true, "Show information box ")
string infoBoxSizeInput = input.string("normal", "Size ", inline = "01", options = )
string infoBoxYPosInput = input.string("bottom", "↕", inline = "01", options = )
string infoBoxXPosInput = input.string("right", "↔", inline = "01", options = )
color infoBoxColorInput = input.color(GRAY, "", inline = "01")
color infoBoxTxtColorInput = input.color(WHITE, "T", inline = "01")
// ————— Calculations
// @variable A "string" representing the lower timeframe for the data request.
// NOTE:
// This line is a good example where using `var` in the declaration can improve a script's performance.
// By using `var` here, the script calls `ltf()` only once, on the dataset's first bar, instead of redundantly
// evaluating unchanging strings on every bar. We only need one evaluation of this function because the selected
// timeframe does not change across bars in this script.
var string ltfString = LTF.ltf(ltfModeInput, LTF1, LTF2, LTF3, LTF4, LTF5, LTF6, LTF7, LTF8, LTF9, LTF10, LTF11, LTF12)
// @variable An array containing all intrabar `close` prices from the `ltfString` timeframe for the current chart bar.
array intrabarCloses = request.security_lower_tf(syminfo.tickerid, ltfString, close)
// Calculate the intrabar stats.
= LTF.ltfStats(intrabarCloses)
int chartBars = bar_index + 1
// ————— Visuals
// Plot the `avgIntrabars` and `intrabars` series in all display locations.
plot(avgIntrabars, "Average intrabars", color.silver, 6)
plot(intrabars, "Intrabars", color.blue, 2)
// Plot the `chartBarsCovered` and `chartBars` values in the Data Window and the script's status line.
plot(chartBarsCovered, "Chart bars covered", display = display.data_window + display.status_line)
plot(chartBars, "Chart bars total", display = display.data_window + display.status_line)
// Information box logic.
if showInfoBoxInput
// @variable A single-cell table that displays intrabar information.
var table infoBox = table.new(infoBoxYPosInput + "_" + infoBoxXPosInput, 1, 1)
// @variable The span of the `ltfString` timeframe formatted as a number of automatically selected time units.
string formattedLtf = PCtime.formattedNoOfPeriods(timeframe.in_seconds(ltfString) * 1000)
// @variable A "string" containing the formatted text to display in the `infoBox`.
string txt = str.format(
TAB_TXT, formattedLtf, avgIntrabars, chartBarsCovered, chartBars, chartBarsCovered / chartBars * 100, "'"
)
// Initialize the `infoBox` cell on the first bar.
if barstate.isfirst
table.cell(
infoBox, 0, 0, txt, text_color = infoBoxTxtColorInput, text_size = infoBoxSizeInput,
bgcolor = infoBoxColorInput
)
// Update the cell's text on the latest bar.
else if barstate.islast
table.cell_set_text(infoBox, 0, 0, txt)
// Raise a runtime error if no intrabar data is available.
if ta.cum(intrabars) == 0 and barstate.islast
runtime.error(str.format(ERR_TXT, ltfString, "'"))
//#endregion
█ EXPORTED FUNCTIONS
ltf(userSelection, choice1, choice2, ...)
Returns the optimal lower timeframe string based on user selection and current chart timeframe. Dynamically calculates precision to balance granularity with historical coverage within the 200K intrabar limit.
ltfStats(intrabarValues)
Analyzes an intrabar array returned by request.security_lower_tf() and returns statistics: number of intrabars in current bar, total chart bars covered, and average intrabars per bar.
█ CREDITS AND LICENSING
Original Concept : PineCoders Team
Original Lower TF Library :
License : Mozilla Public License 2.0

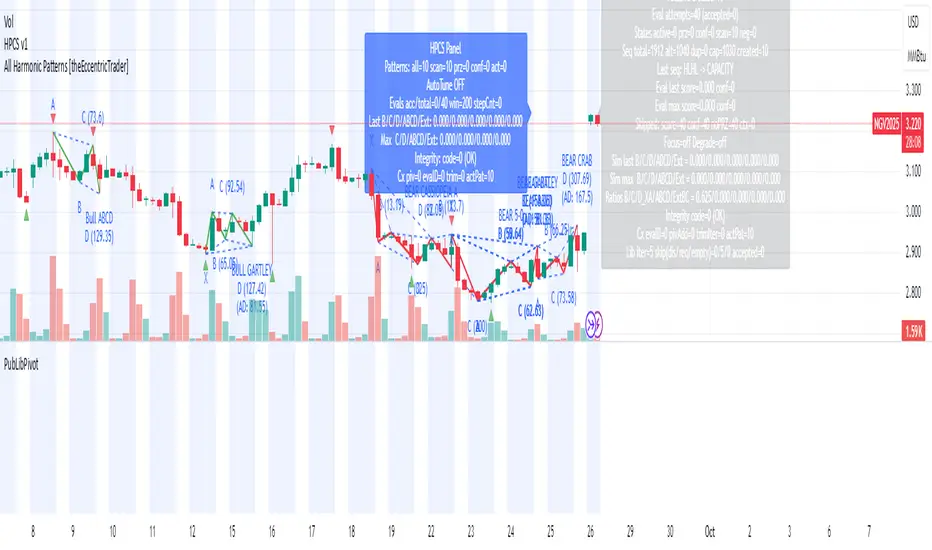
PubLibPivotLibrary "PubLibPivot"
Pivot detection library for harmonic pattern analysis - Fractal and ZigZag methods with validation and utility functions
fractalPivotHigh(depth)
Fractal pivot high condition
Parameters:
depth (int)
Returns: bool
fractalPivotLow(depth)
Fractal pivot low condition
Parameters:
depth (int)
Returns: bool
fractalPivotHighPrice(depth, occurrence)
Get fractal pivot high price
Parameters:
depth (int)
occurrence (simple int)
Returns: float
fractalPivotLowPrice(depth, occurrence)
Get fractal pivot low price
Parameters:
depth (int)
occurrence (simple int)
Returns: float
fractalPivotHighBarIndex(depth, occurrence)
Get fractal pivot high bar index
Parameters:
depth (int)
occurrence (simple int)
Returns: int
fractalPivotLowBarIndex(depth, occurrence)
Get fractal pivot low bar index
Parameters:
depth (int)
occurrence (simple int)
Returns: int
zigzagPivotHigh(deviation, backstep, useATR, atrLength)
ZigZag pivot high condition
Parameters:
deviation (float)
backstep (int)
useATR (bool)
atrLength (simple int)
Returns: bool
zigzagPivotLow(deviation, backstep, useATR, atrLength)
ZigZag pivot low condition
Parameters:
deviation (float)
backstep (int)
useATR (bool)
atrLength (simple int)
Returns: bool
zigzagPivotHighPrice(deviation, backstep, useATR, atrLength, occurrence)
Get ZigZag pivot high price
Parameters:
deviation (float)
backstep (int)
useATR (bool)
atrLength (simple int)
occurrence (simple int)
Returns: float
zigzagPivotLowPrice(deviation, backstep, useATR, atrLength, occurrence)
Get ZigZag pivot low price
Parameters:
deviation (float)
backstep (int)
useATR (bool)
atrLength (simple int)
occurrence (simple int)
Returns: float
zigzagPivotHighBarIndex(deviation, backstep, useATR, atrLength, occurrence)
Get ZigZag pivot high bar index
Parameters:
deviation (float)
backstep (int)
useATR (bool)
atrLength (simple int)
occurrence (simple int)
Returns: int
zigzagPivotLowBarIndex(deviation, backstep, useATR, atrLength, occurrence)
Get ZigZag pivot low bar index
Parameters:
deviation (float)
backstep (int)
useATR (bool)
atrLength (simple int)
occurrence (simple int)
Returns: int
isValidPivotVolume(pivotPrice, pivotBarIndex, minVolumeRatio, volumeLength)
Validate pivot quality based on volume
Parameters:
pivotPrice (float)
pivotBarIndex (int)
minVolumeRatio (float)
volumeLength (int)
Returns: bool
isValidPivotATR(pivotPrice, lastPivotPrice, minATRMultiplier, atrLength)
Validate pivot based on minimum ATR movement
Parameters:
pivotPrice (float)
lastPivotPrice (float)
minATRMultiplier (float)
atrLength (simple int)
Returns: bool
isValidPivotTime(pivotBarIndex, lastPivotBarIndex, minBars)
Validate pivot based on minimum time between pivots
Parameters:
pivotBarIndex (int)
lastPivotBarIndex (int)
minBars (int)
Returns: bool
isPivotConfirmed(pivotBarIndex, depth)
Check if pivot is not repainting (confirmed)
Parameters:
pivotBarIndex (int)
depth (int)
Returns: bool
addPivotToArray(pivotArray, barArray, pivotPrice, pivotBarIndex, maxSize)
Add pivot to array with validation
Parameters:
pivotArray (array)
barArray (array)
pivotPrice (float)
pivotBarIndex (int)
maxSize (int)
Returns: array - updated pivot array
getPivotFromArray(pivotArray, barArray, index)
Get pivot from array by index
Parameters:
pivotArray (array)
barArray (array)
index (int)
Returns: tuple - (price, bar_index)
getPivotsInRange(pivotArray, barArray, startIndex, count)
Get all pivots in range
Parameters:
pivotArray (array)
barArray (array)
startIndex (int)
count (int)
Returns: tuple, array> - (prices, bar_indices)
pivotDistance(barIndex1, barIndex2)
Calculate distance between two pivots in bars
Parameters:
barIndex1 (int)
barIndex2 (int)
Returns: int - distance in bars
pivotPriceRatio(price1, price2)
Calculate price ratio between two pivots
Parameters:
price1 (float)
price2 (float)
Returns: float - price ratio
pivotRetracementRatio(startPrice, endPrice, currentPrice)
Calculate retracement ratio
Parameters:
startPrice (float)
endPrice (float)
currentPrice (float)
Returns: float - retracement ratio (0-1)
pivotExtensionRatio(startPrice, endPrice, currentPrice)
Calculate extension ratio
Parameters:
startPrice (float)
endPrice (float)
currentPrice (float)
Returns: float - extension ratio (>1 for extension)
isInFibZone(startPrice, endPrice, currentPrice, fibLevel, tolerance)
Check if price is in Fibonacci retracement zone
Parameters:
startPrice (float)
endPrice (float)
currentPrice (float)
fibLevel (float)
tolerance (float)
Returns: bool - true if in zone
getPivotType(pivotPrice, pivotBarIndex, lookback)
Get pivot type (high/low) based on surrounding prices
Parameters:
pivotPrice (float)
pivotBarIndex (int)
lookback (int)
Returns: string - "high", "low", or "unknown"
calculatePivotStrength(pivotPrice, pivotBarIndex, lookback)
Calculate pivot strength based on volume and price action
Parameters:
pivotPrice (float)
pivotBarIndex (int)
lookback (int)
Returns: float - strength score (0-100)
BarLibrary "Bar"
A comprehensive library for creating and managing custom multi-timeframe (MTF) candlestick bars without using request.security calls, providing enhanced visualization and analytical capabilities with improved performance
Candle()
Creates a new candle object initialized with current bar's OHLC data
Returns: A new _Candle instance with current market data
method body(this)
Calculates the absolute size of the candle body (distance between open and close)
Namespace types: _Candle
Parameters:
this (_Candle)
Returns: The absolute difference between closing and opening prices
method topWick(this)
Calculates the length of the upper wick (shadow above the candle body)
Namespace types: _Candle
Parameters:
this (_Candle)
Returns: The distance from the higher of open/close to the high price
method bottomWick(this)
Calculates the length of the lower wick (shadow below the candle body)
Namespace types: _Candle
Parameters:
this (_Candle)
Returns: The distance from the low price to the lower of open/close
method display(this, bullishColor, bearishColor, transp, borderWidth, lineWidth)
Renders the candle visually on the chart with customizable colors and styling options
Namespace types: _Candle
Parameters:
this (_Candle)
bullishColor (color)
bearishColor (color)
transp (int)
borderWidth (int)
lineWidth (int)
candles(tf, autoDisplay)
Creates and manages an array of custom timeframe candles with optional automatic display
Parameters:
tf (string) : Target timeframe string (e.g., "60", "240", "D") for candle aggregation
autoDisplay (bool)
Returns: Array containing all completed candles for the specified timeframe
_Candle
Custom candlestick data structure that stores OHLCV data with visual rendering components
Fields:
start (series int) : Opening timestamp of the candle period
end (series int) : Closing timestamp of the candle period
o (series float) : Opening price of the candle
h (series float) : Highest price reached during the candle period
l (series float) : Lowest price reached during the candle period
c (series float) : Closing price of the candle
v (series float) : Volume traded during the candle period
bodyBox (series box)
wickLine (series line)
Example Usage
// Change version with latest version
import EmreKb/Bar/1 as bar
// "240" for 4h timeframe
// true for auto display candles on chart (default: false)
candlesArr = bar.candles("240", true)
SITFX_FuturesSpec_v17SITFX_FuturesSpec_v17 – Universal Futures Contract Library
Full-scale futures contract specification library for Pine Script v6. Covers CME, CBOT, NYMEX, COMEX, CFE, Eurex, ICE, and more – including minis, micros, metals, energies, FX, and bonds.
Key Features:
✅ Instrument‑agnostic: ES/MES, NQ/MNQ, YM/MYM, RTY/M2K, metals, energies, FX, bonds
✅ Full contract data: Tick size, tick value, point value, margins
✅ Continuation‑safe: Single‑line logic, no arrays or continuation errors
✅ Foundation for SITFX tools: Gann, Fibs, structure, and risk modules
Usage example:
import SITFX_FuturesSpec_v17/1 as fs
spec = fs.get(syminfo.root)
label.new(bar_index, high, str.format("{0}: Tick={1}, Value=${2}", spec.name, spec.tickSize, spec.tickValue))

FvgCalculations█ OVERVIEW
This library provides the core calculation engine for identifying Fair Value Gaps (FVGs) across different timeframes and for processing their interaction with price. It includes functions to detect FVGs on both the current chart and higher timeframes, as well as to check for their full or partial mitigation.
█ CONCEPTS
The library's primary functions revolve around the concept of Fair Value Gaps and their lifecycle.
Fair Value Gap (FVG) Identification
An FVG, or imbalance, represents a price range where buying or selling pressure was significant enough to cause a rapid price movement, leaving an "inefficiency" in the market. This library identifies FVGs based on three-bar patterns:
Bullish FVG: Forms when the low of the current bar (bar 3) is higher than the high of the bar two periods prior (bar 1). The FVG is the space between the high of bar 1 and the low of bar 3.
Bearish FVG: Forms when the high of the current bar (bar 3) is lower than the low of the bar two periods prior (bar 1). The FVG is the space between the low of bar 1 and the high of bar 3.
The library provides distinct functions for detecting FVGs on the current (Low Timeframe - LTF) and specified higher timeframes (Medium Timeframe - MTF / High Timeframe - HTF).
FVG Mitigation
Mitigation refers to price revisiting an FVG.
Full Mitigation: An FVG is considered fully mitigated when price completely closes the gap. For a bullish FVG, this occurs if the current low price moves below or touches the FVG's bottom. For a bearish FVG, it occurs if the current high price moves above or touches the FVG's top.
Partial Mitigation (Entry/Fill): An FVG is partially mitigated when price enters the FVG's range but does not fully close it. The library tracks the extent of this fill. For a bullish FVG, if the current low price enters the FVG from above, that low becomes the new effective top of the remaining FVG. For a bearish FVG, if the current high price enters the FVG from below, that high becomes the new effective bottom of the remaining FVG.
FVG Interaction
This refers to any instance where the current bar's price range (high to low) touches or crosses into the currently unfilled portion of an active (visible and not fully mitigated) FVG.
Multi-Timeframe Data Acquisition
To detect FVGs on higher timeframes, specific historical bar data (high, low, and time of bars at indices and relative to the higher timeframe's last completed bar) is required. The requestMultiTFBarData function is designed to fetch this data efficiently.
█ CALCULATIONS AND USE
The functions in this library are typically used in a sequence to manage FVGs:
1. Data Retrieval (for MTF/HTF FVGs):
Call requestMultiTFBarData() with the desired higher timeframe string (e.g., "60", "D").
This returns a tuple of htfHigh1, htfLow1, htfTime1, htfHigh3, htfLow3, htfTime3.
2. FVG Detection:
For LTF FVGs: Call detectFvg() on each confirmed bar. It uses high , low, low , and high along with barstate.isconfirmed.
For MTF/HTF FVGs: Call detectMultiTFFvg() using the data obtained from requestMultiTFBarData().
Both detection functions return an fvgObject (defined in FvgTypes) if an FVG is found, otherwise na. They also can classify FVGs as "Large Volume" (LV) if classifyLV is true and the FVG size (top - bottom) relative to the tfAtr (Average True Range of the respective timeframe) meets the lvAtrMultiplier.
3. FVG State Updates (on each new bar for existing FVGs):
First, check for overall price interaction using fvgInteractionCheck(). This function determines if the current bar's high/low has touched or entered the FVG's currentTop or currentBottom.
If interaction occurs and the FVG is not already mitigated:
Call checkMitigation() to determine if the FVG has been fully mitigated by the current bar's currentHigh and currentLow. If true, the FVG's isMitigated status is updated.
If not fully mitigated, call checkPartialMitigation() to see if the price has further entered the FVG. This function returns the newLevel to which the FVG has been filled (e.g., currentLow for a bullish FVG, currentHigh for bearish). This newLevel is then used to update the FVG's currentTop or currentBottom.
The calling script (e.g., fvgMain.c) is responsible for storing and managing the array of fvgObject instances and passing them to these update functions.
█ NOTES
Bar State for LTF Detection: The detectFvg() function relies on barstate.isconfirmed to ensure FVG detection is based on closed bars, preventing FVGs from being detected prematurely on the currently forming bar.
Higher Timeframe Data (lookahead): The requestMultiTFBarData() function uses lookahead = barmerge.lookahead_on. This means it can access historical data from the higher timeframe that corresponds to the current bar on the chart, even if the higher timeframe bar has not officially closed. This is standard for multi-timeframe analysis aiming to plot historical HTF data accurately on a lower timeframe chart.
Parameter Typing: Functions like detectMultiTFFvg and detectFvg infer the type for boolean (classifyLV) and numeric (lvAtrMultiplier) parameters passed from the main script, while explicitly typed series parameters (like htfHigh1, currentAtr) expect series data.
fvgObject Dependency: The FVG detection functions return fvgObject instances, and fvgInteractionCheck takes an fvgObject as a parameter. This UDT is defined in the FvgTypes library, making it a dependency for using FvgCalculations.
ATR for LV Classification: The tfAtr (for MTF/HTF) and currentAtr (for LTF) parameters are expected to be the Average True Range values for the respective timeframes. These are used, if classifyLV is enabled, to determine if an FVG's size qualifies it as a "Large Volume" FVG based on the lvAtrMultiplier.
MTF/HTF FVG Appearance Timing: When displaying FVGs from a higher timeframe (MTF/HTF) on a lower timeframe (LTF) chart, users might observe that the most recent MTF/HTF FVG appears one LTF bar later compared to its appearance on a native MTF/HTF chart. This is an expected behavior due to the detection mechanism in `detectMultiTFFvg`. This function uses historical bar data from the MTF/HTF (specifically, data equivalent to `HTF_bar ` and `HTF_bar `) to identify an FVG. Therefore, all three bars forming the FVG on the MTF/HTF must be fully closed and have shifted into these historical index positions relative to the `request.security` call from the LTF chart before the FVG can be detected and displayed on the LTF. This ensures that the MTF/HTF FVG is identified based on confirmed, closed bars from the higher timeframe.
█ EXPORTED FUNCTIONS
requestMultiTFBarData(timeframe)
Requests historical bar data for specific previous bars from a specified higher timeframe.
It fetches H , L , T (for the bar before last) and H , L , T (for the bar three periods prior)
from the requested timeframe.
This is typically used to identify FVG patterns on MTF/HTF.
Parameters:
timeframe (simple string) : The higher timeframe to request data from (e.g., "60" for 1-hour, "D" for Daily).
Returns: A tuple containing: .
- htfHigh1 (series float): High of the bar at index 1 (one bar before the last completed bar on timeframe).
- htfLow1 (series float): Low of the bar at index 1.
- htfTime1 (series int) : Time of the bar at index 1.
- htfHigh3 (series float): High of the bar at index 3 (three bars before the last completed bar on timeframe).
- htfLow3 (series float): Low of the bar at index 3.
- htfTime3 (series int) : Time of the bar at index 3.
detectMultiTFFvg(htfHigh1, htfLow1, htfTime1, htfHigh3, htfLow3, htfTime3, tfAtr, classifyLV, lvAtrMultiplier, tfType)
Detects a Fair Value Gap (FVG) on a higher timeframe (MTF/HTF) using pre-fetched bar data.
Parameters:
htfHigh1 (float) : High of the first relevant bar (typically high ) from the higher timeframe.
htfLow1 (float) : Low of the first relevant bar (typically low ) from the higher timeframe.
htfTime1 (int) : Time of the first relevant bar (typically time ) from the higher timeframe.
htfHigh3 (float) : High of the third relevant bar (typically high ) from the higher timeframe.
htfLow3 (float) : Low of the third relevant bar (typically low ) from the higher timeframe.
htfTime3 (int) : Time of the third relevant bar (typically time ) from the higher timeframe.
tfAtr (float) : ATR value for the higher timeframe, used for Large Volume (LV) FVG classification.
classifyLV (bool) : If true, FVGs will be assessed to see if they qualify as Large Volume.
lvAtrMultiplier (float) : The ATR multiplier used to define if an FVG is Large Volume.
tfType (series tfType enum from no1x/FvgTypes/1) : The timeframe type (e.g., types.tfType.MTF, types.tfType.HTF) of the FVG being detected.
Returns: An fvgObject instance if an FVG is detected, otherwise na.
detectFvg(classifyLV, lvAtrMultiplier, currentAtr)
Detects a Fair Value Gap (FVG) on the current (LTF - Low Timeframe) chart.
Parameters:
classifyLV (bool) : If true, FVGs will be assessed to see if they qualify as Large Volume.
lvAtrMultiplier (float) : The ATR multiplier used to define if an FVG is Large Volume.
currentAtr (float) : ATR value for the current timeframe, used for LV FVG classification.
Returns: An fvgObject instance if an FVG is detected, otherwise na.
checkMitigation(isBullish, fvgTop, fvgBottom, currentHigh, currentLow)
Checks if an FVG has been fully mitigated by the current bar's price action.
Parameters:
isBullish (bool) : True if the FVG being checked is bullish, false if bearish.
fvgTop (float) : The top price level of the FVG.
fvgBottom (float) : The bottom price level of the FVG.
currentHigh (float) : The high price of the current bar.
currentLow (float) : The low price of the current bar.
Returns: True if the FVG is considered fully mitigated, false otherwise.
checkPartialMitigation(isBullish, currentBoxTop, currentBoxBottom, currentHigh, currentLow)
Checks for partial mitigation of an FVG by the current bar's price action.
It determines if the price has entered the FVG and returns the new fill level.
Parameters:
isBullish (bool) : True if the FVG being checked is bullish, false if bearish.
currentBoxTop (float) : The current top of the FVG box (this might have been adjusted by previous partial fills).
currentBoxBottom (float) : The current bottom of the FVG box (similarly, might be adjusted).
currentHigh (float) : The high price of the current bar.
currentLow (float) : The low price of the current bar.
Returns: The new price level to which the FVG has been filled (e.g., currentLow for a bullish FVG).
Returns na if no new partial fill occurred on this bar.
fvgInteractionCheck(fvg, highVal, lowVal)
Checks if the current bar's price interacts with the given FVG.
Interaction means the price touches or crosses into the FVG's
current (possibly partially filled) range.
Parameters:
fvg (fvgObject type from no1x/FvgTypes/1) : The FVG object to check.
Its isMitigated, isVisible, isBullish, currentTop, and currentBottom fields are used.
highVal (float) : The high price of the current bar.
lowVal (float) : The low price of the current bar.
Returns: True if price interacts with the FVG, false otherwise.

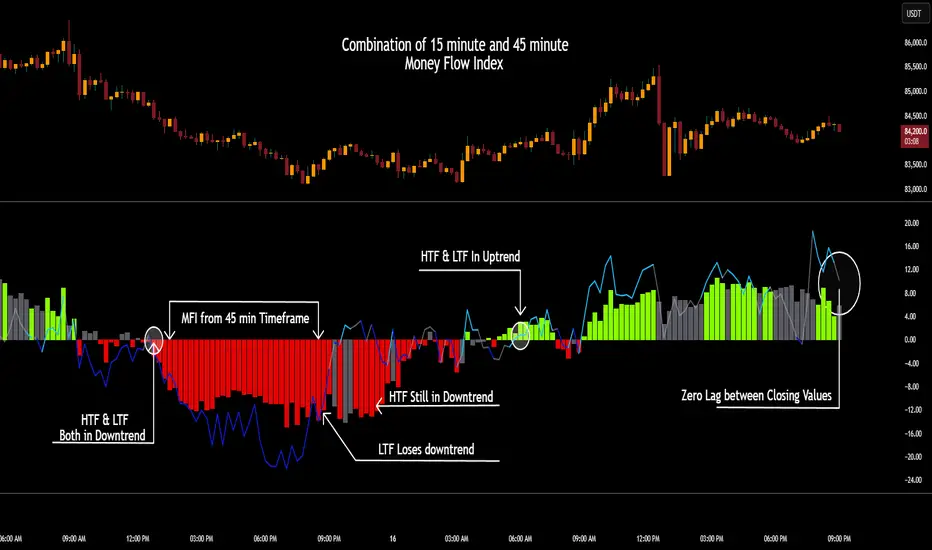
CSCMultiTimeframeToolsLibrary "CSCMultiTimeframeTools"
Calculates instant higher timeframe values for higher timeframe analysis with zero lag.
getAdjustedLookback(current_tf_minutes, higher_tf_minutes, length)
Calculate adjusted lookback period for higher timeframe conversion.
Parameters:
current_tf_minutes (int) : Current chart timeframe in minutes (e.g., 5 for 5m).
higher_tf_minutes (int) : Target higher timeframe in minutes (e.g., 15 for 15m).
length (int) : Base length value (e.g., 14 for RSI/MFI).
Returns: Adjusted lookback period (length × multiplier).
Purpose and Benefits of the TimeframeTools Library
This library is designed to solve a critical pain point for traders who rely on higher timeframe (HTF) indicator values while analyzing lower timeframe (LTF) charts. Traditional methods require waiting for multiple candles to close—for example, to see a 1-hour RSI on a 5-minute chart, you’d need 12 closed candles (5m × 12 = 60m) before the value updates. This lag means missed opportunities, delayed signals, and inefficient decision-making.
Why Traders Need This
Whether you’re scalping (5M/15M) or swing trading (1H/4H), this library bridges the gap between timeframes, giving you HTF context in real time—so you can act faster, with confidence.
How This Library Eliminates the Waiting Game
By dynamically calculating the adjusted lookback period, the library allows:
Real-time HTF values on LTF charts – No waiting for candle closes.
Accurate conversions – A 14-period RSI on a 1-hour chart translates to 168 periods (14 × 12) on a 5-minute chart, ensuring mathematical precision.
Flexible application – Works with common indicators like RSI, MFI, CCI, and moving averages (though confirmations should be done before publishing under your own secondary use).
Key Advantages Over Manual Methods
Speed: Instantly reflects HTF values without waiting for candle resolutions.
Adaptability: Adjusts automatically if the user changes timeframes or lengths.
Consistency: Removes human error in manual period calculations.
Limitations to Note
Not a magic bullet – While it solves the lag issue, traders should still:
Validate signals with price action or additional confirmations.
Be mindful of extreme lookback lengths (e.g., a 200-period daily SMA on a 1-minute chart requires 28,800 periods, which may strain performance).
MTFDataLibrary "MTFData"
Functions to store multi timeframe candle data and swing points.
getCandleData(timeframe, openArray, highArray, lowArray, closeArray, timeArray, olcLookback, alltfs_olcLookback, tfIndex)
Stores current or higher timeframe candle data in arrays.
Parameters:
timeframe (string) : The timeframe, for example "240" for 4h
openArray (array) : An array to store the candle open price
highArray (array) : An array to store the candle high price
lowArray (array) : An array to store the candle low price
closeArray (array) : An array to store the candle close price
timeArray (array) : An array to store the candle time
olcLookback (int) : The history reference of the lookback limiting candle
alltfs_olcLookback (array) : An array holding the candle time of olcLookback candles ago, which can be used for limiting lookbacks
tfIndex (int) : The timeframe's index in the alltfs_olcLookback array
Returns: true if the timeframe changed
trackHiLo(tfchange, timeframe, openArray, highArray, lowArray, closeArray, timeArray, highWickArray, highBodyArray, highTimeArray, lowWickArray, lowBodyArray, lowTimeArray, alltfs_olcLookback, tfIndex)
Stores current or higher timeframe swingpoint data into arrays.
Parameters:
tfchange (bool) : Must be true when the timeframe has changed (a new candle has opened)
timeframe (string) : The timeframe, for example "240" for 4h
openArray (array) : An array that stores the timeframe's candle open price
highArray (array) : An array that stores the timeframe's candle high price
lowArray (array) : An array that stores the timeframe's candle low price
closeArray (array) : An array that stores the timeframe's candle close price
timeArray (array) : An array that stores the timeframe's candle time
highWickArray (array) : An array to store the swing high price
highBodyArray (array) : An array to store the swing high's highest body price
highTimeArray (array) : An array to store the swing high candle's time
lowWickArray (array) : An array to store the swing low price
lowBodyArray (array) : An array to store the swing low's lowest body price
lowTimeArray (array) : An array to store the swing high candle's time
alltfs_olcLookback (array) : An array holding the time of the max allowed swing point age
tfIndex (int) : The timeframe's index in the alltfs_olcLookback array
Returns: Nothing. The array handling happens inside the function.
tfReadable(tfInSec)
Converts a timeframe string ("240") into a more readable string ("4h").
Parameters:
tfInSec (int) : The timeframe that should be converted, as timeframe.in_seconds()
Returns: A more readable timeframe string

real_time_candlesIntroduction
The Real-Time Candles Library provides comprehensive tools for creating, manipulating, and visualizing custom timeframe candles in Pine Script. Unlike standard indicators that only update at bar close, this library enables real-time visualization of price action and indicators within the current bar, offering traders unprecedented insight into market dynamics as they unfold.
This library addresses a fundamental limitation in traditional technical analysis: the inability to see how indicators evolve between bar closes. By implementing sophisticated real-time data processing techniques, traders can now observe indicator movements, divergences, and trend changes as they develop, potentially identifying trading opportunities much earlier than with conventional approaches.
Key Features
The library supports two primary candle generation approaches:
Chart-Time Candles: Generate real-time OHLC data for any variable (like RSI, MACD, etc.) while maintaining synchronization with chart bars.
Custom Timeframe (CTF) Candles: Create candles with custom time intervals or tick counts completely independent of the chart's native timeframe.
Both approaches support traditional candlestick and Heikin-Ashi visualization styles, with options for moving average overlays to smooth the data.
Configuration Requirements
For optimal performance with this library:
Set max_bars_back = 5000 in your script settings
When using CTF drawing functions, set max_lines_count = 500, max_boxes_count = 500, and max_labels_count = 500
These settings ensure that you will be able to draw correctly and will avoid any runtime errors.
Usage Examples
Basic Chart-Time Candle Visualization
// Create real-time candles for RSI
float rsi = ta.rsi(close, 14)
Candle rsi_candle = candle_series(rsi, CandleType.candlestick)
// Plot the candles using Pine's built-in function
plotcandle(rsi_candle.Open, rsi_candle.High, rsi_candle.Low, rsi_candle.Close,
"RSI Candles", rsi_candle.candle_color, rsi_candle.candle_color)
Multiple Access Patterns
The library provides three ways to access candle data, accommodating different programming styles:
// 1. Array-based access for collection operations
Candle candles = candle_array(source)
// 2. Object-oriented access for single entity manipulation
Candle candle = candle_series(source)
float value = candle.source(Source.HLC3)
// 3. Tuple-based access for functional programming styles
= candle_tuple(source)
Custom Timeframe Examples
// Create 20-second candles with EMA overlay
plot_ctf_candles(
source = close,
candle_type = CandleType.candlestick,
sample_type = SampleType.Time,
number_of_seconds = 20,
timezone = -5,
tied_open = true,
ema_period = 9,
enable_ema = true
)
// Create tick-based candles (new candle every 15 ticks)
plot_ctf_tick_candles(
source = close,
candle_type = CandleType.heikin_ashi,
number_of_ticks = 15,
timezone = -5,
tied_open = true
)
Advanced Usage with Custom Visualization
// Get custom timeframe candles without automatic plotting
CandleCTF my_candles = ctf_candles_array(
source = close,
candle_type = CandleType.candlestick,
sample_type = SampleType.Time,
number_of_seconds = 30
)
// Apply custom logic to the candles
float ema_values = my_candles.ctf_ema(14)
// Draw candles and EMA using time-based coordinates
my_candles.draw_ctf_candles_time()
ema_values.draw_ctf_line_time(line_color = #FF6D00)
Library Components
Data Types
Candle: Structure representing chart-time candles with OHLC, polarity, and visualization properties
CandleCTF: Extended candle structure with additional time metadata for custom timeframes
TickData: Structure for individual price updates with time deltas
Enumerations
CandleType: Specifies visualization style (candlestick or Heikin-Ashi)
Source: Defines price components for calculations (Open, High, Low, Close, HL2, etc.)
SampleType: Sets sampling method (Time-based or Tick-based)
Core Functions
get_tick(): Captures current price as a tick data point
candle_array(): Creates an array of candles from price updates
candle_series(): Provides a single candle based on latest data
candle_tuple(): Returns OHLC values as a tuple
ctf_candles_array(): Creates custom timeframe candles without rendering
Visualization Functions
source(): Extracts specific price components from candles
candle_ctf_to_float(): Converts candle data to float arrays
ctf_ema(): Calculates exponential moving averages for candle arrays
draw_ctf_candles_time(): Renders candles using time coordinates
draw_ctf_candles_index(): Renders candles using bar index coordinates
draw_ctf_line_time(): Renders lines using time coordinates
draw_ctf_line_index(): Renders lines using bar index coordinates
Technical Implementation Notes
This library leverages Pine Script's varip variables for state management, creating a sophisticated real-time data processing system. The implementation includes:
Efficient tick capturing: Samples price at every execution, maintaining temporal tracking with time deltas
Smart state management: Uses a hybrid approach with mutable updates at index 0 and historical preservation at index 1+
Temporal synchronization: Manages two time domains (chart time and custom timeframe)
The tooltip implementation provides crucial temporal context for custom timeframe visualizations, allowing users to understand exactly when each candle formed regardless of chart timeframe.
Limitations
Custom timeframe candles cannot be backtested due to Pine Script's limitations with historical tick data
Real-time visualization is only available during live chart updates
Maximum history is constrained by Pine Script's array size limits
Applications
Indicator visualization: See how RSI, MACD, or other indicators evolve in real-time
Volume analysis: Create custom volume profiles independent of chart timeframe
Scalping strategies: Identify short-term patterns with precisely defined time windows
Volatility measurement: Track price movement characteristics within bars
Custom signal generation: Create entry/exit signals based on custom timeframe patterns
Conclusion
The Real-Time Candles Library bridges the gap between traditional technical analysis (based on discrete OHLC bars) and the continuous nature of market movement. By making indicators more responsive to real-time price action, it gives traders a significant edge in timing and decision-making, particularly in fast-moving markets where waiting for bar close could mean missing important opportunities.
Whether you're building custom indicators, researching price patterns, or developing trading strategies, this library provides the foundation for sophisticated real-time analysis in Pine Script.
Implementation Details & Advanced Guide
Core Implementation Concepts
The Real-Time Candles Library implements a sophisticated event-driven architecture within Pine Script's constraints. At its heart, the library creates what's essentially a reactive programming framework handling continuous data streams.
Tick Processing System
The foundation of the library is the get_tick() function, which captures price updates as they occur:
export get_tick(series float source = close, series float na_replace = na)=>
varip float price = na
varip int series_index = -1
varip int old_time = 0
varip int new_time = na
varip float time_delta = 0
// ...
This function:
Samples the current price
Calculates time elapsed since last update
Maintains a sequential index to track updates
The resulting TickData structure serves as the fundamental building block for all candle generation.
State Management Architecture
The library employs a sophisticated state management system using varip variables, which persist across executions within the same bar. This creates a hybrid programming paradigm that's different from standard Pine Script's bar-by-bar model.
For chart-time candles, the core state transition logic is:
// Real-time update of current candle
candle_data := Candle.new(Open, High, Low, Close, polarity, series_index, candle_color)
candles.set(0, candle_data)
// When a new bar starts, preserve the previous candle
if clear_state
candles.insert(1, candle_data)
price.clear()
// Reset state for new candle
Open := Close
price.push(Open)
series_index += 1
This pattern of updating index 0 in real-time while inserting completed candles at index 1 creates an elegant solution for maintaining both current state and historical data.
Custom Timeframe Implementation
The custom timeframe system manages its own time boundaries independent of chart bars:
bool clear_state = switch settings.sample_type
SampleType.Ticks => cumulative_series_idx >= settings.number_of_ticks
SampleType.Time => cumulative_time_delta >= settings.number_of_seconds
This dual-clock system synchronizes two time domains:
Pine's execution clock (bar-by-bar processing)
The custom timeframe clock (tick or time-based)
The library carefully handles temporal discontinuities, ensuring candle formation remains accurate despite irregular tick arrival or market gaps.
Advanced Usage Techniques
1. Creating Custom Indicators with Real-Time Candles
To develop indicators that process real-time data within the current bar:
// Get real-time candles for your data
Candle rsi_candles = candle_array(ta.rsi(close, 14))
// Calculate indicator values based on candle properties
float signal = ta.ema(rsi_candles.first().source(Source.Close), 9)
// Detect patterns that occur within the bar
bool divergence = close > close and rsi_candles.first().Close < rsi_candles.get(1).Close
2. Working with Custom Timeframes and Plotting
For maximum flexibility when visualizing custom timeframe data:
// Create custom timeframe candles
CandleCTF volume_candles = ctf_candles_array(
source = volume,
candle_type = CandleType.candlestick,
sample_type = SampleType.Time,
number_of_seconds = 60
)
// Convert specific candle properties to float arrays
float volume_closes = volume_candles.candle_ctf_to_float(Source.Close)
// Calculate derived values
float volume_ema = volume_candles.ctf_ema(14)
// Create custom visualization
volume_candles.draw_ctf_candles_time()
volume_ema.draw_ctf_line_time(line_color = color.orange)
3. Creating Hybrid Timeframe Analysis
One powerful application is comparing indicators across multiple timeframes:
// Standard chart timeframe RSI
float chart_rsi = ta.rsi(close, 14)
// Custom 5-second timeframe RSI
CandleCTF ctf_candles = ctf_candles_array(
source = close,
candle_type = CandleType.candlestick,
sample_type = SampleType.Time,
number_of_seconds = 5
)
float fast_rsi_array = ctf_candles.candle_ctf_to_float(Source.Close)
float fast_rsi = fast_rsi_array.first()
// Generate signals based on divergence between timeframes
bool entry_signal = chart_rsi < 30 and fast_rsi > fast_rsi_array.get(1)
Final Notes
This library represents an advanced implementation of real-time data processing within Pine Script's constraints. By creating a reactive programming framework for handling continuous data streams, it enables sophisticated analysis typically only available in dedicated trading platforms.
The design principles employed—including state management, temporal processing, and object-oriented architecture—can serve as patterns for other advanced Pine Script development beyond this specific application.
------------------------
Library "real_time_candles"
A comprehensive library for creating real-time candles with customizable timeframes and sampling methods.
Supports both chart-time and custom-time candles with options for candlestick and Heikin-Ashi visualization.
Allows for tick-based or time-based sampling with moving average overlay capabilities.
get_tick(source, na_replace)
Captures the current price as a tick data point
Parameters:
source (float) : Optional - Price source to sample (defaults to close)
na_replace (float) : Optional - Value to use when source is na
Returns: TickData structure containing price, time since last update, and sequential index
candle_array(source, candle_type, sync_start, bullish_color, bearish_color)
Creates an array of candles based on price updates
Parameters:
source (float) : Optional - Price source to sample (defaults to close)
candle_type (simple CandleType) : Optional - Type of candle chart to create (candlestick or Heikin-Ashi)
sync_start (simple bool) : Optional - Whether to synchronize with the start of a new bar
bullish_color (color) : Optional - Color for bullish candles
bearish_color (color) : Optional - Color for bearish candles
Returns: Array of Candle objects ordered with most recent at index 0
candle_series(source, candle_type, wait_for_sync, bullish_color, bearish_color)
Provides a single candle based on the latest price data
Parameters:
source (float) : Optional - Price source to sample (defaults to close)
candle_type (simple CandleType) : Optional - Type of candle chart to create (candlestick or Heikin-Ashi)
wait_for_sync (simple bool) : Optional - Whether to wait for a new bar before starting
bullish_color (color) : Optional - Color for bullish candles
bearish_color (color) : Optional - Color for bearish candles
Returns: A single Candle object representing the current state
candle_tuple(source, candle_type, wait_for_sync, bullish_color, bearish_color)
Provides candle data as a tuple of OHLC values
Parameters:
source (float) : Optional - Price source to sample (defaults to close)
candle_type (simple CandleType) : Optional - Type of candle chart to create (candlestick or Heikin-Ashi)
wait_for_sync (simple bool) : Optional - Whether to wait for a new bar before starting
bullish_color (color) : Optional - Color for bullish candles
bearish_color (color) : Optional - Color for bearish candles
Returns: Tuple representing current candle values
method source(self, source, na_replace)
Extracts a specific price component from a Candle
Namespace types: Candle
Parameters:
self (Candle)
source (series Source) : Type of price data to extract (Open, High, Low, Close, or composite values)
na_replace (float) : Optional - Value to use when source value is na
Returns: The requested price value from the candle
method source(self, source)
Extracts a specific price component from a CandleCTF
Namespace types: CandleCTF
Parameters:
self (CandleCTF)
source (simple Source) : Type of price data to extract (Open, High, Low, Close, or composite values)
Returns: The requested price value from the candle as a varip
method candle_ctf_to_float(self, source)
Converts a specific price component from each CandleCTF to a float array
Namespace types: array
Parameters:
self (array)
source (simple Source) : Optional - Type of price data to extract (defaults to Close)
Returns: Array of float values extracted from the candles, ordered with most recent at index 0
method ctf_ema(self, ema_period)
Calculates an Exponential Moving Average for a CandleCTF array
Namespace types: array
Parameters:
self (array)
ema_period (simple float) : Period for the EMA calculation
Returns: Array of float values representing the EMA of the candle data, ordered with most recent at index 0
method draw_ctf_candles_time(self, sample_type, number_of_ticks, number_of_seconds, timezone)
Renders custom timeframe candles using bar time coordinates
Namespace types: array
Parameters:
self (array)
sample_type (simple SampleType) : Optional - Method for sampling data (Time or Ticks), used for tooltips
number_of_ticks (simple int) : Optional - Number of ticks per candle (used when sample_type is Ticks), used for tooltips
number_of_seconds (simple float) : Optional - Time duration per candle in seconds (used when sample_type is Time), used for tooltips
timezone (simple int) : Optional - Timezone offset from UTC (-12 to +12), used for tooltips
Returns: void - Renders candles on the chart using time-based x-coordinates
method draw_ctf_candles_index(self, sample_type, number_of_ticks, number_of_seconds, timezone)
Renders custom timeframe candles using bar index coordinates
Namespace types: array
Parameters:
self (array)
sample_type (simple SampleType) : Optional - Method for sampling data (Time or Ticks), used for tooltips
number_of_ticks (simple int) : Optional - Number of ticks per candle (used when sample_type is Ticks), used for tooltips
number_of_seconds (simple float) : Optional - Time duration per candle in seconds (used when sample_type is Time), used for tooltips
timezone (simple int) : Optional - Timezone offset from UTC (-12 to +12), used for tooltips
Returns: void - Renders candles on the chart using index-based x-coordinates
method draw_ctf_line_time(self, source, line_size, line_color)
Renders a line representing a price component from the candles using time coordinates
Namespace types: array
Parameters:
self (array)
source (simple Source) : Optional - Type of price data to extract (defaults to Close)
line_size (simple int) : Optional - Width of the line
line_color (simple color) : Optional - Color of the line
Returns: void - Renders a connected line on the chart using time-based x-coordinates
method draw_ctf_line_time(self, line_size, line_color)
Renders a line from a varip float array using time coordinates
Namespace types: array
Parameters:
self (array)
line_size (simple int) : Optional - Width of the line, defaults to 2
line_color (simple color) : Optional - Color of the line
Returns: void - Renders a connected line on the chart using time-based x-coordinates
method draw_ctf_line_index(self, source, line_size, line_color)
Renders a line representing a price component from the candles using index coordinates
Namespace types: array
Parameters:
self (array)
source (simple Source) : Optional - Type of price data to extract (defaults to Close)
line_size (simple int) : Optional - Width of the line
line_color (simple color) : Optional - Color of the line
Returns: void - Renders a connected line on the chart using index-based x-coordinates
method draw_ctf_line_index(self, line_size, line_color)
Renders a line from a varip float array using index coordinates
Namespace types: array
Parameters:
self (array)
line_size (simple int) : Optional - Width of the line, defaults to 2
line_color (simple color) : Optional - Color of the line
Returns: void - Renders a connected line on the chart using index-based x-coordinates
plot_ctf_tick_candles(source, candle_type, number_of_ticks, timezone, tied_open, ema_period, bullish_color, bearish_color, line_width, ema_color, use_time_indexing)
Plots tick-based candles with moving average
Parameters:
source (float) : Input price source to sample
candle_type (simple CandleType) : Type of candle chart to display
number_of_ticks (simple int) : Number of ticks per candle
timezone (simple int) : Timezone offset from UTC (-12 to +12)
tied_open (simple bool) : Whether to tie open price to close of previous candle
ema_period (simple float) : Period for the exponential moving average
bullish_color (color) : Optional - Color for bullish candles
bearish_color (color) : Optional - Color for bearish candles
line_width (simple int) : Optional - Width of the moving average line, defaults to 2
ema_color (color) : Optional - Color of the moving average line
use_time_indexing (simple bool) : Optional - When true the function will plot with xloc.time, when false it will plot using xloc.bar_index
Returns: void - Creates visual candle chart with EMA overlay
plot_ctf_tick_candles(source, candle_type, number_of_ticks, timezone, tied_open, bullish_color, bearish_color, use_time_indexing)
Plots tick-based candles without moving average
Parameters:
source (float) : Input price source to sample
candle_type (simple CandleType) : Type of candle chart to display
number_of_ticks (simple int) : Number of ticks per candle
timezone (simple int) : Timezone offset from UTC (-12 to +12)
tied_open (simple bool) : Whether to tie open price to close of previous candle
bullish_color (color) : Optional - Color for bullish candles
bearish_color (color) : Optional - Color for bearish candles
use_time_indexing (simple bool) : Optional - When true the function will plot with xloc.time, when false it will plot using xloc.bar_index
Returns: void - Creates visual candle chart without moving average
plot_ctf_time_candles(source, candle_type, number_of_seconds, timezone, tied_open, ema_period, bullish_color, bearish_color, line_width, ema_color, use_time_indexing)
Plots time-based candles with moving average
Parameters:
source (float) : Input price source to sample
candle_type (simple CandleType) : Type of candle chart to display
number_of_seconds (simple float) : Time duration per candle in seconds
timezone (simple int) : Timezone offset from UTC (-12 to +12)
tied_open (simple bool) : Whether to tie open price to close of previous candle
ema_period (simple float) : Period for the exponential moving average
bullish_color (color) : Optional - Color for bullish candles
bearish_color (color) : Optional - Color for bearish candles
line_width (simple int) : Optional - Width of the moving average line, defaults to 2
ema_color (color) : Optional - Color of the moving average line
use_time_indexing (simple bool) : Optional - When true the function will plot with xloc.time, when false it will plot using xloc.bar_index
Returns: void - Creates visual candle chart with EMA overlay
plot_ctf_time_candles(source, candle_type, number_of_seconds, timezone, tied_open, bullish_color, bearish_color, use_time_indexing)
Plots time-based candles without moving average
Parameters:
source (float) : Input price source to sample
candle_type (simple CandleType) : Type of candle chart to display
number_of_seconds (simple float) : Time duration per candle in seconds
timezone (simple int) : Timezone offset from UTC (-12 to +12)
tied_open (simple bool) : Whether to tie open price to close of previous candle
bullish_color (color) : Optional - Color for bullish candles
bearish_color (color) : Optional - Color for bearish candles
use_time_indexing (simple bool) : Optional - When true the function will plot with xloc.time, when false it will plot using xloc.bar_index
Returns: void - Creates visual candle chart without moving average
plot_ctf_candles(source, candle_type, sample_type, number_of_ticks, number_of_seconds, timezone, tied_open, ema_period, bullish_color, bearish_color, enable_ema, line_width, ema_color, use_time_indexing)
Unified function for plotting candles with comprehensive options
Parameters:
source (float) : Input price source to sample
candle_type (simple CandleType) : Optional - Type of candle chart to display
sample_type (simple SampleType) : Optional - Method for sampling data (Time or Ticks)
number_of_ticks (simple int) : Optional - Number of ticks per candle (used when sample_type is Ticks)
number_of_seconds (simple float) : Optional - Time duration per candle in seconds (used when sample_type is Time)
timezone (simple int) : Optional - Timezone offset from UTC (-12 to +12)
tied_open (simple bool) : Optional - Whether to tie open price to close of previous candle
ema_period (simple float) : Optional - Period for the exponential moving average
bullish_color (color) : Optional - Color for bullish candles
bearish_color (color) : Optional - Color for bearish candles
enable_ema (bool) : Optional - Whether to display the EMA overlay
line_width (simple int) : Optional - Width of the moving average line, defaults to 2
ema_color (color) : Optional - Color of the moving average line
use_time_indexing (simple bool) : Optional - When true the function will plot with xloc.time, when false it will plot using xloc.bar_index
Returns: void - Creates visual candle chart with optional EMA overlay
ctf_candles_array(source, candle_type, sample_type, number_of_ticks, number_of_seconds, tied_open, bullish_color, bearish_color)
Creates an array of custom timeframe candles without rendering them
Parameters:
source (float) : Input price source to sample
candle_type (simple CandleType) : Type of candle chart to create (candlestick or Heikin-Ashi)
sample_type (simple SampleType) : Method for sampling data (Time or Ticks)
number_of_ticks (simple int) : Optional - Number of ticks per candle (used when sample_type is Ticks)
number_of_seconds (simple float) : Optional - Time duration per candle in seconds (used when sample_type is Time)
tied_open (simple bool) : Optional - Whether to tie open price to close of previous candle
bullish_color (color) : Optional - Color for bullish candles
bearish_color (color) : Optional - Color for bearish candles
Returns: Array of CandleCTF objects ordered with most recent at index 0
Candle
Structure representing a complete candle with price data and display properties
Fields:
Open (series float) : Opening price of the candle
High (series float) : Highest price of the candle
Low (series float) : Lowest price of the candle
Close (series float) : Closing price of the candle
polarity (series bool) : Boolean indicating if candle is bullish (true) or bearish (false)
series_index (series int) : Sequential index identifying the candle in the series
candle_color (series color) : Color to use when rendering the candle
ready (series bool) : Boolean indicating if candle data is valid and ready for use
TickData
Structure for storing individual price updates
Fields:
price (series float) : The price value at this tick
time_delta (series float) : Time elapsed since the previous tick in milliseconds
series_index (series int) : Sequential index identifying this tick
CandleCTF
Structure representing a custom timeframe candle with additional time metadata
Fields:
Open (series float) : Opening price of the candle
High (series float) : Highest price of the candle
Low (series float) : Lowest price of the candle
Close (series float) : Closing price of the candle
polarity (series bool) : Boolean indicating if candle is bullish (true) or bearish (false)
series_index (series int) : Sequential index identifying the candle in the series
open_time (series int) : Timestamp marking when the candle was opened (in Unix time)
time_delta (series float) : Duration of the candle in milliseconds
candle_color (series color) : Color to use when rendering the candle

Cometreon_Public📚 Cometreon Public Library – Advanced Functions for Pine Script
This library contains advanced functions used in my public indicators on TradingView. The goal is to make the code more modular and efficient, allowing users to call pre-built functions for complex calculations without rewriting them from scratch.
🔹 Currently Available Functions:
1️⃣ Moving Average Function – Provides multiple types of moving averages to choose from, including:
SMA (Simple Moving Average)
EMA (Exponential Moving Average)
WMA (Weighted Moving Average)
RMA (Smoothed Moving Average)
HMA (Hull Moving Average)
JMA (Jurik Moving Average)
DEMA (Double Exponential Moving Average)
TEMA (Triple Exponential Moving Average)
LSMA (Least Squares Moving Average)
VWMA (Volume-Weighted Moving Average)
SMMA (Smoothed Moving Average)
KAMA (Kaufman’s Adaptive Moving Average)
ALMA (Arnaud Legoux Moving Average)
FRAMA (Fractal Adaptive Moving Average)
VIDYA (Variable Index Dynamic Average)
2️⃣ Custom RSI – Uses the Moving Average function to modify the calculation method, with an additional option for a dynamic version.
3️⃣ Custom MACD – Uses the Moving Average function to modify the calculation method, with an additional option for a dynamic version.
4️⃣ Custom Alligator – Uses the Moving Average function to modify generic calculations, allowing users to change the calculation method.

Flux Charts - SFX Screener💎 GENERAL OVERVIEW
The SFX Screener by Flux Charts is a multi-timeframe market scanner that extracts and visually organizes key conditions detected by the SFX Algo indicator across multiple assets in real-time. It does not perform independent analysis or generate new signals—instead, it pulls data directly from the SFX Algo’s calculations to ensure full alignment across different timeframes and tickers.
The SFX Algo is a multi-factor trading indicator that integrates trend analysis, signal generation, market overlays, and take-profit/stop-loss levels into a single system. It evaluates multiple trend components, including EMA direction, momentum shifts, and volatility cycles, to determine market conditions. Signal generation is based on an Adjusted Weighted Majority Algorithm, filtering out weaker signals by prioritizing the most reliable market indicators. Market overlays, such as Volatility Bands and the Retracement Wave, provide dynamic support, resistance, exit points, and entry points. Its adaptable structure allows traders to customize settings based on strategy preferences, making it effective for scalping, swing trading, and long-term trend analysis.
The SFX Screener’s purpose is to give traders a dashboard view of these SFX Algo signals across multiple tickers and timeframes in real-time.
📌 HOW DOES IT WORK ?
The SFX Algo indicator employs an Adjusted Weighted Majority algorithm to generate "buy" and "sell" signals. It evaluates multiple market indicators ("experts"), including momentum, ATR trends, and EMA trends, and assigns weights based on their recent performance. The "Time Weighting" setting allows users to balance between using more historical data or prioritizing recent trends. Unlike traditional weighted majority methods, SFX also dynamically penalizes larger losses. Signals are confirmed based on the consensus of the most successful indicators within the selected time period, filtering out weaker signals during underperforming phases.
The SFX Screener extracts these calculated outputs and visually organizes them into a real-time dashboard. Each signal, status, and volatility condition displayed in the screener is a direct output from the SFX Algo indicator.
🚩 UNIQUENESS
Unlike traditional screeners that rely on preset filters or static conditions, the SFX Screener dynamically updates its dashboard based on live outputs from the SFX Algo’s adaptive algorithm.
Traditional Screeners → Use predefined filters like “price above EMA” or “RSI overbought.” They do not adjust to market dynamics.
SFX Screener → Displays outputs directly from an adaptive algorithm that continuously evaluates trends, volatility, and momentum changes.
The SFX Screener can show SFX Algo's status on 8 different tickers on different timeframes. Key factors that make it unique include:
✅ Real-time sync with SFX Algo → Displays live conditions, not static filters.
✅ Comprehensive Dashboard – This screener provides a complete and customizable dashboard designed to enhance traders' decision-making by consolidating crucial SFX Algo insights into one user-friendly interface.
✅ Multi-Ticker & Multi-Timeframe Analysis – With support for up to 8 tickers and timeframes, traders can effortlessly analyze the bigger market picture, identifying trends and opportunities across different assets and timeframes.
By combining multiple analytical elements in a single view, this screener empowers traders with the insights needed to navigate the market more effectively.
🎯 SFX SCREENER FEATURES:
SFX Algo Signals : This tool can detect SFX Algo signals across different tickers & timeframes.
Volatility Bands : Detection of Volatility Bands Status & Retests.
Retracement Wave : Detection of Retracement Wave Status & Retests.
Highly Configurable : Offers multiple parameters for fine-tuning detection settings.
Up to 8 Tickers : Allows traders to analyze multiple tickers & timeframes simultaneously for enhanced accuracy.
📊 SFX SCREENER DATA BREAKDOWN
Signal ->
Buy -> The latest signal is a buy signal.
Sell -> The latest signal is a sell signal.
The rating of the signal is shown after the signal type.
Δ⭐ ->
Shows the rating change (delta) after the signal is triggered. Positive values mean that the rating is increased after the signal is given, negative values mean that it's decreased.
Status ->
Displays the amount of time passed after the signal is given.
TP Targets ->
Shows the Take-Profit targets of the signal, if a target was achieved, there is a ✅ symbol near it and the next target it displayed.
V. Bands ->
The Volatility Bands dynamically adjust to market conditions, expanding during high volatility and contracting during low volatility. When the volatility bands are tight, or the upper and lower bands are close to each other, the market is not volatile. During periods of low volatility, it’s common for price to consolidate or move sideways. An early indication of a large price move can occur when the bands widen or open up after being tight. When the volatility bands are wide, it reflects a period of increased volatility, typically during strong price trends or after a breakout. The volatility bands can also act as support and resistance areas. The upper band acts as resistance while the lower band acts as support. These mark out good areas for potential reversals. Breakouts can also occur when price moves beyond the bands, signaling a potential trend in the breakout direction.
Outside -> The price is currently outside of the Volatility Bands.
Inside | Upper -> The price is currently inside the Upper Volatility Band.
Inside | Lower -> The price is currently inside the Lower Volatility Band.
R. Wave ->
The Retracement Wave is used to identify entry points during pullbacks in trending markets. It can also be used to find exit points for open trades. The wave is bullish when price is above it and bearish when the price is below it. The retracement wave can be used as an area to enter during a pullback in a trending market. The wave can also be helpful for managing risk and closing out positions.
Outside | Bullish -> The Retracement Wave is currently Bullish, and the price is outside of it.
Outside | Bearish -> The Retracement Wave is currently Bearish, and the price is outside of it.
Inside | Bullish -> The Retracement Wave is currently Bullish, and the price is inside of it.
Inside | Bearish -> The Retracement Wave is currently Bearish, and the price is inside of it.
Profit & Loss (P&L) ->
Shows the amount of profit or loss the position is currently in. All values are shown in terms of percentage, and positive values mean the position is in profit while negative values mean that the position is in loss.
⚠ Timeframe Restriction : The selected timeframes for analysis cannot be lower than the chart’s current timeframe to ensure proper data alignment.
⏰ ALERTS
This screener supports alerts, so you never miss a key market move. You can choose to receive alerts when a buy or sell signal is given, helping you spot potential trading opportunities. Additionally, you can enable alerts for take-profit or stop-loss levels, which notify you when the price achieves those levels. The alerts will work for each enabled ticker in the settings. You can also toggle webhook format for alerts, and choose to include ticker metadata in it.
⚙️ SETTINGS
1. Algorithm Settings
Sensitivity: The sensitivity setting is a key parameter that influences the frequency of signals the SFX Algo generates. By adjusting this parameter, you can control the frequency of signals produced by the algorithm. Using a lower sensitivity setting generates more frequent signals that are highly responsive to minor price fluctuations. Using a higher sensitivity setting reduces the frequency of signals, focusing on more significant price movements and filtering out minor fluctuations.
Signal Strength: The Signal Strength setting filters signals based on their quality, allowing traders to focus on the most reliable opportunities. This feature helps traders balance the quantity and reliability of the algorithm’s signals to suit their trading strategy. Using a lower signal strength will display more signals, including those with lower signal ratings, for broader market coverage. Using a higher signal strength will display fewer signals by prioritizing those with higher signal ratings, reducing market noise.
Time Weighting: The Time Weighting setting in the SFX Algo determines how historical market data is analyzed to generate signals.
a) Recent Trends
Focuses on the most recent movements for short-term analysis. This setting is good for scalpers and intraday traders who need to react quickly to market changes.
b) Mixed Trends
Balances recent and historical price movements for a comprehensive market view. This setting is well-suited for swing traders and those who want to capture medium-term opportunities by combining the benefits of short-term responsiveness with the reliability of long-term trends.
c) Long-term Trends
Relies on extended historical market data to identify broader market trends, making it an excellent choice for traders focused on long-term strategies.
Minimum Star Rating : The Minimum Star Rating setting allows you to filter signals based on their strength, showing only those that meet or exceed your chosen threshold. For instance, setting the minimum star rating to 3 ensures you only receive signals with a rating of 3 stars or higher.
2. Take Profit / Stop Loss Methods
Key Levels
The Key Levels method uses pivot points to set take profit and stop-loss levels. The TP and SL levels are shown when a new signal is generated.
Volatility Bands
This TP/SL method uses the Volatility Bands overlay to set dynamic TP and SL levels. These levels are not predetermined so they will not be shown in advance when a signal is generated.
Signal Rating
Sets take profit and stop-loss levels based on changes in a signal's rating strength. These levels are not predetermined so they will not be shown in advance when a signal is generated.
Auto Stop-Loss
The auto method can only be applied to the SL. The auto method allows the algorithm to detect SL automatically when a momentum shift is detected. You can adjust the risk tolerance of the Auto SL by adjusting the ‘Auto Risk Tolerance’ setting. You can choose between Low, Medium, and High. A high-risk tolerance will result in stop losses being triggered less often.
3. Tickers
You can set, then enable or disable up to 8 tickers in this section to get informed about their latest SFX Algo signal.
‼️ Important Notes
TradingView has limitations when running advanced screeners, resulting in the following restrictions:
Computation Errors:
The computation of using MTF features and viewing several tickers is very intensive on TradingView. This can sometimes cause calculation timeouts. When this occurs simply force the recalculation by modifying one indicator’s settings or by removing the indicator and adding it to your chart again.
Inconsistencies:
You may notice inconsistencies when viewing the screener on a chart with a specific symbol because screener tickers originate from different markets. Since the cryptocurrency market operates 24/7, while stock markets have defined opening and closing hours, the screener may return varying information depending on whether you're currently viewing a cryptocurrency, stock, or currency pair.

Flux Charts - S&D Screener💎 GENERAL OVERVIEW
Introducing Supply & Demand Zones (S&D) Screener! This screener can spot trading opportunities for Supply & Demand traders across 8 different tickers and timeframes simultaneously! This screener offers a wide range of configurable settings, explained within this write-up.
S&D Screener Features:
Supply & Demand Zones : This tool can detect Supply & Demand zones using one of the two detection methods.
Highly Configurable : Offers multiple parameters for fine-tuning detection settings.
Up to 8 Tickers : Allows traders to analyze multiple tickers & timeframes simultaneously for enhanced accuracy.
🚩 UNIQUENESS
The S&D Screener is the first ever tool on TradingView that allows traders to screen 8 different tickers on different timeframes for Supply & Demand Zones. Key factors that make it unique include:
✅ Comprehensive Dashboard – This screener provides a complete and customizable dashboard designed to enhance traders' decision-making by consolidating crucial Supply & Demand insights into one user-friendly interface.
✅ Multi-Ticker & Multi-Timeframe Analysis – With support for up to 8 tickers and timeframes, traders can effortlessly analyze the bigger market picture, identifying trends and opportunities across different assets and timeframes.
By combining multiple analytical elements in a single view, this screener empowers traders with the insights needed to navigate the market more effectively.
📌 HOW DOES IT WORK ?
The S&D Screener helps traders identify Supply & Demand Zones on multiple tickers & timeframes. It offers customizable settings to adapt to different trading styles. The screener includes two zone detection methods. The Momentum Method identifies zones based on strong bullish or bearish price movements, making it ideal for traders who seek quick market reactions. The Regression Method uses statistical regression to detect zones by analyzing price deviations from the trend, which is more suitable for long-term traders. You can customize your zone preferences and enable up to 8 tickers and their respective timeframes. You'll be able to see the status of the latest detected zones on that ticker/timeframe. You can also see the distance from current price of the ticker to the zone and how many times price has retested that zone.
Supply Zone
In trading, a supply zone is a specific area on a price chart where selling interest surpasses buying interest, leading to a potential decline in asset prices. This zone typically forms after a price rally, indicating that sellers find the asset overvalued and are prepared to sell, creating downward pressure. Identifying supply zones can help traders anticipate potential price reversals or pullbacks.
Trading Possibilities with Supply Zones
Entering Short Positions -> When the price approaches a recognized supply zone, traders may consider initiating short positions, anticipating that increased selling pressure will drive prices down.
Setting Profit Targets -> For traders holding long positions, supply zones can serve as strategic points to set profit targets, as these areas may signal potential resistance and a subsequent price drop.
Demand Zone
In trading, a demand zone is a specific area on a price chart where buying interest is strong enough to halt a downtrend and potentially reverse it upward. This zone indicates a price level where demand exceeds supply, leading to a rise in price. Identifying these zones can provide traders with strategic entry points for potential long positions.
Trading Possibilities with Demand Zones
Entering Long Positions -> When the price approaches a recognized demand zone, traders may consider initiating long positions, anticipating that increased buying pressure will drive prices up.
Setting Profit Targets -> For traders holding short positions, demand zones can serve as strategic points to set profit targets, as these areas may signal potential resistance and a subsequent price increase.
Momentum Detection Method
The Momentum Detection Method identifies supply and demand zones by analyzing the strength and direction of price movements over a specified period. It looks for a sequence of strong bullish or bearish candles to determine potential zones. The method is sensitive to the ‘Sensitivity’ setting, which adjusts the threshold for what constitutes a "strong" candle.
Using the momentum method is ideal for traders looking to capitalize on immediate price reactions and momentum shifts.
Regression Detection Method
The Regression Method uses statistical regression to identify supply and demand zones by analyzing price consolidation patterns. It fits a regression line to price data and identifies zones where price deviates significantly from the trend. This method is more mathematical and less reliant on individual candle patterns. It focuses on the overall price structure and identifies zones based on statistical deviations from the trend.
This method is particularly useful for traders who focus on longer-term price trends and prefer a more statistical approach to pinpoint zones.
Using the momentum method is ideal for traders looking to capitalize on immediate price reactions and momentum shifts.
Status ->
Far -> This status indicates that the current price is significantly distant from any identified supply or demand zones. In this scenario, traders might exercise patience, waiting for the price to approach these zones before considering entry or exit points.
Approaching ⬆️ -> The price is rising towards a supply zone, suggesting potential selling opportunities as the price nears an area where selling pressure previously dominated.
Approaching ⬇️ -> The price is falling towards a demand zone, indicating potential buying opportunities as the price approaches an area known for strong buying interest.
Inside -> The current price is within the boundaries of a supply or demand zone. This status often signals a critical decision point:
Inside a Supply Zone: The area where selling pressure may increase, potentially leading to a price decline. Traders might look for confirmation before initiating short positions.
Inside a Demand Zone: The area where buying interest could surge, possibly resulting in a price increase. Traders might seek validation before entering long positions.
Being "inside" a zone suggests heightened market activity and potential volatility, warranting close monitoring for trading signals.
Retests -> A retest occurs when the price revisits a supply or demand zone but fails to break through it. Specifically, during a retest, the wick of a candlestick enters the zone, but the candle closes below the supply zone or above the demand zone. This price action suggests that the zone remains a strong area of resistance or support, as the market couldn't sustain movement beyond it. Traders often view such retests as confirmations to enter positions in the direction opposite to the zone's boundary. For instance, if the price retests a supply zone and fails to close above it, it may signal a selling opportunity. Conversely, a failed retest of a demand zone could indicate a buying opportunity. Monitoring the number of retests can provide insights into the strength of these zones; multiple retests without a breakout may reinforce the zone's significance. Here you can see how many times the price retested the supply or demand zone.
⚠ Timeframe Restriction : The selected timeframes for analysis cannot be lower than the chart’s current timeframe to ensure proper data alignment.
⏰ ALERTS
This screener supports alerts, so you never miss a key market move. You can choose to receive alerts when a new demand or supply zone is created, helping you spot potential trading opportunities. Additionally, you can enable alerts for retests, which notify you when the price returns to test a previously identified zone. The alerts will work for each enabled ticker in the settings.
⚙️ SETTINGS
1. General Configuration
Detection Method : There are two detection methods you can choose from for identifying Supply & Demand Zones. Both methods aim to identify key areas where price is likely to react, but they do so using different approaches. Traders can choose the method that aligns with their trading style and time horizon.
Sensitivity : The Sensitivity setting allows traders to adjust how aggressively the script identifies supply and demand zones when using the Momentum Detection Method. This setting directly impacts the threshold for detecting zones when using the momentum detection method.
High Sensitivity -> Detects smaller price movements, resulting in more zones being identified. This is ideal for traders who want to capture even minor supply and demand imbalances and prefer a higher frequency of potential trading opportunities.
Medium Sensitivity -> Balances between detecting significant price movements and avoiding excessive noise. This setting is suitable for most traders who want a moderate number of zones without being overwhelmed.
Low Sensitivity -> Focuses on larger, more significant price movements, resulting in fewer zones being identified. This is ideal for traders who prioritize quality over quantity and prefer to focus on the most impactful supply and demand areas.
Lowest Sensitivity -> Detects only the strongest and most pronounced price movements, identifying the most significant zones. This setting is best for traders who want to focus on high-probability, high-impact zones and avoid minor fluctuations.
Zone Invalidation : The Zone Invalidation setting determines how supply and demand zones are invalidated.
Wick -> A zone is invalidated if a candle’s wick goes below a demand zone or above a supply zone.
Close -> A zone is invalidated if a candle closes below a demand zone or above a supply zone.
Zone Visibility Range : The Zone Visibility Range setting controls how far from the current price supply and demand zones are displayed on the chart. It helps traders focus on relevant zones while avoiding clutter from distant or less impactful areas.
Minimum Zone Width : The Minimum Zone Width setting defines the smallest size a supply or demand zone must have to be displayed on the chart. It uses the Average True Range (ATR) as a reference to ensure zones are proportionate to current market volatility.
Minimum Zone Length : The Minimum Zone Length setting determines the minimum number of bars a supply or demand zone must span to be displayed on the chart. This setting helps filter out short-lived or insignificant zones, ensuring only meaningful areas of supply or demand are highlighted.
2. Tickers
You can set, then enable or disable up to 8 tickers in this section to get informed about their latest supply or demand zone.
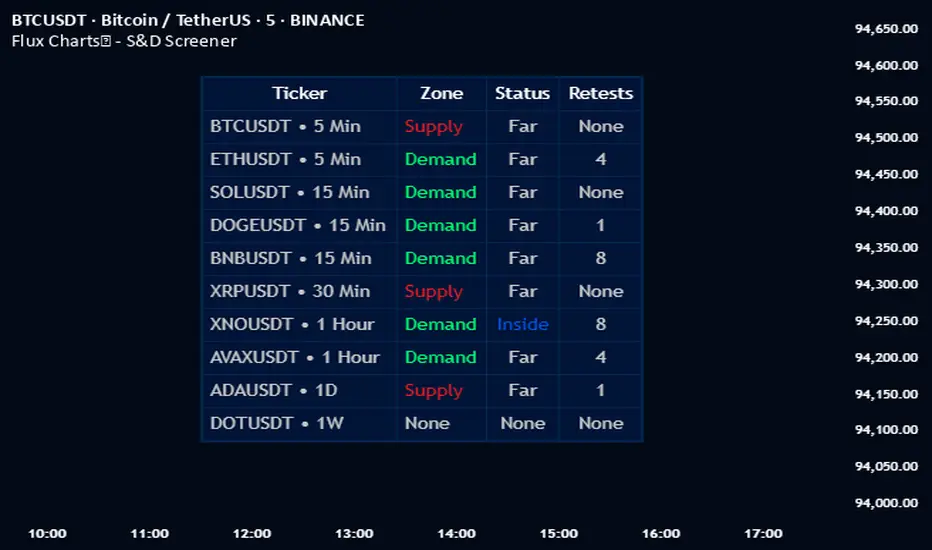
libTFLibrary "libTF"
libTF: Find higher/lower TF automatically
This library to find higher/lower TF from current timeframe(timeframe.period) for Pine Script version6(or higher).
Basic Algorithm
Using a timeframe scale Array and timeframe.in_seconds() function to find higher/lower timeframe.
Return value is na if could not find TF in the timeframe scale.
The timeframe scale could be changed by the parameter 'scale'(CSV).
How to use
1. Set higher/lower TF
higher()/lower() function returns higher/lower TF.
Default timeframe scale is "1, 5, 15, 60, 240, 1D, 1M, 3M, 12M".
example:
htf1 = higher()
htf2 = higher(htf1)
ltf1 = lower()
ltf2 = lower(ltf1)
2. Set higher/lower TF using your timeframe scale
The timeframe scale could be changed by the parameter.
example:
myscale="1,60,1D,1M,12M"
htf1 = higher(timeframe.period,myscale)
htf2 = higher(htf1,myscale)
ltf1 = lower(timeframe.period,myscale)
ltf2 = lower(ltf1,myscale)
3. How to use with request.*() function
na value is set if no higher/lower TF in timeframe scale.
It returns current timeframe's value, when na value as timeframe parameter in request.*().
As bellow, if it should be na when timeframe is na.
example:
return_value_request_htf1 = na(htf1)?na:request.security(syminfo.tickerid,htf1,timeframe.period)
return_value_request_ltf1 = na(ltf1)?na:request.security(syminfo.tickerid,ltf1,timeframe.period)
higher(tf, scale)
higher: find higher TF from TF string.
Parameters:
tf (string) : default value is timeframe.period.
scale (string) : TF scale in CSV. default is "1,5,15,60,240,1D,1W,1M,3M,12M".
Returns: higher TF string.
lower(tf, scale)
lower: find lower TF from TF string.
Parameters:
tf (string) : default value is timeframe.period.
scale (string) : TF scale in CSV. defalut is "1,5,15,60,240,1D,1W,1M,3M,12M".
Returns: lower TF string.

Contraction & Expansion Multi-Screener █ Overview:
The Contraction & Expansion Multi-Screener analyzes market volatility across many symbols. It provides insights into whether a market is contracting or expanding in volatility. With using a range of statistical models for modeling realized volatility, the script calculates, ranks, and monitors the degree of contraction or expansions in market volatility. The objective is to provide actionable insights into the current market phases by using historical data to model current volatility conditions.
This indicator accomplishes this by aggregating a variety of volatility measures, computing ranks, and applying threshold-based methods to identify transitions in market behavior. Volatility itself helps you understand if the market is moving a lot. High volatility or volatility that is increasing over time, means that the price is moving a lot. Volatility also mean reverts so if its extremely low, you can eventually expect it to return to its expected value, meaning there will be bigger price moves, and vice versa.
█ Features of the Indicator
This indicator allows the user to select up to 14 different symbols and retrieve their price data. There is five different types of volatility models that you can choose from in the settings of this indicator for how to use the screener.
Volatility Settings:
Standard Deviation
Relative Standard Deviation
Mean Absolute Deviation
Exponentially Weighted Moving Average (EWMA)
Average True Range (ATR)
Standard Deviation, Mean Absolute Deviation, and EWMA use returns to model the volatility, meanwhile Relative Standard Deviation uses price instead due to its geometric properties, and Average True Range for capturing the absolute movement in price. In this indicator the volatility is ranked, so if the volatility is at 0 or near 0 then it is contracting and the volatility is low. If the volatility is near 100 or at 100 then the volatility is at its maximum.
For traders that use the Forex Master Pattern Indicator 2 and want to use this indicator for that indicator, it is recommended to set your volatility type to Relative Standard Deviation.
Users can also modify the location of the screener to be on the top left, top right, bottom left, or bottom right. You also can disable sections of the screener and show a smaller list if you want to.
The Contraction & Expansion Screener shows you the following information:
Confirmation of whether or not there is a contraction or expansion
Percentage Rank of the volatility
Volatility MA direction: This screener uses moving averages on the volatility to determine if its increasing over time or decreasing over time.
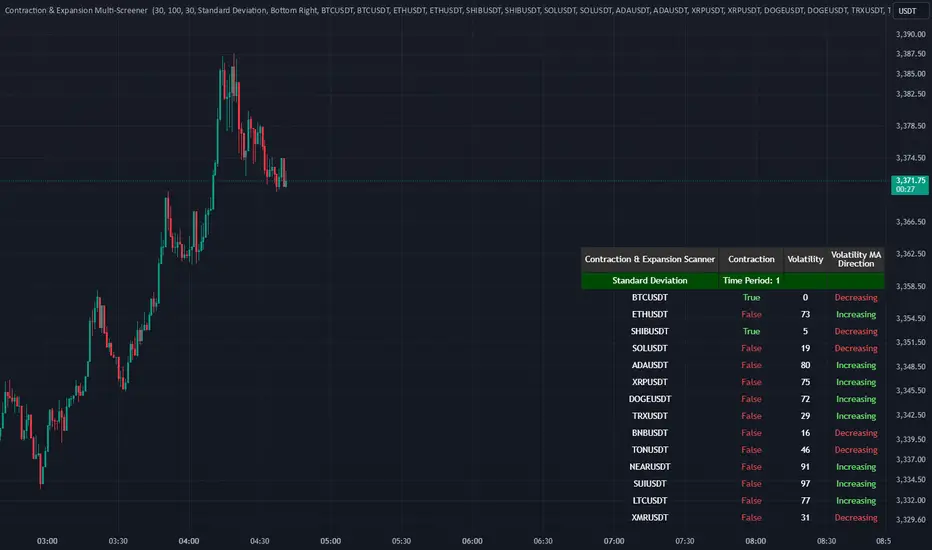
HTFCandlesLibLibrary "HTFCandlesLib"
Library to get detailed higher timeframe candle information
method tostring(this, delimeter)
Returns OHLC values, BarIndex of higher and lower timeframe candles in string format
Namespace types: Candle
Parameters:
this (Candle) : Current Candle object
delimeter (string) : delimeter to join the string components of the candle
Returns: String representation of the Candle
method draw(this, bullishColor, bearishColor, printDescription)
Draws the current candle using boxes and lines for body and wicks
Namespace types: Candle
Parameters:
this (Candle) : Current Candle object
bullishColor (color) : color for bullish representation
bearishColor (color) : color for bearish representation
printDescription (bool) : if set to true prints the description
Returns: Current candle object
getCurrentCandle(ltfCandles)
Gets the current candle along with reassigned ltf components. To be used with request.security to capture higher timeframe candle data
Parameters:
ltfCandles (array) : Lower timeframe Candles array
Returns: Candle object with embedded lower timeframe key candles in them
Candle
Candle represents the data related to a candle
Fields:
o (series float) : Open price of the candle
h (series float) : High price of the candle
l (series float) : Low price of the candle
c (series float) : Close price of the candle
lo (Candle) : Lower timeframe candle that records the open price of the current candle.
lh (Candle) : Lower timeframe candle that records the high price of the current candle.
ll (Candle) : Lower timeframe candle that records the low price of the current candle.
lc (Candle) : Lower timeframe candle that records the close price of the current candle.
barindex (series int) : Bar Index of the candle
bartime (series int) : Bar time of the candle
last (Candle) : Link to last candle of the series if any

TimeLibraryLibrary "TimeLibrary"
TODO: add library description here
Line_Type_Control(Type)
Line_Type_Control: This function changes between common line types options available are "Solid","Dashed","Dotted"
Parameters:
Type (string) : : The string to choose the line type from
Returns: Line_Type : returns the pine script equivalent of the string input
Text_Size_Switch(Text_Size)
Text_Size_Switch : This function changes between common text sizes options are "Normal", "Tiny", "Small", "Large", "Huge", "Auto"
Parameters:
Text_Size (string) : : The string to choose the text type from
Returns: Text_Type : returns the pine script equivalent of the string input
TF(TF_Period, TF_Multip)
TF generates a string representation of a time frame based on the provided time frame unit (`TF_Period`) and multiplier (`TF_Multip`).
Parameters:
TF_Period (simple string)
TF_Multip (simple int)
Returns: A string that represents the time frame in Pine Script format, depending on the `TF_Period`:
- For "Minute", it returns the multiplier as a string (e.g., "5" for 5 minutes).
- For "Hour", it returns the equivalent number of minutes (e.g., "120" for 2 hours).
- For "Day", it appends "D" to the multiplier (e.g., "2D" for 2 days).
- For "Week", it appends "W" to the multiplier (e.g., "1W" for 1 week).
- For "Month", it appends "M" to the multiplier (e.g., "3M" for 3 months).
If none of these cases match, it returns the current chart's time frame.
TF_Display(Chart_as_Timeframe, TF_Period, TF_Multip)
TF_Display generates a string representation of a time frame based on user-defined inputs or the current chart's time frame settings.
Parameters:
Chart_as_Timeframe (bool) : (bool): Determines whether to use the current chart's time frame or a custom time frame.
TF_Period` (string): The time frame unit (e.g., "Minute", "Hour", "Day", "Week", "Month").
TF_Multip` (int): The multiplier for the time frame (e.g., 15 for 15 minutes, 2 for 2 days).
TF_Period (string)
TF_Multip (int)
Returns: If `Chart_as_Timeframe` is `false`, the function returns a time frame string based on the provided `TF_Period` and `TF_Multip` values (e.g., "5Min", "2D").
If `Chart_as_Timeframe` is `true`, the function determines the current chart's time frame and returns it as a string:
For minute-based time frames, it returns the number of minutes with "Min" (e.g., "15Min") unless it's an exact hour, in which case it returns the hour (e.g., "1H").
For daily, weekly, and monthly time frames, it returns the multiplier with the appropriate unit (e.g., "1D" for daily, "1W" for weekly, "1M" for monthly).
MTF_MS_Display(Chart_as_Timeframe, TF_Period, TF_Multip, Swing_Length)
MTF_MS_Display This function calculates and returns a modified swing length value based on the selected time frame and current chart's time frame.
Parameters:
Chart_as_Timeframe (bool)
TF_Period (string)
TF_Multip (int)
Swing_Length (int)
HTF_Structure_Control(Chart_as_Timeframe, Show_Only_On_Lower_Timeframes, TF_Period, TF_Multip)
Parameters:
Chart_as_Timeframe (bool)
Show_Only_On_Lower_Timeframes (bool)
TF_Period (string)
TF_Multip (int)

TimeframeComparisonLibrary "TimeframeComparison"
Timeframe comparison for higher and lower timeframe
█ OVERVIEW
This library is used to compare higher / lower timeframe by using timeframe.multiplier.
minMult()
timeframe multiplier in minutes
Returns: float value

RSI MTF Panel [xdecow]This indicator shows the RSI of up to 10 different timeframes with various customization options:
Panel position
Panel orientation (vertical/horizontal)
Border width and color
Choose up to 10 time frames with RSI length and source
Background and text colors
Thresholds of overbought, oversold, uptrend, downtrend and no-trend zones to change the color of the RSI
Color debug mode

MTF_DrawingsLibrary 'MTF_Drawings'
This library helps with drawing indicators and candle charts on all timeframes.
FEATURES
CHART DRAWING : Library provides functions for drawing High Time Frame (HTF) and Low Time Frame (LTF) candles.
INDICATOR DRAWING : Library provides functions for drawing various types of HTF and LTF indicators.
CUSTOM COLOR DRAWING : Library allows to color candles and indicators based on specific conditions.
LINEFILLS : Library provides functions for drawing linefills.
CATEGORIES
The functions are named in a way that indicates they purpose:
{Ind} : Function is meant only for indicators.
{Hist} : Function is meant only for histograms.
{Candle} : Function is meant only for candles.
{Draw} : Function draws indicators, histograms and candle charts.
{Populate} : Function generates necessary arrays required by drawing functions.
{LTF} : Function is meant only for lower timeframes.
{HTF} : Function is meant only for higher timeframes.
{D} : Function draws indicators that are composed of two lines.
{CC} : Function draws custom colored indicators.
USAGE
Import the library into your script.
Before using any {Draw} function it is necessary to use a {Populate} function.
Choose the appropriate one based on the category, provide the necessary arguments, and then use the {Draw} function, forwarding the arrays generated by the {Populate} function.
This doesn't apply to {Draw_Lines}, {LineFill}, or {Barcolor} functions.
EXAMPLE
import Spacex_trader/MTF_Drawings/1 as tf
//Request lower timeframe data.
Security(simple string Ticker, simple string New_LTF, float Ind) =>
float Value = request.security_lower_tf(Ticker, New_LTF, Ind)
Value
Timeframe = input.timeframe('1', 'Timeframe: ')
tf.Draw_Ind(tf.Populate_LTF_Ind(Security(syminfo.tickerid, Timeframe, ta.rsi(close, 14)), 498, color.purple), 1, true)
FUNCTION LIST
HTF_Candle(BarsBack, BodyBear, BodyBull, BordersBear, BordersBull, WickBear, WickBull, LineStyle, BoxStyle, LineWidth, HTF_Open, HTF_High, HTF_Low, HTF_Close, HTF_Bar_Index)
Populates two arrays with drawing data of the HTF candles.
Parameters:
BarsBack (int) : Bars number to display.
BodyBear (color) : Candle body bear color.
BodyBull (color) : Candle body bull color.
BordersBear (color) : Candle border bear color.
BordersBull (color) : Candle border bull color.
WickBear (color) : Candle wick bear color.
WickBull (color) : Candle wick bull color.
LineStyle (string) : Wick style (Solid-Dotted-Dashed).
BoxStyle (string) : Border style (Solid-Dotted-Dashed).
LineWidth (int) : Wick width.
HTF_Open (float) : HTF open price.
HTF_High (float) : HTF high price.
HTF_Low (float) : HTF low price.
HTF_Close (float) : HTF close price.
HTF_Bar_Index (int) : HTF bar_index.
Returns: Two arrays with drawing data of the HTF candles.
LTF_Candle(BarsBack, BodyBear, BodyBull, BordersBear, BordersBull, WickBear, WickBull, LineStyle, BoxStyle, LineWidth, LTF_Open, LTF_High, LTF_Low, LTF_Close)
Populates two arrays with drawing data of the LTF candles.
Parameters:
BarsBack (int) : Bars number to display.
BodyBear (color) : Candle body bear color.
BodyBull (color) : Candle body bull color.
BordersBear (color) : Candle border bear color.
BordersBull (color) : Candle border bull color.
WickBear (color) : Candle wick bear color.
WickBull (color) : Candle wick bull color.
LineStyle (string) : Wick style (Solid-Dotted-Dashed).
BoxStyle (string) : Border style (Solid-Dotted-Dashed).
LineWidth (int) : Wick width.
LTF_Open (float ) : LTF open price.
LTF_High (float ) : LTF high price.
LTF_Low (float ) : LTF low price.
LTF_Close (float ) : LTF close price.
Returns: Two arrays with drawing data of the LTF candles.
Draw_Candle(Box, Line, Offset)
Draws HTF or LTF candles.
Parameters:
Box (box ) : Box array with drawing data.
Line (line ) : Line array with drawing data.
Offset (int) : Offset of the candles.
Returns: Drawing of the candles.
Populate_HTF_Ind(IndValue, BarsBack, IndColor, HTF_Bar_Index)
Populates one array with drawing data of the HTF indicator.
Parameters:
IndValue (float) : Indicator value.
BarsBack (int) : Indicator lines to display.
IndColor (color) : Indicator color.
HTF_Bar_Index (int) : HTF bar_index.
Returns: An array with drawing data of the HTF indicator.
Populate_LTF_Ind(IndValue, BarsBack, IndColor)
Populates one array with drawing data of the LTF indicator.
Parameters:
IndValue (float ) : Indicator value.
BarsBack (int) : Indicator lines to display.
IndColor (color) : Indicator color.
Returns: An array with drawing data of the LTF indicator.
Draw_Ind(Line, Mult, Exe)
Draws one HTF or LTF indicator.
Parameters:
Line (line ) : Line array with drawing data.
Mult (int) : Coordinates multiplier.
Exe (bool) : Display the indicator.
Returns: Drawing of the indicator.
Populate_HTF_Ind_D(IndValue_1, IndValue_2, BarsBack, IndColor_1, IndColor_2, HTF_Bar_Index)
Populates two arrays with drawing data of the HTF indicators.
Parameters:
IndValue_1 (float) : First indicator value.
IndValue_2 (float) : Second indicator value.
BarsBack (int) : Indicator lines to display.
IndColor_1 (color) : First indicator color.
IndColor_2 (color) : Second indicator color.
HTF_Bar_Index (int) : HTF bar_index.
Returns: Two arrays with drawing data of the HTF indicators.
Populate_LTF_Ind_D(IndValue_1, IndValue_2, BarsBack, IndColor_1, IndColor_2)
Populates two arrays with drawing data of the LTF indicators.
Parameters:
IndValue_1 (float ) : First indicator value.
IndValue_2 (float ) : Second indicator value.
BarsBack (int) : Indicator lines to display.
IndColor_1 (color) : First indicator color.
IndColor_2 (color) : Second indicator color.
Returns: Two arrays with drawing data of the LTF indicators.
Draw_Ind_D(Line_1, Line_2, Mult, Exe_1, Exe_2)
Draws two LTF or HTF indicators.
Parameters:
Line_1 (line ) : First line array with drawing data.
Line_2 (line ) : Second line array with drawing data.
Mult (int) : Coordinates multiplier.
Exe_1 (bool) : Display the first indicator.
Exe_2 (bool) : Display the second indicator.
Returns: Drawings of the indicators.
Barcolor(Box, Line, BarColor)
Colors the candles based on indicators output.
Parameters:
Box (box ) : Candle box array.
Line (line ) : Candle line array.
BarColor (color ) : Indicator color array.
Returns: Colored candles.
Populate_HTF_Ind_D_CC(IndValue_1, IndValue_2, BarsBack, BullColor, BearColor, IndColor_1, HTF_Bar_Index)
Populates two array with drawing data of the HTF indicators with color based on: IndValue_1 >= IndValue_2 ? BullColor : BearColor.
Parameters:
IndValue_1 (float) : First indicator value.
IndValue_2 (float) : Second indicator value.
BarsBack (int) : Indicator lines to display.
BullColor (color) : Bull color.
BearColor (color) : Bear color.
IndColor_1 (color) : First indicator color.
HTF_Bar_Index (int) : HTF bar_index.
Returns: Three arrays with drawing and color data of the HTF indicators.
Populate_LTF_Ind_D_CC(IndValue_1, IndValue_2, BarsBack, BullColor, BearColor, IndColor_1)
Populates two arrays with drawing data of the LTF indicators with color based on: IndValue_1 >= IndValue_2 ? BullColor : BearColor.
Parameters:
IndValue_1 (float ) : First indicator value.
IndValue_2 (float ) : Second indicator value.
BarsBack (int) : Indicator lines to display.
BullColor (color) : Bull color.
BearColor (color) : Bearcolor.
IndColor_1 (color) : First indicator color.
Returns: Three arrays with drawing and color data of the LTF indicators.
Populate_HTF_Hist_CC(HistValue, IndValue_1, IndValue_2, BarsBack, BullColor, BearColor, HTF_Bar_Index)
Populates one array with drawing data of the HTF histogram with color based on: IndValue_1 >= IndValue_2 ? BullColor : BearColor.
Parameters:
HistValue (float) : Indicator value.
IndValue_1 (float) : First indicator value.
IndValue_2 (float) : Second indicator value.
BarsBack (int) : Indicator lines to display.
BullColor (color) : Bull color.
BearColor (color) : Bearcolor.
HTF_Bar_Index (int) : HTF bar_index
Returns: Two arrays with drawing and color data of the HTF histogram.
Populate_LTF_Hist_CC(HistValue, IndValue_1, IndValue_2, BarsBack, BullColor, BearColor)
Populates one array with drawing data of the LTF histogram with color based on: IndValue_1 >= IndValue_2 ? BullColor : BearColor.
Parameters:
HistValue (float ) : Indicator value.
IndValue_1 (float ) : First indicator value.
IndValue_2 (float ) : Second indicator value.
BarsBack (int) : Indicator lines to display.
BullColor (color) : Bull color.
BearColor (color) : Bearcolor.
Returns: Two array with drawing and color data of the LTF histogram.
Populate_LTF_Hist_CC_VA(HistValue, Value, BarsBack, BullColor, BearColor)
Populates one array with drawing data of the LTF histogram with color based on: HistValue >= Value ? BullColor : BearColor.
Parameters:
HistValue (float ) : Indicator value.
Value (float) : First indicator value.
BarsBack (int) : Indicator lines to display.
BullColor (color) : Bull color.
BearColor (color) : Bearcolor.
Returns: Two array with drawing and color data of the LTF histogram.
Populate_HTF_Ind_CC(IndValue, IndValue_1, BarsBack, BullColor, BearColor, HTF_Bar_Index)
Populates one array with drawing data of the HTF indicator with color based on: IndValue >= IndValue_1 ? BullColor : BearColor.
Parameters:
IndValue (float) : Indicator value.
IndValue_1 (float) : Second indicator value.
BarsBack (int) : Indicator lines to display.
BullColor (color) : Bull color.
BearColor (color) : Bearcolor.
HTF_Bar_Index (int) : HTF bar_index
Returns: Two arrays with drawing and color data of the HTF indicator.
Populate_LTF_Ind_CC(IndValue, IndValue_1, BarsBack, BullColor, BearColor)
Populates one array with drawing data of the LTF indicator with color based on: IndValue >= IndValue_1 ? BullColor : BearColor.
Parameters:
IndValue (float ) : Indicator value.
IndValue_1 (float ) : Second indicator value.
BarsBack (int) : Indicator lines to display.
BullColor (color) : Bull color.
BearColor (color) : Bearcolor.
Returns: Two arrays with drawing and color data of the LTF indicator.
Draw_Lines(BarsBack, y1, y2, LineType, Fill)
Draws price lines on indicators.
Parameters:
BarsBack (int) : Indicator lines to display.
y1 (float) : Coordinates of the first line.
y2 (float) : Coordinates of the second line.
LineType (string) : Line type.
Fill (color) : Fill color.
Returns: Drawing of the lines.
LineFill(Upper, Lower, BarsBack, FillColor)
Fills two lines with linefill HTF or LTF.
Parameters:
Upper (line ) : Upper line.
Lower (line ) : Lower line.
BarsBack (int) : Indicator lines to display.
FillColor (color) : Fill color.
Returns: Linefill of the lines.
Populate_LTF_Hist(HistValue, BarsBack, HistColor)
Populates one array with drawing data of the LTF histogram.
Parameters:
HistValue (float ) : Indicator value.
BarsBack (int) : Indicator lines to display.
HistColor (color) : Indicator color.
Returns: One array with drawing data of the LTF histogram.
Populate_HTF_Hist(HistValue, BarsBack, HistColor, HTF_Bar_Index)
Populates one array with drawing data of the HTF histogram.
Parameters:
HistValue (float) : Indicator value.
BarsBack (int) : Indicator lines to display.
HistColor (color) : Indicator color.
HTF_Bar_Index (int) : HTF bar_index.
Returns: One array with drawing data of the HTF histogram.
Draw_Hist(Box, Mult, Exe)
Draws HTF or LTF histogram.
Parameters:
Box (box ) : Box Array.
Mult (int) : Coordinates multiplier.
Exe (bool) : Display the histogram.
Returns: Drawing of the histogram.

libHTF[without request.security()]Library "libHTF"
libHTF: use HTF values without request.security()
This library enables to use HTF candles without request.security().
Basic data structure
Using to access values in the same manner as series variable.
The last member of HTF array is always latest current TF's data.
If new bar in HTF(same as last bar closes), new member is pushed to HTF array.
2nd from the last member of HTF array is latest fixed(closed) bar.
HTF: How to use
1. set TF
tf_higher() function selects higher TF. TF steps are ("1","5","15","60","240","D","W","M","3M","6M","Y").
example:
tfChart = timeframe.period
htf1 = tf_higher(tfChart)
2. set HTF matrix
htf_candle() function returns 1 bool and 1 matrix.
bool is a flag for start of new candle in HTF context.
matrix is HTF candle data(0:open,1:time_open,2:close,3:time_close,4:high,5:time:high,6:low,7:time_low).
example:
=htf_candle(htf1)
3. how to access HTF candle data
you can get values using .lastx() method.
please be careful, return value is always float evenif it is "time". you need to cast to int time value when using for xloc.bartime.
example:
htf1open=m1.lastx("open")
htf1close=m1.lastx("close")
//if you need to use histrical value.
lastopen=open
lasthtf1open=m1.lastx("open",1)
4. how to store Data of HTF context
you have to use array to store data of HTF context.
array.htf_push() method handles the last member of array. if new_bar in HTF, it push new member. otherwise it set value to the last member.
example:
array a_close=array.new(1,na)
a_close.htf_push(b_new_bar1,m1.lastx("close"))
HTFsrc: How to use
1. how to setup src.
set_src() function is set current tf's src from string(open/high/low/close/hl2/hlc3/ohlc4/hlcc4).
set_htfsrc() function returns src array of HTF candle.
example:
_src="ohlc4"
src=set_src(_src)
htf1src=set_htfsrc(_src,b_new_bar1,m1)
(if you need to use HTF src in series float)
s_htf1src=htf1src.lastx()
HighLow: How to use
1. set HTF arrays
highlow() and htfhighlow() function calculates high/low and return high/low prices and time.
the functions return 1 int and 8arrays.
int is a flag for new high(1) or new low(-1).
arrays are high/low and return high/low data. float for price, int for time.
example
=
highlow()
=
htfhighlow(m1)
2. how to access HighLow data
you can get values using .lastx() method.
example:
if i_renew==1
myhigh=a_high.lastx()
//if you need to use histrical value.
myhigh=a_high.lastx(1)
other functions
functions for HTF candle matrix or HTF src array in this script are
htf_sma()/htf_ema()/htf_rma()
htf_rsi()/htf_rci()/htf_dmi()
method lastx(arrayid, lastindex)
method like array.last. it returns lastindex from the last member, if parameter is set.
Namespace types: float
Parameters:
arrayid (float )
lastindex (int) : (int) default value is "0"(the last member). if you need to access historical value, increment it(same manner as series vars).
Returns: float value of lastindex from the last member of the array. returns na, if fail.
method lastx(arrayid, lastindex)
method like array.last. it returns lastindex from the last member, if parameter is set.
Namespace types: int
Parameters:
arrayid (int )
lastindex (int) : (int) default value is "0"(the last member). if you need to access historical value, increment it(same manner as series vars).
Returns: int value of lastindex from the last member of the array. returns na, if fail.
method lastx(m, _type, lastindex)
method for handling htf matrix.
Namespace types: matrix
Parameters:
m (matrix) : (matrix) matrix for htf candle.
_type (string) : (string) value type of htf candle:
lastindex (int) : (int) default value is "0"(the last member).
Returns: (float) value of htf candle. (caution: need to cast float to int to use time values!)
method set_last(arrayid, val)
method to set a value of the last member of the array. it sets value to the last member.
Namespace types: float
Parameters:
arrayid (float )
val (float) : (float) value to set.
Returns: nothing
method htf_push(arrayid, b, val)
method to push new member to htf context. if new bar in htf, it works as push. else it works as set_last.
Namespace types: float
Parameters:
arrayid (float )
b (bool) : (bool) true:push,false:set_last
val (float) : (float) _f the value to set.
Returns: nothing
method tf_higher(tf)
method to set higher tf from tf string. TF steps are .
Namespace types: series string, simple string, input string, const string
Parameters:
tf (string) : (string) tf string
Returns: (string) string of higher tf.
htf_candle(_tf, _TZ)
build htf candles
Parameters:
_tf (string) : (string) tf string.
_TZ (string) : of timezone. default value is "GMT+3".
Returns: bool for new bar@htf and matrix for snapshot of htf candle
set_src(_src_type)
set src.
Parameters:
_src_type (string) : (string) type of source:
Returns: (series float) src value
set_htfsrc(_src_type, _nb, _m)
set htf src.
Parameters:
_src_type (string) : (string) type of source:
_nb (bool) : (bool) flag of new bar
_m (matrix) : (matrix) matrix for htf candle.
Returns: (array) array of src value
is_up()
last_is_up()
peak_bottom(_latest, _last)
Parameters:
_latest (bool)
_last (bool)
htf_is_up(_m)
Parameters:
_m (matrix)
htf_last_is_up(_m)
Parameters:
_m (matrix)
highlow(_b_bartime_price)
Parameters:
_b_bartime_price (bool)
htfhighlow(_m, _b_bartime_price)
Parameters:
_m (matrix)
_b_bartime_price (bool)
htf_sma(_a_src, _len)
Parameters:
_a_src (float )
_len (int)
htf_rma(_a_src, _new_bar, _len)
Parameters:
_a_src (float )
_new_bar (bool)
_len (int)
htf_ema(_a_src, _new_bar, _len)
Parameters:
_a_src (float )
_new_bar (bool)
_len (int)
htf_rsi(_a_src, _new_bar, _len)
Parameters:
_a_src (float )
_new_bar (bool)
_len (int)
rci(_src, _len)
Parameters:
_src (float)
_len (int)
htf_rci(_a_src, _len)
Parameters:
_a_src (float )
_len (int)
htf_dmi(_m, _new_bar, _len, _ma_type)
Parameters:
_m (matrix)
_new_bar (bool)
_len (int)
_ma_type (string)

lower_tf█ OVERVIEW
This library is a Pine programmer’s tool containing functions to help those who use the request.security_lower_tf() function. Its `ltf()` function helps translate user inputs into a lower timeframe string usable with request.security_lower_tf() . Another function, `ltfStats()`, accumulates statistics on processed chart bars and intrabars.
█ CONCEPTS
Chart bars
Chart bars , as referred to in our publications, are bars that occur at the current chart timeframe, as opposed to those that occur at a timeframe that is higher or lower than that of the chart view.
Intrabars
Intrabars are chart bars at a lower timeframe than the chart's. Each 1H chart bar of a 24x7 market will, for example, usually contain 60 intrabars at the LTF of 1min, provided there was market activity during each minute of the hour. Mining information from intrabars can be useful in that it offers traders visibility on the activity inside a chart bar.
Lower timeframes (LTFs)
A lower timeframe is a timeframe that is smaller than the chart's timeframe. This framework exemplifies how authors can determine which LTF to use by examining the chart's timeframe. The LTF determines how many intrabars are examined for each chart bar; the lower the timeframe, the more intrabars are analyzed.
Intrabar precision
The precision of calculations increases with the number of intrabars analyzed for each chart bar. As there is a 100K limit to the number of intrabars that can be analyzed by a script, a trade-off occurs between the number of intrabars analyzed per chart bar and the chart bars for which calculations are possible.
█ `ltf()`
This function returns a timeframe string usable with request.security_lower_tf() . It calculates the returned timeframe by taking into account a user selection between eight different calculation modes and the chart's timeframe. You send it the user's selection, along with the text corresponding to the eight choices from which the user has chosen, and the function returns a corresponding LTF string.
Because the function processes strings and doesn't require recalculation on each bar, using var to declare the variable to which its result is assigned will execute the function only once on bar zero and speed up your script:
var string ltfString = ltf(ltfModeInput, LTF1, LTF2, LTF3, LTF4, LTF5, LTF6, LTF7, LTF8)
The eight choices users can select from are of two types: the first four allow a selection from the desired amount of chart bars to be covered, the last four are choices of a fixed number of intrabars to be analyzed per chart bar. Our example code shows how to structure your input call and then make the call to `ltf()`. By changing the text associated with the `LTF1` to `LTF8` constants, you can tailor it to your preferences while preserving the functionality of `ltf()` because you will be sending those string constants as the function's arguments so it can determine the user's selection. The association between each `LTFx` constant and its calculation mode is fixed, so the order of the arguments is important when you call `ltf()`.
These are the first four modes and the `LTFx` constants corresponding to each:
Covering most chart bars (least precise) — LTF1
Covers all chart bars. This is accomplished by dividing the current timeframe in seconds by 4 and converting that number back to a string in timeframe.period format using secondsToTfString() . Due to the fact that, on premium subscriptions, the typical historical bar count is between 20-25k bars, dividing the timeframe by 4 ensures the highest level of intrabar precision possible while achieving complete coverage for the entire dataset with the maximum allowed 100K intrabars.
Covering some chart bars (less precise) — LTF2
Covering less chart bars (more precise) — LTF3
These levels offer a stepped LTF in relation to the chart timeframe with slightly more, or slightly less precision. The stepped lower timeframe tiers are calculated from the chart timeframe as follows:
Chart Timeframe Lower Timeframe
Less Precise More Precise
< 1hr 1min 1min
< 1D 15min 1min
< 1W 2hr 30min
> 1W 1D 60min
Covering the least chart bars (most precise) — LTF4
Analyzes the maximum quantity of intrabars possible by using the 1min LTF, which also allows the least amount of chart bars to be covered.
The last four modes allow the user to specify a fixed number of intrabars to analyze per chart bar. Users can choose from 12, 24, 50 or 100 intrabars, respectively corresponding to the `LTF5`, `LTF6`, `LTF7` and `LTF8` constants. The value is a target; the function will do its best to come up with a LTF producing the required number of intrabars. Because of considerations such as the length of a ticker's session, rounding of the LTF to the closest allowable timeframe, or the lowest allowable timeframe of 1min intrabars, it is often impossible for the function to find a LTF producing the exact number of intrabars. Requesting 100 intrabars on a 60min chart, for example, can only produce 60 1min intrabars. Higher chart timeframes, tickers with high liquidity or 24x7 markets will produce optimal results.
█ `ltfStats()`
`ltfStats()` returns statistics that will be useful to programmers using intrabar inspection. By analyzing the arrays returned by request.security_lower_tf() in can determine:
• intrabarsInChartBar : The number of intrabars analyzed for each chart bar.
• chartBarsCovered : The number of chart bars where intrabar information is available.
• avgIntrabars : The average number of intrabars analyzed per chart bar. Events like holidays, market activity, or reduced hours sessions can cause the number of intrabars to vary, bar to bar.
The function must be called on each bar to produce reliable results.
█ DEMONSTRATION CODE
Our example code shows how to provide users with an input from which they can select a LTF calculation mode. If you use this library's functions, feel free to reuse our input setup code, including the tooltip providing users with explanations on how it works for them.
We make a simple call to request.security_lower_tf() to fetch the close values of intrabars, but we do not use those values. We simply send the returned array to `ltfStats()` and then plot in the indicator's pane the number of intrabars examined on each bar and its average. We also display an information box showing the user's selection of the LTF calculation mode, the resulting LTF calculated by `ltf()` and some statistics.
█ NOTES
• As in several of our recent publications, this script uses secondsToTfString() to produce a timeframe string in timeframe.period format from a timeframe expressed in seconds.
• The script utilizes display.data_window and display.status_line to restrict the display of certain plots.
These new built-ins allow coders to fine-tune where a script’s plot values are displayed.
• We implement a new recommended best practice for tables which works faster and reduces memory consumption.
Using this new method, tables are declared only once with var , as usual. Then, on bar zero only, we use table.cell() calls to populate the table.
Finally, table.set_*() functions are used to update attributes of table cells on the last bar of the dataset.
This greatly reduces the resources required to render tables. We encourage all Pine Script™ programmers to do the same.
Look first. Then leap.
█ FUNCTIONS
The library contains the following functions:
ltf(userSelection, choice1, choice2, choice3, choice4, choice5, choice6, choice7, choice8)
Selects a LTF from the chart's TF, depending on the `userSelection` input string.
Parameters:
userSelection : (simple string) User-selected input string which must be one of the `choicex` arguments.
choice1 : (simple string) Input selection corresponding to "Least precise, covering most chart bars".
choice2 : (simple string) Input selection corresponding to "Less precise, covering some chart bars".
choice3 : (simple string) Input selection corresponding to "More precise, covering less chart bars".
choice4 : (simple string) Input selection corresponding to "Most precise, 1min intrabars".
choice5 : (simple string) Input selection corresponding to "~12 intrabars per chart bar".
choice6 : (simple string) Input selection corresponding to "~24 intrabars per chart bar".
choice7 : (simple string) Input selection corresponding to "~50 intrabars per chart bar".
choice8 : (simple string) Input selection corresponding to "~100 intrabars per chart bar".
Returns: (simple string) A timeframe string to be used with `request.security_lower_tf()`.
ltfStats()
Returns statistics about analyzed intrabars and chart bars covered by calls to `request.security_lower_tf()`.
Parameters:
intrabarValues : (float [ ]) The ID of a float array containing values fetched by a call to `request.security_lower_tf()`.
Returns: A 3-element tuple: [ (series int) intrabarsInChartBar, (series int) chartBarsCovered, (series float) avgIntrabars ].

Ultimate Custom MTF ScreenerThis indicator will allow you to make your custom TradingView MTF screener without coding. Add it to the chart, select up to 10 instruments, 4 timeframes, and 4 indicators, and the screener will do the rest for you. The indicator will form a lovely table with all values and highlighted signals.
The screener is highly customizable, and you can choose its position on the chart, sorting, order of the columns, and colors for the tables. You can easily change parameters for all supported indicators and their signals.
Currently, there are 21 different custom indicators available. Current list of indicators:
Average Directional Index (ADX) - displaying the value of ADX and checking if it's higher than the threshold
Average True Range (ATR) - showing the value of ATR
Awesome Oscillator (AO) - displaying the value of AO and highlighting positive/negative values.
Bollinger Bands (BB) - showing if the price is above/below/in the channel.
Breakout Pivots - Displaying when the price is below/above the most recent pivot low/high.
Commodity Channel Index (CCI) - shows the last CCI value and highlights overbought/oversold values.
Directional Movement Index (DMI) - Up/Down signal (+DI above or below -DI)
Donchian Channel (DC) - showing if the price is above/below/in the channel.
Heikin Ashi Count (HAC) - What is the current Heikin Ashi candle color and for how long was this color?
Historical Volatility (HV) - Current value of Historical Volatility
Keltner Channel (KC) -showing if the price is above/below/in the channel.
Moving Average Convergence Divergence (MACD) - Up/Down signal (MACD above / below signal)
Moving Average Crossover (MA Cross) - Displaying MA crosses signals (SMA, EMA, WMA, HMA, VWMA, SMMA, DEMA, VWAP supported)
Moving Average Distance (MA DIST) - Displaying distance to the MA (SMA, EMA, WMA, HMA, VWMA, SMMA, DEMA, VWAP supported)
Parabolic Stop and Reverse (PSAR) - Up or Down
Relative Strength Index (RSI) - Displaying the last RSI value and highlighting overbought/oversold values.
Stochastic (STOCH) - Displaying the last Stochastic value and highlighting overbought/oversold values.
Stochastic RSI (STOCH RSI) - Displaying the last Stochastic RSI value and highlighting overbought/oversold values.
SuperTrend - Current state of the SuperTrend.
Trailing Stop-Loss (TSL) - Up or Down
True Strength Index (TSI) - Displaying the last TSI value and highlighting overbought/oversold values.
We're already working on adding a few more supported indicators. If you have any ideas about the indicators you want to see in our screener, contact us, and we'll consider them.
Disclaimer
Please remember that past performance may not be indicative of future results.
Due to various factors, including changing market conditions, the strategy may no longer perform as well as in historical backtesting.
This post and the script don’t provide any financial advice.
