[JR] Multi Bollinger Heat BandsBollinger Bands, with incremented additional outer bands.
Set as you would normally, but with the addition of an incremental value for the added outer bands.
Defaults with Length 20, base multiplier of 2.0, and an Increment value of 0.5 for additional outer bands at 2.5 and 3.0. Adjust values to suite your needs.
All lines and zones have colour and formatting options available - because why not eh?
Multi

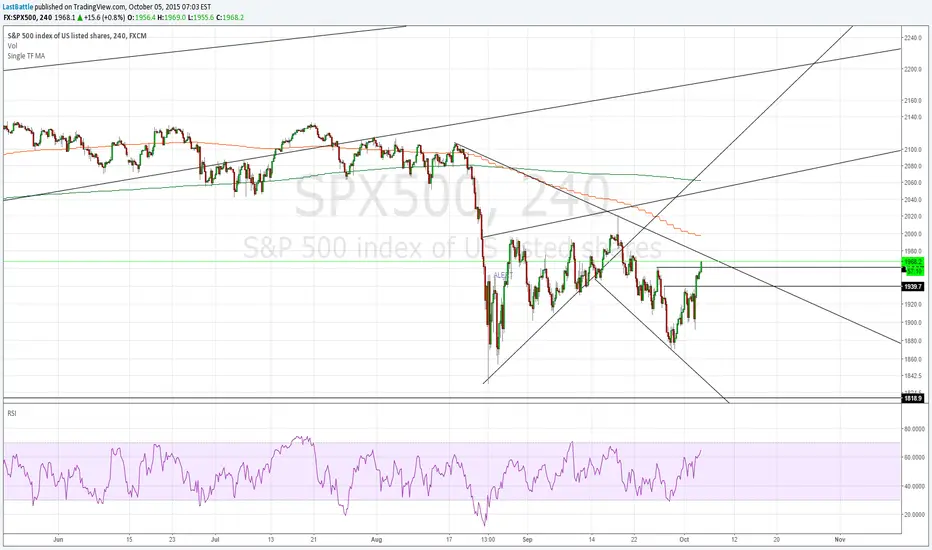
Single Timeframe Moving AverageProvides Moving average of 200 and 50 at the specific timeframe regardless of what interval you're looking at.
Saving the need to change it manually each time you switch the interval.
In this chart, I am looking at 4H interval with EMA of 50/200 of daily timeframe.
Stocks Box (by ChartArt)Get a multi-time frame (MTF) view of the price!
You can select to see either close price (default), or HL2 price, or HLC3 price, or OHLC4 price of all time-frames.And you change the smoothing method (and smoothing period) of the daily price, which is shown as a blue line, with period 10 WMA smoothing as default.
P:S. I had the drawings on the chart hidden, because they have nothing to do with the indicator, but with publishing the script they showed up again :(
Multi Timeframe MACDThis will show you the MACD (no Signal Line) of the higher timeframes (up to 4h). Current Timeframe is colored blue, higher timeframes are colored from light gray to darker gray (you can change that).

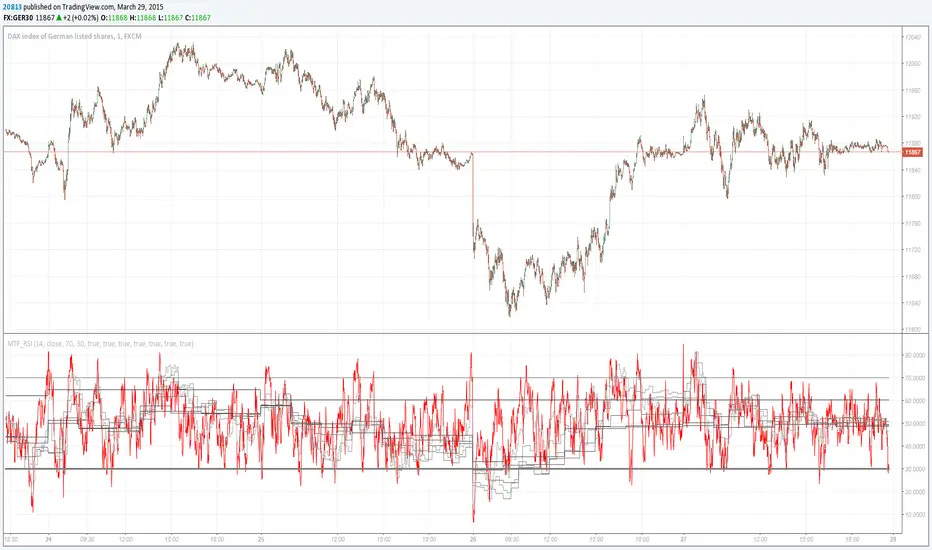
Multi Timeframe RSIThis will show you the RSI of the higher timeframes (up to 1D). Current Timeframe is colored red, higher timeframes are colored from light gray to darker gray (you can change that).
There are several ways to enter a trade:
1. look for rising RSI on higher timeframe (line is stepping up in indicator window), wait for current RSI to decline to oversold (with length 14 its below 30), look for a buy entry (vice versa for a sell setup)
2. look for all RSI timeframes to decline to oversold, this is a good zone to enter a buy (vice versa for a sell setup)
Keep in Mind that a Stochastic Indicator can have it's High/Low befor Price will have it.
Good Luck :)

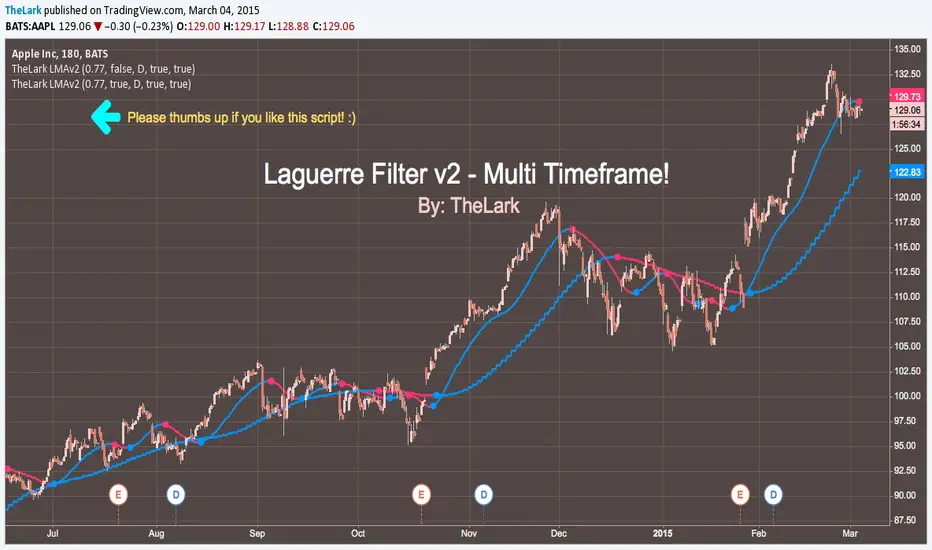
TheLark LMA (Laguerre) v2 - multi timeframeWhat's new?
v2 has added multi timeframe support.
Blatantly stole Chris Moody's code for multi timeframe, because why re-invent the wheel? Thanks Chris ;P
BUT -- modified the coloring to work correctly with higher timeframes, just another Lark hack, so it's a give and take :)
_____________________________
The Laguerre Average (filter) was discovered by John Ehlers.
It's a newer type of averaging that is meant to take out as much of the
inherent lag that your typical EMA and SMA's give at the start of a major trend change.
So what you get is an average that turns more quickly at major trend changes,
and doesn't get tripped up on the noise (as much).
_____________________________
Please thumbs up/ star/ whatever this script if you like it & use it!
See my profile for more scripts, & be sure to follow for future releases.
Sorry for my hiatus, extremely busy these days working on both my own and client work.
This script was a user request.
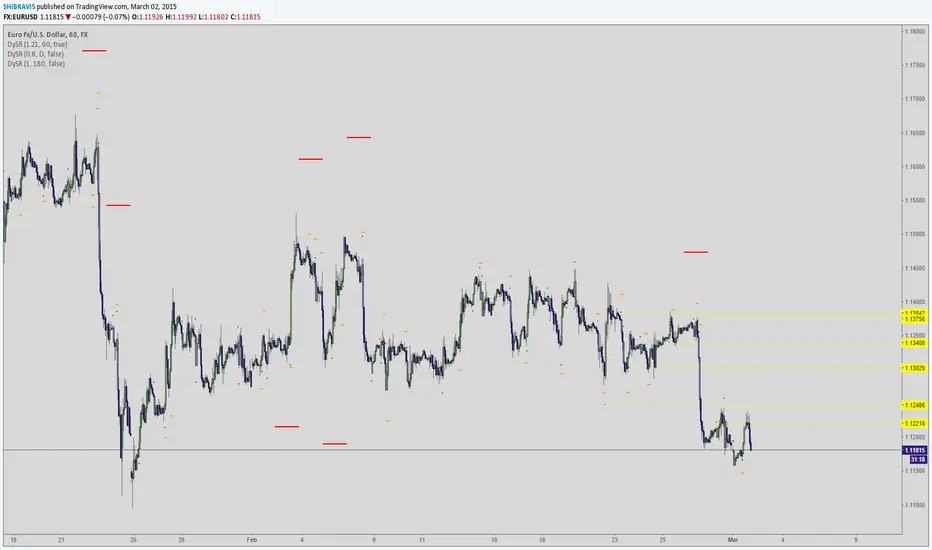
Dynamic SUPRES Multi Timeframe UpdateDynamic SUPRES can be interpreted in different ways. Each square marks an area of congestion that could serve as support and resistance.
FLASH UPDATE: Now is possible to choose the timeframe and the bars color on/off.
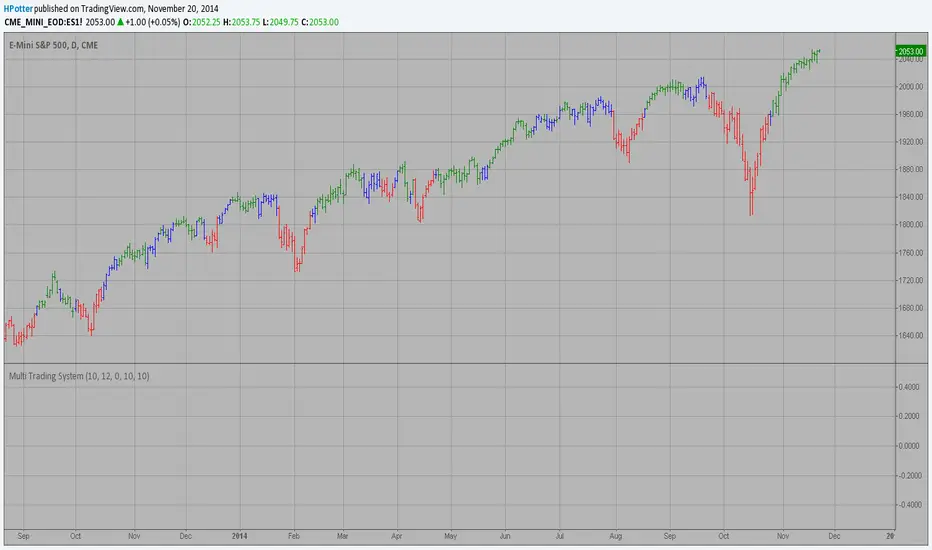
MultiTradingSystemThis is example to show how you can combine two and more strategies for get
a cumulative signal. Result signal will return 1 if two (or more) strategies
is long, -1 if all strategies is short and 0 if signals of strategies is not equal.
First strategy
Chaikin's Volatility indicator compares the spread between a security's
high and low prices. It quantifies volatility as a widening of the range
between the high and the low price.
You can use in the xPrice1 and xPrice2 any series: Open, High, Low, Close, HL2,
HLC3, OHLC4 and ect...
Secon strategy
The Moving Average Crossover trading strategy is possibly the most popular
trading strategy in the world of trading. First of them were written in the
middle of XX century, when commodities trading strategies became popular.
This strategy is a good example of so-called traditional strategies.
Traditional strategies are always long or short. That means they are never
out of the market. The concept of having a strategy that is always long or
short may be scary, particularly in today’s market where you don’t know what
is going to happen as far as risk on any one market. But a lot of traders
believe that the concept is still valid, especially for those of traders who
do their own research or their own discretionary trading.
This version uses crossover of moving average and its exponential moving average.
Multi-Functional Fisher Transform MTF with MACDL TRIGGERWhat this indicator gives you is a true signal when price is exhausted and ready for a fast turnaround. Fisher Transform is set for multi-time frame and also allows the user to change the length. This way a user can compare two or more time spans and lengths to look for these MACDL divergent triggers after a Fisher exhaustion. With so many indicators, it's probably best to merge these indicators and change the Fisher and Trigger colors so you can still have a look at price action (remember to scale right after merger). I've noticed from time to time when you have Fisher 34 100 and 300 up and running on two different time frames such as 5 and 15 min charts, with MACDL triggers on the 100/300 or 34/100 you get a high probability trade trigger. However, there are rare exceptions such as when price moves in a parabolic state up or down for a long period where this indication does not work. Ideally this indicator works best in a sideways market or slow rising/descending moving market.
This indicator was worked on by Glaz, nmike and myself
LazyBear also introduced the MACDL indicator

True Strength Indicator MTFHere is an example of a script showing a multi-time frame of TSI.
Chart below compares FX EURUSD Daily TSI to 1H TSI
Here is an updated version
study("True Strength Indicator MTF", shorttitle="TSI MTF")
resCustom = input(title="Timeframe", type=resolution, defval="60" )
long = input(title="Long Length", type=integer, defval=25)
short = input(title="Short Length", type=integer, defval=13)
signal = input(title="Signal Length", type=integer, defval=13)
price = close
double_smooth(src, long, short) =>
fist_smooth = ema(src, long)
ema(fist_smooth, short)
pc = change(price)
double_smoothed_pc = double_smooth(pc, long, short)
double_smoothed_abs_pc = double_smooth(abs(pc), long, short)
tsi_value = 100 * (double_smoothed_pc / double_smoothed_abs_pc)
tsi = security(tickerid, resCustom,tsi_value)
plot(tsi, color=black)
plot(ema(tsi, signal), color=red)
hline(0, title="Zero")

Fisher Transform MTFThis is a simple code that allows a user to use Fisher Transform Indicator for multiple time frames.

CM_Ultimate RSI Multi Time FrameAvailable Options on Inputs Tab!!!
RSI with ability to change first RSI to a different Time Frame.(Defaults To Current Chart Time Frame).
Ability To Turn On/Off Background Highlighting if First RSI is Above/Below 70 or 30 Lines.
Ability To Turn On/Off Background Highlighting When First RSI Crosses Above 30 Or Below 70.
Ability To Turn On/Off "B" Or "S" When First RSI Crosses Above 30 Or Below 70.
Ability To Turn On/Off Mid -Line Plot.
Option To Plot 2nd RSI to show different Time Frames on same chart!!!
Ability To Use Different Look Back Period If You Plot 2nd RSI.

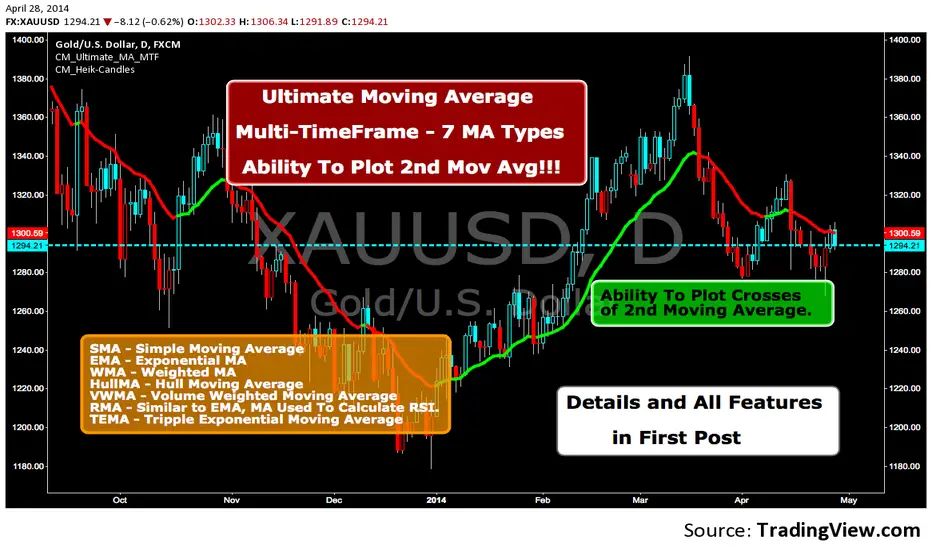
Ultimate Moving Average-Multi-TimeFrame-7 MA TypesAll Moving Averages and Features Built In To ONE Indicator. The Only Moving Average Indicator You Will Need. Details In 1st Post.