Strategy - DMI Indicator with DPO Indicator as a GuardThe Directional Movement Index Indicator is one of my favorite indicators in tradingview's built-in library. It is free to use for all
For more information on what the DMI is, please visit: www.tradingview.com
The only problem I've come across with the DMI is that when it hits a 'trade range zone' it triggers false new trends (this is the case with almost every indicator I've ever tested).
This script modifies the DMI by removing the need for the ADX logic. It only focuses on the +DI and the -DI.
In order to remove the 'noise' generated during a trade range zone I have added another powerful indicator called the Detrended Price Oscillator.
The DPO is also a 'built-in' indicator on tradingview. www.tradingview.com
The DPO is used in conjunction with the DMI to stop trade ranges from wrecking your profits.
This strategy logic simply checks for the DMI indicator to cross itself. If the +DI crosses over the -DI this is a bullish cross and visa versa, if the -DI crosses over the +DI then it could mean bearish sentiment is building.
But then strategy logic uses the DPO to check if the DPO is above 0 or below 0 value
If the +DI crosses over the -DI and the DPO is above 0 value, then it's a Long entry point.
However, if the +DI crosses over the -DI and the DPO is below 0 value, then the Long signal is void.
And visa versa, if the -DI crosses over the +DI and the DPO is below 0 value, then it's a Short entry point (unless the DPO is greater than 0)
With this DPO 'guard' in place, it helps us keep the total trades executed to a minimum.
This is vital to push through trade ranges that can wreck your profit potential.
I wish I could create a better plotting mechanism for this indicator so you can better see the visuals. But combining the DMI to scale with the DPO is not possible.
The best solution is to simply add another DMI indicator to your chart so you can compare the DMI to this script that is dominated by the DPO (yellow line).
Enjoy! Likes are much appreciated!
Oscillateurs

DRSI DMA Scalping Strategy No RepaintThis strategy compares the slope of a Moving Average (of your choosing) to the slope of a Momentum Indicator (of your choosing). Zero is the center line because 0 slope means sideways movement. When both lines cross your buy threshold, it buys. When both lines cross your Sell threshold, it sells. The lines may look choppy, but that is probably because it is referencing a different timeframe than what the chart is set to. I left as many settings adjustable by the user as possible so you can tune this strategy to the relative behavior of whatever you are trading.
This also includes a No Repaint function so the backtest should be as close to live trading as possible.

[KL] Bollinger bands + RSI StrategyThis strategy is based on two of my previous scripts, one called “RSI14 + 10”; the other one called “Bollinger Bands Consolidation”. At its core, it combines the main setups from each of those two scripts but excludes the auxiliary features that were considered as experimental. This strategy will identify periods of squeeze, and then enter long during consolidation with a trailing stop loss set.
Primary indicator will be the Bollinger Bands. By comparing the width of the BBs with the ATR of the same lookback period (i.e. 2 standard deviations of the 20 recent closing prices vs ATR(20) x2), we begin to look for confirmation for entry whenever the standard deviation of prices is less than the ATR. This can be seen visually in the plots (i.e. default gray lines representing ATRx2 relative to BB center line).
Confirmation for entry will be the RSIs (slow-14, and fast-10). If both are upward sloping, then we assume prices are in an uptrend and may eventually break above upper band. RSIs are typically in mid-range when prices are consolidating, therefore no need to measure it.
Exits will happen in two cases, (1) when trailing stop loss hits, or (2) when RSIs signal that the instrument is overbought. No. 1 is self-explanatory. No. 2 happens, when RSI14 reaches above 70 (can be changed), followed by RSI10 catching up and surpassing RSI14.

MACD, RSI, & RVOL Strategy
This strategy combines the use of MACD (12, 26, 9), RSI (14, 30, 70), and RVOL (14) to create Long Buy and Sell signals. This works well with many different time intervals but was developed with 15-minute intervals in mind.
Using MACD as a reference, the strategy identifies when the MACD line crosses over (a factor in a buy signal) and under (a factor in a Sell signal) the Signal line. This shows a shift in positive (cross over) and negative (cross under) of a security.
Using the Relative Strength Index ( RSI ) as an indicator, the strategy notices when the velocity and magnitude of the directional price movements cross over the Oversold signal (30) and crosses under the Overbought signal (70) as a factor in creating a Buy and Sell signal.
Using Relative Volume (RVOL) as an indicator, the strategy calculates when the current volume has crossed over the 2x average volume indicator over a given period and is then used as a factor in creating a Buy signal. RVOL is also used when the change in volume crosses under a set RVOL number (in this strategy, it is set to a RVOL of 5).
RVOL = Current Volume / Average Volume over a certain period
This strategy indicates a Buy signal when 2/3 conditions are met:
- RSI Cross Over the Over Sold signal (default 30)
- MACD Cross Over of Signal ( MACD > Signal)
- RVOL Cross Over of 2 (RVOL > 2)
This strategy indicates a Sell signal when 2/3 conditions are met:
- RSI Cross Under the Over Bought signal (default 70)
- MACD Cross Under of Signal ( MACD < Signal)
- RVOL Cross Under 5 (RVOL < 5)
Enjoy and leave feedback!

Combo Backtest 123 Reversal & Psychological line This is combo strategies for get a cumulative signal.
First strategy
This System was created from the Book "How I Tripled My Money In The
Futures Market" by Ulf Jensen, Page 183. This is reverse type of strategies.
The strategy buys at market, if close price is higher than the previous close
during 2 days and the meaning of 9-days Stochastic Slow Oscillator is lower than 50.
The strategy sells at market, if close price is lower than the previous close price
during 2 days and the meaning of 9-days Stochastic Fast Oscillator is higher than 50.
Second strategy
Psychological line (PSY), as an indicator, is the ratio of the number of
rising periods over the total number of periods. It reflects the buying
power in relation to the selling power.
If PSY is above 50%, it indicates that buyers are in control. Likewise,
if it is below 50%, it indicates the sellers are in control. If the PSY
moves along the 50% area, it indicates balance between the buyers and
sellers and therefore there is no direction movement for the market.
WARNING:
- For purpose educate only
Jigga - Heatmap ComparisionHi All,
I always have a question on how to know which sector is performing. I have created this Heatmap comparison to know strength of sector.
I have used RSI and MACD calculation and put it across 5 different index. Color shows bullishness and Gray shows weakness.
You can select RSI or MACD or Both to have calculation. And you can also compare stocks if you want.
Note: Use it for Medium / Long term investment. Can not be use for Intraday.
Happy investing !!

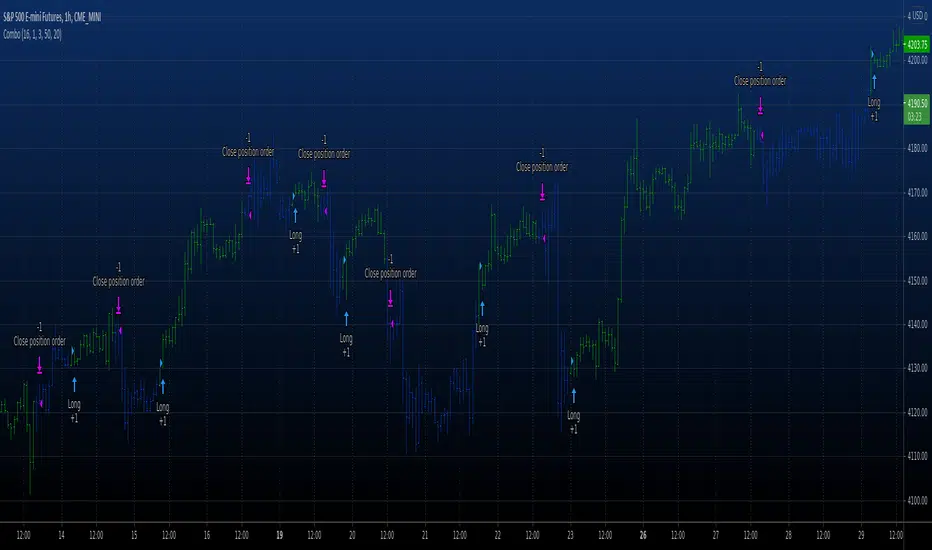
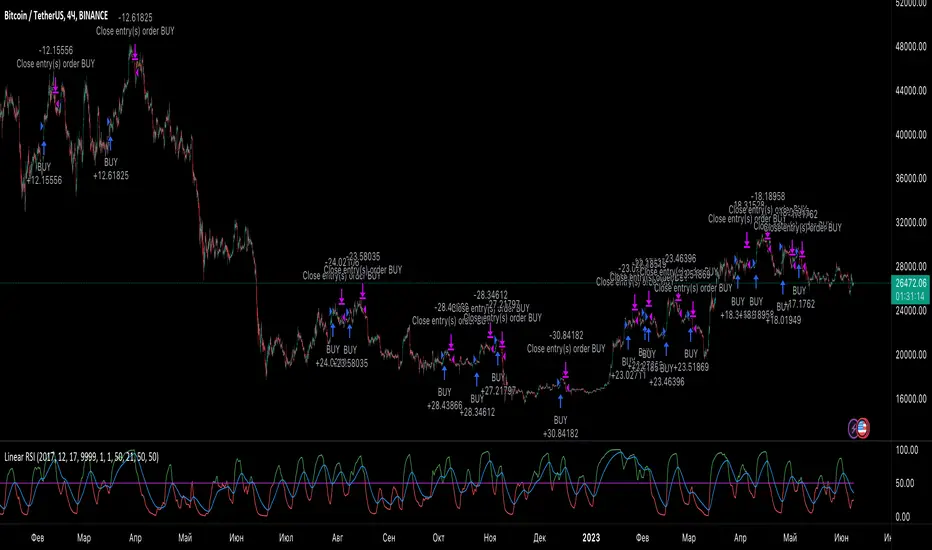
Linear RSIThis is an attempt to create a strategy based on the previous post. The strategy, as before, is based on the RSI, which is calculated using linear regression, but with the addition of EMA. The crossing of EMA and RSI is a buy and sell signal. There are also two functions to buy (because I haven't decided which is really better), so please use checkbox to order which one you would like to use.
Combo Backtest 123 Reversal & Prime Number Oscillator This is combo strategies for get a cumulative signal.
First strategy
This System was created from the Book "How I Tripled My Money In The
Futures Market" by Ulf Jensen, Page 183. This is reverse type of strategies.
The strategy buys at market, if close price is higher than the previous close
during 2 days and the meaning of 9-days Stochastic Slow Oscillator is lower than 50.
The strategy sells at market, if close price is lower than the previous close price
during 2 days and the meaning of 9-days Stochastic Fast Oscillator is higher than 50.
Second strategy
Determining market trends has become a science even though a high number or people
still believe it’s a gambling game. Mathematicians, technicians, brokers and investors
have worked together in developing quite several indicators to help them better understand
and forecast market movements.
Developed by Modulus Financial Engineering Inc., the prime number oscillator indicates the
nearest prime number, be it at the top or the bottom of the series, and outlines the
difference between that prime number and the respective series.
WARNING:
- For purpose educate only
- This script to change bars colors.
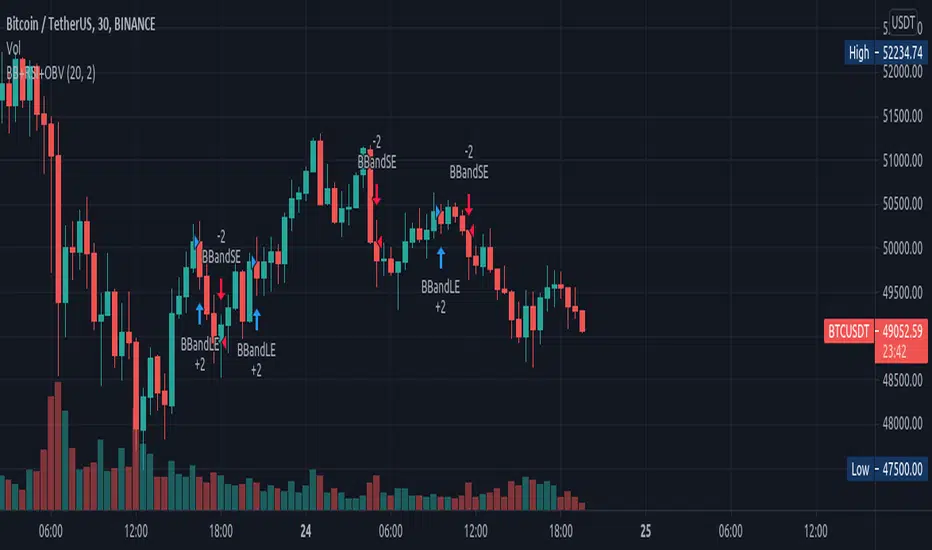
BB+RSI+OBVI use Bolinger Band and RSI and OBV
when Bolinger band midline cross and rsi is bigger than 50 and obv is going up i wrote this strategy to test this strategy
Combo Backtest 123 Reversal & Prime Number Bands This is combo strategies for get a cumulative signal.
First strategy
This System was created from the Book "How I Tripled My Money In The
Futures Market" by Ulf Jensen, Page 183. This is reverse type of strategies.
The strategy buys at market, if close price is higher than the previous close
during 2 days and the meaning of 9-days Stochastic Slow Oscillator is lower than 50.
The strategy sells at market, if close price is lower than the previous close price
during 2 days and the meaning of 9-days Stochastic Fast Oscillator is higher than 50.
Second strategy
Determining market trends has become a science even though a high number
or people still believe it’s a gambling game. Mathematicians, technicians,
brokers and investors have worked together in developing quite several
indicators to help them better understand and forecast market movements.
The Prime Number Bands indicator was developed by Modulus Financial Engineering
Inc. This indicator is charted by indentifying the highest and lowest prime number
in the neighborhood and plotting the two series as a band.
WARNING:
- For purpose educate only
- This script to change bars colors.

Combo Backtest 123 Reversal & Positive Volume Index This is combo strategies for get a cumulative signal.
First strategy
This System was created from the Book "How I Tripled My Money In The
Futures Market" by Ulf Jensen, Page 183. This is reverse type of strategies.
The strategy buys at market, if close price is higher than the previous close
during 2 days and the meaning of 9-days Stochastic Slow Oscillator is lower than 50.
The strategy sells at market, if close price is lower than the previous close price
during 2 days and the meaning of 9-days Stochastic Fast Oscillator is higher than 50.
Second strategy
The theory behind the indexes is as follows: On days of increasing volume,
you can expect prices to increase, and on days of decreasing volume, you can
expect prices to decrease. This goes with the idea of the market being in-gear
and out-of-gear. Both PVI and NVI work in similar fashions: Both are a running
cumulative of values, which means you either keep adding or subtracting price
rate of change each day to the previous day`s sum. In the case of PVI, if today`s
volume is less than yesterday`s, don`t add anything; if today`s volume is greater,
then add today`s price rate of change. For NVI, add today`s price rate of change
only if today`s volume is less than yesterday`s.
WARNING:
- For purpose educate only
- This script to change bars colors.

Reversal with Bollinger Bands + RSI + ADX + ATR (Upgraded)Hi,
Welcome to my 4th script.
Someone asked me some questions about the Bollinger Band strategy I previously published. When I went back to my published script I couldn't help myself but simply try and make it better. Which I did.
Since I've published that script, I've gained much more knowledge about how Pinescript functions. As well as gaining more and more knowledge about how the markets are structered etc.
In this reversal script we use 4 indicators to determine good entry signals, we determine whether the market is ranging or trending and we still only want to take trades in the direction of the "trend".
Bollinger Bands are used for our entry signal. When price hits either side of the band, we wait for a reverse candlestick before we enter a position.
RSI is used to determine if we're in a trending market or in a ranging market. You can adjust the values in the inputs. You can determine the minimum RSI value and the maximum RSI value.
ADX is used the same way as RSI, you can adjust the value in the inputs. You can determine the minimum ADX value.
Last but not least we use two EMA's, a 200 EMA and 100 EMA. Both are adjustable through the inputs. I used two EMA's because I noticed when using this strategy that we'd enter a new position often after having a bad trade. Using two EMA's might clean up some signals, in my case with EUR/USD on a 15m timeframe, it didn't clean up enough signals.
All the default values are pretty decent but might require some finetuning on a certain instrument. Don't overfit the strategy though, that'll only give you bad signals in the future.
Then we are off to our exit signals.
Initially I wanted to incorporate my previous Bollinger Band exit signals as well, but it was too much of a hassle to make the script work as intended so I left it out. If you want to use those exit signals, just find my other script.
When we're in a position and price crosses the opposite band, we wait for a reverse candlestick before we exit the position.
Additionally we want our losses to be as small as possible, so we use RSI to signal us when the market is, or starts to, trend against us. This is where you use the minimum and maximum exit values. So when RSI crosses over or under that value, it'll exit the position.
Furthermore, we use the ATR indicator to set our stop loss, which is pretty basic stuff. You can adjust the ATR multiplier in the inputs. Disabling "Use Trailing Stop?" is really inadvisable unless you know this script inside out as your only exit signals will be opposite Bollinger Band Cross and RSI overbought / oversold areas.

Combo Backtest 123 Reversal & Pivot Point V2 This is combo strategies for get a cumulative signal.
First strategy
This System was created from the Book "How I Tripled My Money In The
Futures Market" by Ulf Jensen, Page 183. This is reverse type of strategies.
The strategy buys at market, if close price is higher than the previous close
during 2 days and the meaning of 9-days Stochastic Slow Oscillator is lower than 50.
The strategy sells at market, if close price is lower than the previous close price
during 2 days and the meaning of 9-days Stochastic Fast Oscillator is higher than 50.
Second strategy
Pivot points simply took the high, low, and closing price from the previous period and
divided by 3 to find the pivot. From this pivot, traders would then base their
calculations for three support, and three resistance levels. The calculation for the most
basic flavor of pivot points, known as ‘floor-trader pivots’, along with their support and
resistance levels.
WARNING:
- For purpose educate only
- This script to change bars colors.

[laoowai]BNB_USDT_3m_3Commas_Bollinger_MACD_RSI_StrategyBNB_USDT _3m
Release Notes:
Time: 3min
Pair: BNB_USDT
Use: {{strategy.order.alert_message}}
What's the difference with 3Commas Bollinger Strategy by tedwardd:
1. Initial capital: 1210 USDT (10$ Base order / 400$*3 Safety order), if you will change, please change JUST safety order volume or number of safety orders 2-3
2. Using just 2(3) safety order (original script 4)
3. More high-performance strategy for BNB_USDT
4. Using MACD to sell order (original script take profit by scale), thanks Drun30 .
5. Using RSI to analyze the market conditions.
Need to change:
bot_id = input(title="3Commas Bot ID", defval=" YOUR DATA ")
email_token = input(title="Bot Email Token", defval=" YOUR DATA ")
---------------------------------------------------------------------------------------------------------------------------------------------------------------------------------------------------
FAQ copy from tedwardd
---------------------------------------------------------------------------------------------------------------------------------------------------------------------------------------------------
This strategy is intended for use as a way of backtesting various parameters available on 3commas.
The primary inputs for the strategy are:
---------------------------------------------------------------------------------------------------------------------------------------------------------------------------------------------------
// USER INPUTS
Short MA Window - The length of the Short moving average
Long MA Window - The length of the Long moving average
Upper Band Offset - The offset to use for the upper bollinger offset
Lower Band Offset - The offset to use for the lower bollinger offset
Long Stop Loss % - The stop loss percentage to test
Long Take Profit % - The Take profit percentage to test
Initial SO Deviation % - The price deviation percentage required to place to first safety order
Safety Order Vol Step % - The volume scale to test
3Commas Bot ID - (self-explanatory)
Bot Email Token - Found in the deal start message for your bot (see link in the previous section for details)
3Commas Bot Trading Pair - The pair to include for composite bot start deals (should match the format of 3commas, not TradingView IE. USDT_BTC not BTCUSDT )
---------------------------------------------------------------------------------------------------------------------------------------------------------------------------------------------------
Start Date, Month, Year and End Date, Month, and Year all apply to the backtesting window. By default, it will use as much data as it can give the current period select (there is less historical data available for periods below 1H) back as far as 2016 (there appears to be no historical data on Trading view much before this). If you would like to test a different period of time, just change these values accordingly.
---------------------------------------------------------------------------------------------------------------------------------------------------------------------------------------------------
Composite bot using a Bollinger band type trading strategy. While its primary intention is to provide users a way of backtesting bot parameters, it can also be used to trigger a deal start by either using the {{strategy.order.alert_message}} field in your alert and providing the bot details in the configuration screen for the strategy or by including the usual deal start message provided by 3commas.
---------------------------------------------------------------------------------------------------------------------------------------------------------------------------------------------------
Original script:
1. 3Commas Bollinger Strategy by tedwardd
2. Momentum Strategy ( BTC /USDT; 1h) - MACD (with source code) by Drun30

Combo Backtest 123 Reversal & Pivot Detector Oscillator Copyright by HPotter v1.0 20/04/2021
This is combo strategies for get a cumulative signal.
First strategy
This System was created from the Book "How I Tripled My Money In The
Futures Market" by Ulf Jensen, Page 183. This is reverse type of strategies.
The strategy buys at market, if close price is higher than the previous close
during 2 days and the meaning of 9-days Stochastic Slow Oscillator is lower than 50.
The strategy sells at market, if close price is lower than the previous close price
during 2 days and the meaning of 9-days Stochastic Fast Oscillator is higher than 50.
Second strategy
The Pivot Detector Oscillator, by Giorgos E. Siligardos
The related article is copyrighted material from Stocks & Commodities 2009 Sep
WARNING:
- For purpose educate only
- This script to change bars colors.
Stochastic TrendDear community,
I've made another simple trading bot for you to use. This bot is based on the Stochastic Oscillator. It only produces long trades currently.
I changed the oscillation period to a much longer one, which in turn creates opportunities to trade long term trends.
The bot goes long when the Entry lines is crossed from below and it will close its long position once the Exit line has been crossed from above.

Combo Backtest 123 Reversal & PFE (Polarized Fractal Efficiency) This is combo strategies for get a cumulative signal.
First strategy
This System was created from the Book "How I Tripled My Money In The
Futures Market" by Ulf Jensen, Page 183. This is reverse type of strategies.
The strategy buys at market, if close price is higher than the previous close
during 2 days and the meaning of 9-days Stochastic Slow Oscillator is lower than 50.
The strategy sells at market, if close price is lower than the previous close price
during 2 days and the meaning of 9-days Stochastic Fast Oscillator is higher than 50.
Second strategy
The Polarized Fractal Efficiency (PFE) indicator measures the efficiency
of price movements by drawing on concepts from fractal geometry and chaos
theory. The more linear and efficient the price movement, the shorter the
distance the prices must travel between two points and thus the more efficient
the price movement.
WARNING:
- For purpose educate only
- This script to change bars colors.
Combo Backtest 123 Reversal & Perfomance indexThis is combo strategies for get a cumulative signal.
First strategy
This System was created from the Book "How I Tripled My Money In The
Futures Market" by Ulf Jensen, Page 183. This is reverse type of strategies.
The strategy buys at market, if close price is higher than the previous close
during 2 days and the meaning of 9-days Stochastic Slow Oscillator is lower than 50.
The strategy sells at market, if close price is lower than the previous close price
during 2 days and the meaning of 9-days Stochastic Fast Oscillator is higher than 50.
Second strategy
The Performance indicator or a more familiar term, KPI (key performance indicator),
is an industry term that measures the performance. Generally used by organizations,
they determine whether the company is successful or not, and the degree of success.
It is used on a business’ different levels, to quantify the progress or regress of a
department, of an employee or even of a certain program or activity. For a manager
it’s extremely important to determine which KPIs are relevant for his activity, and
what is important almost always depends on which department he wants to measure the
performance for. So the indicators set for the financial team will be different than
the ones for the marketing department and so on.
Similar to the KPIs companies use to measure their performance on a monthly, quarterly
and yearly basis, the stock market makes use of a performance indicator as well, although
on the market, the performance index is calculated on a daily basis. The stock market
performance indicates the direction of the stock market as a whole, or of a specific stock
and gives traders an overall impression over the future security prices, helping them decide
the best move. A change in the indicator gives information about future trends a stock could
adopt, information about a sector or even on the whole economy. The financial sector is the
most relevant department of the economy and the indicators provide information on its overall
health, so when a stock price moves upwards, the indicators are a signal of good news. On the
other hand, if the price of a particular stock decreases, that is because bad news about its
performance are out and they generate negative signals to the market, causing the price to go
downwards. One could state that the movement of the security prices and consequently, the movement
of the indicators are an overall evaluation of a country’s economic trend.
WARNING:
- For purpose educate only
- This script to change bars colors.

Bollinger Bands strategy with RSI and MACD v1.0 This is a strategy based on the Bollinger Bands, where buy trades are made when the price crosses the lower line of the Bollinger Bands upwards, and sell trades are made when the price crosses the upper line downwards.
In addition, it is possible through the inputs to enable trading with RSI and MACD, so that buy or sell trades are supported by these two indicators.
Trades are partially and fully closed in the following way, a buy trade will close half of the position when the price touches the middle line of the Bollinger bands and will be fully closed when the price touches the upper band. In the case of a sell position, half of the position will be closed if the price touches the middle band and the entire position will be closed when the price touches the lower band. Alternatively, a fixed take profit can be placed. In case the price moves against us, trailing stops can be placed.
In case of selecting to use RSI, MACD, or MACD variation, trades will be executed as long as The Bollinger Bands, and all the above-mentioned indicators give the same signals, either buy or sell.
For example in the case of selecting only Use RSI, buy trades would be made as long as RSI and BB give buy signals.
Strategy inputs:
-BB source: Bollinger Bands price source.
-Bollinger Bands SMA length: Bollinger Bands simple moving average length.
-Bollinger Bands StdDev length: Bollinger Bands standard deviation length.
-Trail Long Loss (%): Distance in percentage at which the stop loss will initially be placed for buy trades.
-Trail Short Loss (%): Distance in percentage at which the stop loss will be initially placed for sell trades.
-Maximum orders: Maximum of simultaneous operations, for example, if it is 3, up to 3 parallel operations of buy and up to 3 parallel operations of sell will be carried out.
-Position size: Number of contracts per trade.
-Use RSI: If selected, the strategy will also trade based on oversold or overbought signals provided by the RSI.
-RSI source: RSI price source.
-RSI period: The RSI period to use.
-RSI value for buy: If the RSI is below this value, it will give a buy signal.
-RSI value for sell: If the RSI value is above this value, it will give a sell signal.
-Use MACD: If selected, buy trades will be made when the MACD crosses 0 upwards, and sell trades will be made when the MACD crosses 0 downwards.
-Use MACD variation: Only available if MACD is previously selected. In this case, buy trades are made if the MACD value in the last 3 candles has been decreasing, and sell trades are made if the MACD value has been increasing.
-MACD source: MACD price source.
-MACD fast length: MACD fast EMA lenght.
-MACD slow length: MACD slow EMA lenght.
-MACD signal length: MACD signal EMA lenght.
-Use maximum TP long: If selected, a fixed take profit will be placed for buy trades. The position could be closed before reaching this take profit if the price touches one of the lower or upper lines first.
-Maximum take profit long (%): Distance in percentage at which the take profit will be placed for buy trades.
-Use maximum TP short: if selected, a fixed take profit will be placed for sell trades. The position could be closed before reaching this take profit if the price touches one of the lower or upper lines first.
-Maximum take profit short (%): Distance in percentage at which the take profit will be set for sell trades.
I hope you like it and as always all feedback is welcome.

MA Crossover Strategy with MA Turning Point Exits + ADX filterThis strategy is based upon @rthomson's MA Crossover Strategy with MA Turning Point Exits.
I just added an ability to filter out entries when ADX < 20. In fact you have a choice to set this ADX threshold value.
In a sideways market, the MA crossovers end up in yielding entry trades with losses. ADX value around 20 to 25 indicates a sideway market. By introducing ADX threshold, we are trying to prevent potential loss making entries.

MA Crossover Strategy with MA Turning Point Exits + ADX filterThis strategy uses @rthomson's "MA Crossover Strategy with MA Turning point Exits" and combines it with ADX.
This strategy filters out any entries where ADX < 20. In fact you can set the value for ADX threshold. (Generally value under 20 for ADX is considered as non trend zone)

Combo Backtest 123 Reversal & Percentage Volume Oscillator (PVO) This is combo strategies for get a cumulative signal.
First strategy
This System was created from the Book "How I Tripled My Money In The
Futures Market" by Ulf Jensen, Page 183. This is reverse type of strategies.
The strategy buys at market, if close price is higher than the previous close
during 2 days and the meaning of 9-days Stochastic Slow Oscillator is lower than 50.
The strategy sells at market, if close price is lower than the previous close price
during 2 days and the meaning of 9-days Stochastic Fast Oscillator is higher than 50.
Second strategy
The Percentage Volume Oscillator (PVO) is a momentum oscillator for volume.
PVO measures the difference between two volume-based moving averages as a
percentage of the larger moving average. As with MACD and the Percentage Price
Oscillator (PPO), it is shown with a signal line, a histogram and a centerline.
PVO is positive when the shorter volume EMA is above the longer volume EMA and
negative when the shorter volume EMA is below. This indicator can be used to define
the ups and downs for volume, which can then be use to confirm or refute other signals.
Typically, a breakout or support break is validated when PVO is rising or positive.
WARNING:
- For purpose educate only
- This script to change bars colors.

Full strategy Psar+ adx + cmf + rsi This ia full strategy made with a combination of a trender, volume, volatility and oscillator.
In this case we only go long.
Indicators used:
Default PSAR
Default CMF
Modified RSI logic, not using OB/OS
ADX with EMA applied
The rules are : we check if we are in a uptrend on psar, together with a positive value in volume, rsi is above the middle line(50), using a big length, and lastly the ADx is superior to the ema ADx
For exit, we check the opposite, like downtrend psar, negative value volume, rsi < 50, and adx < ema adx
If you have any questions let me know.
