Extreme Bars"Extreme Bars" is a simple but useful indicator that marks overbought and oversold candles. This indicator paints candles that fall far above the average red, and the candles that rise above the average green. Of course, they can change these colors if they want. "Extreme Bars" can be interpreted in many different ways. The starting points of colored candles can often be good support or resistance. In addition, it would be wise to close the positions opposite the colored candles and to maintain the positions compatible with the colored candles. It is also possible that the gaps formed by the colored candles will be closed in the future. The sensitivity of the indicator can be changed in the settings section.
Overbought

Dragon Double RSI Overbought-Oversold With LabelThis indicator consist of tow RSI length that user can customize it. like length, overbought, oversold. like length, overbought, oversold. also it has one moving average where the user can select from different types of moving averages, price sources, lookback periods and resolutions

EMCHO Stochastic RangeCustom Stochastic Oscillator with range plot. Can be used to better identify overbought/oversold conditions within a single bar. In addition to the default Stochastic:
%K line smoothing algorithm selection;
%D line smoothing algorithm selection;
%K line high/low plotting;
%K line high/low calculation factor (in bars, default 1).

OBV Overbuy+sell Oscillator[RSU]On-balance volume (OBV) is a technical trading momentum indicator that uses volume flow to predict changes in stock price. Joseph Granville first developed the OBV metric in the 1963 book Granville's New Key to Stock Market Profits.
This indicator is based on the OBV indicator and adds 2 times the standard deviation Bollinger Band to evaluate the overbought and oversold phenomenon of the OBV indicator.
The characteristics of Bollinger Bands: According to the normal distribution phenomenon, only 5% of the cases will exceed 2 times the standard deviation of the Bollinger Bands . So when it exceeds, I use colors to mark red overbought and green oversold situations.
Usage:
1.Identify trends: Identify current stock trends by OBV's 30 average line color.
2.Breakthrough:OBV Breakthrough 30 average,signal trend may reversal.
3.Oversell and overbuy:A break below overbuy could signal a temporary end to the uptrend.
4.Divergence:When the slope of the two highs is opposite to the slope of the two highs of the indicator, a trend reversal signal may occur.

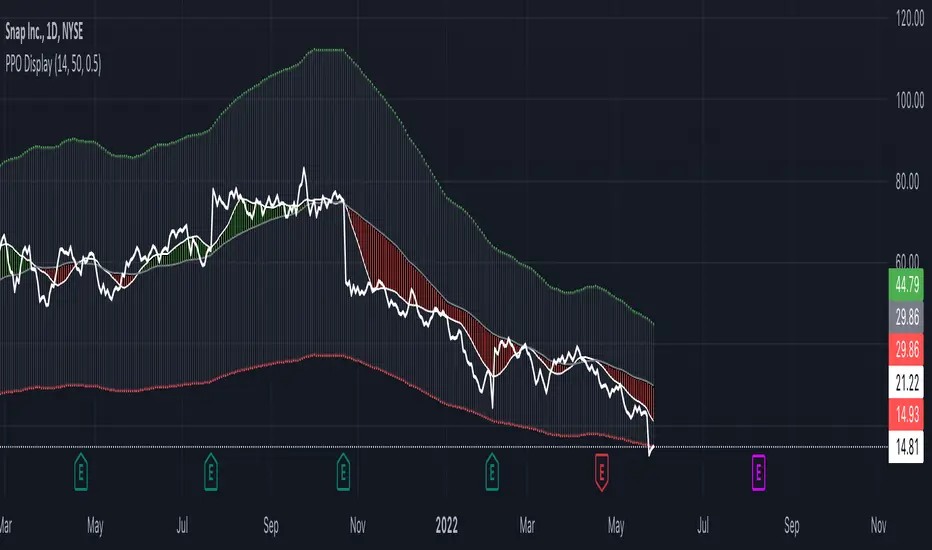
Infiten's Price Percentage Oscillator Channel (PPOC Indicator)What is the script used for?
Infiten's Price Percentage Oscillator (PPOC Indicator) can be used as a contrarian indicator for volatile stocks and futures to indicate reversals, areas of support and resistance. For longer term trading, if the Short SMA or prices go above the High PPO Threshold line, it is a sign that the asset is overbought, whereas prices or the Short SMA going below the Low PPO Threshold line indicates that the asset is oversold.
What lines can be plotted?
Low PPO Thresh - Calculated as -PPO Threshold * Short MA + Long MA : Gives the price below which the PPO hits your lower threshold
High PPO Thresh - Calculated as PPO Threshold * Short MA + Long MA : Gives the price above which the PPO hits your upper threshold
MA PPO : Plots candles with the Low PPO Thresh as the low, High PPO Thresh as the high, Short MA as the open, and Long MA as the close.
Short SMA : plots the short simple moving average
Long SMA : plots the long simple moving average
Customizable Values :
Short MA Length : the number of bars back used to calculate the short moving average for a PPO
Long MA Length : the number of bars back used to calculate the long moving average for a PPO
PPO Threshold : the percent difference from the moving average expressed as a decimal (0.5 = 50%)
Recommendations:
Longer timeframes like 300 days are best with larger PPO Thresholds, I recommend using a PPO Threshold of 0.5 or higher. For shorter timeframes like 14 days I recommend setting smaller PPO Thresholds, like 0.3 or lower. I find that these values typically capture the most extremes in price action.
Williams %R - SmoothedFrom TradingView's description:
Williams %R (%R) is a momentum-based oscillator used in technical analysis, primarily to identify overbought and oversold conditions. The %R is based on a comparison between the current close and the highest high for a user defined look back period. %R Oscillates between 0 and -100 (note the negative values) with readings closer to zero indicating more overbought conditions and readings closer to -100 indicating oversold. Typically %R can generate set ups based on overbought and oversold conditions as well overall changes in momentum.
What's special?
This indicator adds two additional EMA lines to the original Williams %R indicator. Default EMA lengths are 5 and 13. The result is 2 smoother average lines, which are easier to read.
This indicator includes:
- signals for EMA crosses. EMA crosses can help indicate confirmed trend changes. Default colors are green and red
- signals for trend reversals on the faster EMA line. Default colors are blue and orange
Alerts available for bullish/bearish crossovers and reversals.
Enjoy~~!

RSI MTF Ob+OsHello Traders,
This indicator use the same concept as my previous indicator "CCI MTF Ob+Os".
It is a simple "Relative Strength Index" ( RSI ) indicator with multi-timeframe (MTF) overbought and oversold level.
It can detect overbought and oversold level up to 5 timeframes, which help traders spot potential reversal point more easily.
There are options to select 1-5 timeframes to detect overbought and oversold.
Aqua Background is "Oversold" , looking for "Long".
Orange Background is "Overbought" , looking for "Short".
Have fun :)

CCI MTF Ob+OsHello Traders,
This is a simple Commodity Channel Index (CCI) indicator with multi-timeframe (MTF) overbought and oversold level.
It can detect overbought and oversold level up to 5 timeframes, which help traders spot potential reversal point more easily.
There are options to select 1-5 timeframes to detect overbought and oversold.
Green Background is "Oversold" , looking for "Long".
Red Background is "Overbought" , looking for "Short".
Have fun :)

DiNapoli Oscillator Predictor TableThis indicator displays a table containing the Oscillator Predictor Overbought (OB) and Oversold Levels (OS) from Higher Timeframes: a green background denotes a market above OB in that particular timeframe, and a red one denotes an OS market.
It allows displaying current and future Predictor values.
Only Higher Timeframes states do appear in the table. Lower Timeframes are grayed out, due to inability to get reliable results for such behaviour in current Tradingview environment.
The position of the table can be customized through the input panel.
Note: This indicator is quite demanding in terms of resources, and it might take some seconds to fully populate the table.

ARKA-Z-ScoreThis Indicator is based on Mr. Dan Valcu ideas.
The author of this article is Veronica Valcu.
The z-score (z) for a data item x measures the distance (in standard deviations StdDev) and direction
of the item from its mean (U):
z = (x-StdDev) / U
A value of zero indicates that the data item x is equal to the mean U, while
positive or negative values show that the data item is above (x>U) or below
(x Values of +2 and -2 show that the data item is two standard deviations
above or below the chosen mean, respectively, and over 95.5% of all data
items are contained within these two horizontal references.
Based on the article and ideas about the z-score concept we can use it to get more confidence where we want to be sure this is an oversold or overbought zone.
The indicator draws two levels on 2 and -2. Z-Score color comes red when it goes above 2, and the color changes to green when it goes below the -2 level. The Z-Score color which value is between 2 & -2 is gray.

MTF Stochastic ScannerThis Stochastic scanner can be use to identify overbought and oversold of 10 symbols over multiple timeframes
it will give you a quick overview which pair is more overbough or more oversold and also signals tops and bottoms in the AVG row
light red/green cell = weak bearish (Stoch = 30-20) / bullish (Stoch = 70-80)
medium red/green cell = bearish (Stoch = 20-10) / bullish (Stoch = 80-90)
dark red/green cell = strong bearish (Stoch <= 10) / bullish (Stoch >= 90)
gray cell = neutral (Stoch = 30-70)
Usage
If AVG (average of all 4 timeframes) falls below 20, the cell will get green, indicating a good time to enter long (buy)
If AVG (average of all 4 timeframes) rises above 80, the cell will get red, indicating a good time to enter short (sell)
Use the "MTF Stochastic Scanner" in combination with the " MTF RSI Scanner "
to find tops (RSI MTF avg >=70 AND Stochastic MTF avg >= 80)
or bottoms (RSI MTF avg <= 30 AND Stochastic MTF avg <= 20)
Here is how the two MTF scanners looked on Nov 08 2021 (ATH) »
and here how the MTF scanners looked on June 21 2022
use TradingViews Replay function to check how it would have worked in the past and when not.
As always… there NOT a single indicator that can show to the top & bottom 100% every single time. So use with caution, with other indicators and/or deeper understanding of technicals analysis ☝️☝️☝️
Settings
You can change the timeframes, symbols, Stochastic settings, overbought/oversold levels and colors to your liking
Drag the table onto the price chart, if you want to use it as an overlay.
NOTE:
Because of the 4x10 security requests, it can take up to 1 minute for changed settings to take effect! Please be patient 🙃
If you have any idea on how to optimise the code, please feel free to share 🙏
*** Inspired by "Binance CHOP Dashboard" from @Cazimiro and "RSI MTF Table" from @mobester16 ***

Double Basics - Identify Overbought & Oversold - MultitimeframeI believe that everyone should monitor the basic indicators; EMA/SMA cross, BB and RSI on at least TWO timeframes before making any trading decisions. And because that is only possible on paid subscriptions, I created this indicator for people just getting started.
It allows you to plot all of the mentioned AND 2 weeklies of your choice on 1 chart INCLUDING a higher timeframe, using only 1 indicator.
The EMA's are plotted as ORANGE and the SMA's as BLACK, you can distinguish them by the line size, thin is current chart, thick is higher timeframe.
Same for the Bollinger Bands, Upper lines are red (overbought = sell signal) and bottom lines are green (oversold = buy signal)
The RSI, normally plotted in its own window, are plotted on the scale of the BB of the 2nd timeframe, where the bottom line = 0, upper line = 100 and middle (think black) line = 50. The thin purple line is the RSI of the chart resolution, the thicker purple line is the RSI of the 2nd timeframe.
Finally, the two weeklies are plotted as thick black lines.
Enjoy, and let me know your feedback!

Multi-Timeframe RSI GridThe relative strength index (RSI) is a momentum indicator that measures the magnitude of recent price changes to evaluate overbought or oversold conditions. The RSI is normally displayed as an oscillator separately from price and can have a reading from 0 to 100. This indicator displays the current RSI levels at up to 6 timeframes (of your choosing) in a grid. If the RSI levels reach overbought (above 70) or oversold (below 30) conditions, it changes the color to help you see that RSI has reached extreme levels. Note that in TradingView, when the chart is on a higher timeframe, the lower timeframe RSI levels don't calculate properly. If those conditions are met, this indicator will hide those values in the grid. If none of your selected values are available, it hides the table completely. There are configuration options, like:
Position the grid in any corner of the screen
Style customization (color, size)
Customize RSI length

Parabolic RSIThe Parabolic RSI is a fusion between two of Welles Wilder Jr.'s indicators:
* The parabolic stop-and-reverse: A trend following overlay indicator.
* The relative strength index: A contrarian indicator bounded between 0 and 100.
The parabolic RSI applies the RSI formula on the parabolic stop-and-reverse which in turn is applied on the market price. The main aim is to find an oscillator similar to the RSI but with a touch of a trend following indicator. In other words, the parabolic RSI is to be used in tandem with the regular RSI to get a confirmatory signal. Generally the parabolic RSI is more stable than the RSI due to the formula used (a type of smoothing from the parabolic stop-and-reverse) which is why it may have a diversification factor with the signals from the RSI.
The best way to use the parabolic RSI is as follows:
* A long signal is generated whenever the parabolic RSI exits the oversold level.
* A short signal is generated whenever the parabolic RSI exits the overbought level.

Strategy Rsi-Long Short by SebasVentuIt is the popular RSI indicator with VWAP as the source instead of the close.
What is Volume Weighted Average Price (VWAP)?
The VWAP is calculated by adding the dollars traded for each trade (price multiplied by the number of shares traded) and then dividing it by the total shares traded. That is, volume.
Es el popular indicador RSI con VWAP como fuente en lugar de cierre.
¿Qué es el Precio Promedio Ponderado por Volumen (VWAP)?
El VWAP se calcula sumando los dólares negociados por cada transacción (precio multiplicado por el número de acciones negociadas) y luego dividiéndolo por el total de acciones negociadas. Es decir, volumen.

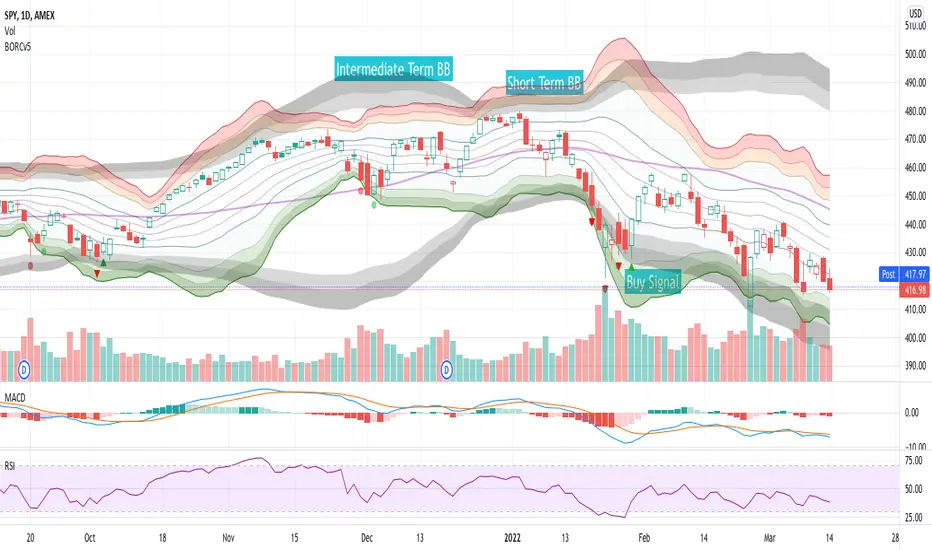
BORCv5: Breakout Reversal, Standard Deviation & Bollinger Bands
The BORCv5 (Breakout Reversal Confirmation) script can improve your trading by visualizing the standard deviation lines & bollinger bands on your chart, along with breakout reversal early warning and confirmation signals which can be interpreted as buy/sell signals.
- BORCv5 utilizes multi-period Bollinger Bands & custom signals to paint a clear picture of price movement.
- BORCv5 works on everything: Futures, Equities, Indices, Crypto, and on any time interval.
The purple line represents the simple moving average (SMA) for the period (default: 20). You can use the EMA instead if you prefer via settings.
The Bollinger bands & trend lines tell you if the stock is trading "high" or "low" relative to its recent price action.
- The inner green/orange/red bands represent short term Bollinger Bands: 1 Standard Deviation (SD), 2SD, 3SD and 4SD
- The grey bands represent intermediate term Bollinger Bands.
The width of the bands changes due to volatility. Narrow Bollinger Bands represent low volatility, where price is relatively flat or trending slowly in one direction. Wide open Bollinger Bands signify either high volatility OR trending powerfully in one direction. If the Bands are pointing downwards it is a bearish trend and if the Bands are pointing upwards it is a bullish trend.
It is important to get the right amount of data (or context) for Bollinger Bands: Too small of a period for basis (5,8,10) and you won't have enough data (or context). Too high of a period and you will have too much data (or context). The right amount of data (or context) is also important because you want to follow averages that algos & other traders follow and you want the Bollinger length to give you enough data to see various standard deviations. Too low of a Bollinger length means the bands deform too easy & too high of a Bollinger length means they are too flat, making the data hard to interpret. We like 20 periods as a compromise between not enough & too much data but you can adjust this value in the script settings.
Breakout Reversal Confirmation Signals:
Pay attention to the triangles: they represent the price movement action of the larger period Bollinger Band that will filter out most of the false breakouts.
Triangles pop up when the price breaches the 2.9 standard deviation, meaning we're in an extreme range leading to a continuation or reversal.
Red Triangle:
- Pointing Down => Bearish Breakout has occurred, watch for a Bullish Reversal
- Pointing Up => Bullish Breakout has occurred, watch for a Bearish Reversal
Green Triangle:
- Pointing Down => Bearish Reversal is confirmed, price has a high chance to move Bearish
- Pointing Up => Bullish Reversal is confirmed, price has a high chance to move Bullish
Red Circle:
- Weak Bearish / Bullish Breakout
Green Circle:
- Weak Bearish / Bullish Reversal Confirmed
For more information, see the BORC PDF guide and examples !
PS: This script was originally published by reaganmcf and has been upgraded to Pine v5.
Bitcoin Power Law Bands (BTC Power Law) Indicator█ OVERVIEW
The 'Bitcoin Power Law Bands' indicator is a set of three US dollar price trendlines and two price bands for bitcoin , indicating overall long-term trend, support and resistance levels as well as oversold and overbought conditions. The magnitude and growth of the middle (Center) line is determined by double logarithmic (log-log) regression on the entire USD price history of bitcoin . The upper (Resistance) and lower (Support) lines follow the same trajectory but multiplied by respective (fixed) factors. These two lines indicate levels where the price of bitcoin is expected to meet strong long-term resistance or receive strong long-term support. The two bands between the three lines are price levels where bitcoin may be considered overbought or oversold.
All parameters and visuals may be customized by the user as needed.
█ CONCEPTS
Long-term models
Long-term price models have many challenges, the most significant of which is getting the growth curve right overall. No one can predict how a certain market, asset class, or financial instrument will unfold over several decades. In the case of bitcoin , price history is very limited and extremely volatile, and this further complicates the situation. Fortunately for us, a few smart people already had some bright ideas that seem to have stood the test of time.
Power law
The so-called power law is the only long-term bitcoin price model that has a chance of survival for the years ahead. The idea behind the power law is very simple: over time, the rapid (exponential) initial growth cannot possibly be sustained (see The seduction of the exponential curve for a fun take on this). Year-on-year returns, therefore, must decrease over time, which leads us to the concept of diminishing returns and the power law. In this context, the power law translates to linear growth on a chart with both its axes scaled logarithmically. This is called the log-log chart (as opposed to the semilog chart you see above, on which only one of the axes - price - is logarithmic).
Log-log regression
When both price and time are scaled logarithmically, the power law leads to a linear relationship between them. This in turn allows us to apply linear regression techniques, which will find the best-fitting straight line to the data points in question. The result of performing this log-log regression (i.e. linear regression on a log-log scaled dataset) is two parameters: slope (m) and intercept (b). These parameters fully describe the relationship between price and time as follows: log(P) = m * log(T) + b, where P is price and T is time. Price is measured in US dollars , and Time is counted as the number of days elapsed since bitcoin 's genesis block.
DPC model
The final piece of our puzzle is the Dynamic Power Cycle (DPC) price model of bitcoin . DPC is a long-term cyclic model that uses the power law as its foundation, to which a periodic component stemming from the block subsidy halving cycle is applied dynamically. The regression parameters of this model are re-calculated daily to ensure longevity. For the 'Bitcoin Power Law Bands' indicator, the slope and intercept parameters were calculated on publication date (March 6, 2022). The slope of the Resistance Line is the same as that of the Center Line; its intercept was determined by fitting the line onto the Nov 2021 cycle peak. The slope of the Support Line is the same as that of the Center Line; its intercept was determined by fitting the line onto the Dec 2018 trough of the previous cycle. Please see the Limitations section below on the implications of a static model.
█ FEATURES
Inputs
• Parameters
• Center Intercept (b) and Slope (m): These log-log regression parameters control the behavior of the grey line in the middle
• Resistance Intercept (b) and Slope (m): These log-log regression parameters control the behavior of the red line at the top
• Support Intercept (b) and Slope (m): These log-log regression parameters control the behavior of the green line at the bottom
• Controls
• Plot Line Fill: N/A
• Plot Opportunity Label: Controls the display of current price level relative to the Center, Resistance and Support Lines
Style
• Visuals
• Center: Control, color, opacity, thickness, price line control and line style of the Center Line
• Resistance: Control, color, opacity, thickness, price line control and line style of the Resistance Line
• Support: Control, color, opacity, thickness, price line control and line style of the Support Line
• Plots Background: Control, color and opacity of the Upper Band
• Plots Background: Control, color and opacity of the Lower Band
• Labels: N/A
• Output
• Labels on price scale: Controls the display of current Center, Resistance and Support Line values on the price scale
• Values in status line: Controls the display of current Center, Resistance and Support Line values in the indicator's status line
█ HOW TO USE
The indicator includes three price lines:
• The grey Center Line in the middle shows the overall long-term bitcoin USD price trend
• The red Resistance Line at the top is an indication of where the bitcoin USD price is expected to meet strong long-term resistance
• The green Support Line at the bottom is an indication of where the bitcoin USD price is expected to receive strong long-term support
These lines envelope two price bands:
• The red Upper Band between the Center and Resistance Lines is an area where bitcoin is considered overbought (i.e. too expensive)
• The green Lower Band between the Support and Center Lines is an area where bitcoin is considered oversold (i.e. too cheap)
The power law model assumes that the price of bitcoin will fluctuate around the Center Line, by meeting resistance at the Resistance Line and finding support at the Support Line. When the current price is well below the Center Line (i.e. well into the green Lower Band), bitcoin is considered too cheap (oversold). When the current price is well above the Center Line (i.e. well into the red Upper Band), bitcoin is considered too expensive (overbought). This idea alone is not sufficient for profitable trading, but, when combined with other factors, it could guide the user's decision-making process in the right direction.
█ LIMITATIONS
The indicator is based on a static model, and for this reason it will gradually lose its usefulness. The Center Line is the most durable of the three lines since the long-term growth trend of bitcoin seems to deviate little from the power law. However, how far price extends above and below this line will change with every halving cycle (as can be seen for past cycles). Periodic updates will be needed to keep the indicator relevant. The user is invited to adjust the slope and intercept parameters manually between two updates of the indicator.
█ RAMBLINGS
The 'Bitcoin Power Law Bands' indicator is a useful tool for users wishing to place bitcoin in a macro context. As described above, the price level relative to the three lines is a rough indication of whether bitcoin is over- or undervalued. Users wishing to gain more insight into bitcoin price trends may follow the author's periodic updates of the DPC model (contact information below).
█ NOTES
The author regularly posts on Twitter using the @DeFi_initiate handle.
█ THANKS
Many thanks to the following individuals, who - one way or another - made the 'Bitcoin Power Law Bands' indicator possible:
• TradingView user 'capriole_charles', whose open-source 'Bitcoin Power Law Corridor' script was the basis for this indicator
• Harold Christopher Burger, whose Bitcoin’s natural long-term power-law corridor of growth article (2019) was the basis for the 'Bitcoin Power Law Corridor' script
• Bitcoin Forum user "Trololo", who posted the original power law model at Logarithmic (non-linear) regression - Bitcoin estimated value (2014)

STR:EMA Oscilator [Azzrael]Strategy based on EMA and EMA Oscilator
(EMA - close) + Std Dev + Factor = detecting oversell/overbuy
Long only!
Pyramiding - sometimes, depends on ...
There're 2 enter strategies in one script:
1 - Classic, buy on entering to OverSell zone (more profitable ~> 70%)
2 - Crazy, buy on entering to OverBuy zone (catching trend and pyramiding, more net profit)
Exit - crossing zero of (EMA - close)

Overbought & Oversold TrackerAbout this indicator:
- This indicator is basically a stochastic indicator that shows to you the crossover in an Overbought or Oversold area DIRECTLY on the chart
How does it works:
- When Stochastic crosses at Oversold area, a Blue Triangle will appear below the candle with a Blue Dotted Line at the low of the current candle
- The Blue Triangle is to help you to see easily the candle where the crossover is occurring
- At the same time, the Blue Dotted Line will act as a minor Support for the current price
- If the current candle breaks the Blue Dotted Line (minor Support), the candle will be displayed in a red color
- Same things will occur if Stochastic crosses at the Overbought area, but at this time, a Red Triangle with Red Dotted Line will appear just to differentiate between Overbought and Oversold crossover
The advantage of using this indicator:
- You can easily see the point of stochastic crossover DIRECTLY on the chart without analyzing the stochastic indicator
- At the same time, it helps you to see clearly either the price is at the bottom / reversal by combining it with S&R / trendlines or other indicators
Personally, I will combine this indicator with:
a. Support and Resistance or Trendlines
b. Fibonacci retracement
c. Candlestick indicator (see my script list)
d. Ultimate MACD (see my script list)
e. Volume indicator
These combinations personally increase the possibility for me to buy exactly at the point of reversal in a pullback
- This indicator is preset at the value of 25 (oversold) and 75 (overbought) k line, it's my own preference. You can change these values at the setting menu to suit your trading style.
- Once again, I am opening the script for anyone to modify/alter it based on you own preference. Have a good day!
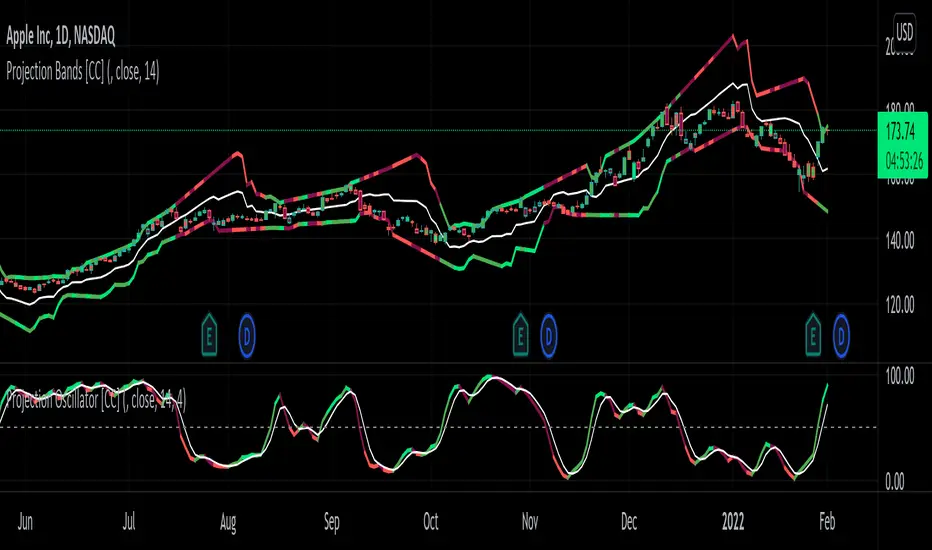
Projection Oscillator [CC]The Projection Oscillator was created by Mel Widner (Stocks and Commodities Jul 1995) and this is another hidden gem that is of course a great complementary indicator to my previous Projection Bands . I would recommend to use both on the same chart so you get the full array of information. This indicator tells you where the current price falls between the bands and the higher the oscillator is, the closer the price is to the upper band and vice versa. Now since the price never falls outside of the bands, the indicator is limited from 0 to 100. You will notice that with this indicator it gives even earlier signals than the Projection Bands so a very useful indicator indeed. I have included strong buy and sell signals in addition to normal ones so strong signals are darker in color and normal signals are lighter in color. Buy when the line turns green and sell when it turns red.
Let me know if there are any other indicators or scripts you would like to see me publish!
Mobility Oscillator [CC]The Mobility Oscillator was created by Mel Widner (Stocks and Commodities Feb 1996) and this is another of my ongoing series of undiscovered gems. I would say this is probably the most complicated script I have written for an indicator. It is extremely complicated to calculate comparing to other indicators but this is essentially an overbought and oversold indicator that uses a very unique technique to calculate overbought and oversold levels and overall upward or downward momentum there is in the underlying stock. It uses a price distribution function to determine how often the current prices fall within the current trend which tells us how strong the momentum for the current trend actually is. I had to customize this indicator a bit to give clear buy and sell readings so I had to introduce a lag in exchange for clearer signals. This indicator ranges between +100 and -100 and when it stays at the +100 level for example then this means a sustained uptrend and vice versa. I have included strong buy and sell signals in addition to normal ones so strong signals are darker in color and normal signals are lighter in color. Buy when the line turns green and sell when it turns red.
Let me know if there are any other scripts or indicators you would like to see me publish!

MACD Cross [Momentum & Trend Filter]This is MTF MACD crossover and crossunder, with EMA trend filter and MTF RSI overbought/oversold filter.
Guidelines:
- User can set stop loss, take profit target and risk to reward ratio in setting
- ATR Stop and ATR Multiplier are use to set stop loss and take profit levels, setting are varies depend on what you are trading, play around and find appropriate number
- Don't trade if range between stop loss and target profit are too small or if there are too many small range try to increase multiplier
- If MACD Zero Line Filter enable, detect MACD crossover only under zero line for LONG, and detect MACD crossunder only above zero line for SHORT
- If EMA Trend Filter enable, detect MACD crossover which price above EMA for LONG, and detect MACD crossunder which price below EMA for SHORT
- RSI timeframe 1-3 should not lower than chart timeframe to display Overbought and Oversold correctly
- Enable MTF Overbought and Oversold just to display red background for Overbought, and green background for Oversold
There are 3 alert options:
(For those free user which can get only 1 alert, please choose "MACD crossover & crossunder" if you want to get alert for both long and short directions)
Have fun :)

Relative Strength Exponential Moving Average [CC]The Relative Strength Exponential Moving Average was created by Vitali Apirine (Stocks and Commodities Jan 2022 pgs 22-25) and this is a handy moving average that combines a typical overbought/oversold mechanic with an overall trend indicator. Even though the typical length is so large it reacts extremely quickly when the stock becomes overbought or oversold. Because of this the indicator by itself doesn't work as well during choppy periods so Vitali recommends using a moving average crossover system during choppy so do one indicator with the default length of 50 and use a different length of 10 so when the shorter length crosses over the longer length then buy and vice versa you would sell. Generally speaking buy when the line turns green and sell when it turns red. I have used strong buy and sell signals in addition to normal signals so strong signals are darker in color and normal signals are lighter in color.
Let me know if there are any other scripts or indicators you would like me to publish!
