Zero-Lag MTF PSAR MACD with Bollinger Bands v1.0 [loxx]Zero-Lag MTF PSAR MACD with Bollinger Bands v1.0
This is an experimental indicator that captures PSAR movements on seven different timeframes in order to improve trend detection on the daily timeframe. The seven PSARs are averaged and then fed into a zero-lag MACD function where the average of the PSARs is the source for the slow moving average and the daily timeframe close is the sourse of the fast moving average.
Things to know:
- Dark Green Background: All seven PSAR waves are above the closes of the PSARs respective timeframes; i.e., macro trend up
- Dark Red Background: All seven PSAR waves are below the closes of the PSARs respective timeframes; i.e., macro trend down
- Histogram and bar coloration is based on the difference between close and the average of all seven PSARs
- Various color schemes included
- Indicator has neither been backtested nor tuned with a strategy backtest
How to use:
Reversal Longs and Shorts
- Bollinger Bands show movement outside of normal deviation around the zero line. Wait for MACD to reach the either side top or bottom of Bollinger Bands for reversal long and reversal short respectively
- Check that MACD has crossed over or under the Signal line; i.e., denoted with a green dot for cross up and red dot for cross down
- Check dark background colors to see where the PSAR waves are currently situated and whether PSAR wave direction has aligned on all time frames
Longs and Shorts
- Longs: Check when MACD is above the zero line and the Signal line crosses over the zero line
- Shorts: Check when MACD is below the zero line and the Signal line crosses below the zero line
Strong Confluence:
- Longs/Shorts: Whenever the MACD crosses up or crosses down over/under the Signal/Zero line while inside a candle with background highlighting
- Reversals: Whenever the MACD crosses up or crosses down over/under the Signal/Zero line while inside a candle with background highlighting and at the very top/bottom or outside the top/bottom of the Bollinger Bands
Comment below or send a PM with questions, comments, observations, or concerns.
Arrêt et renversement parabolique (PSAR)

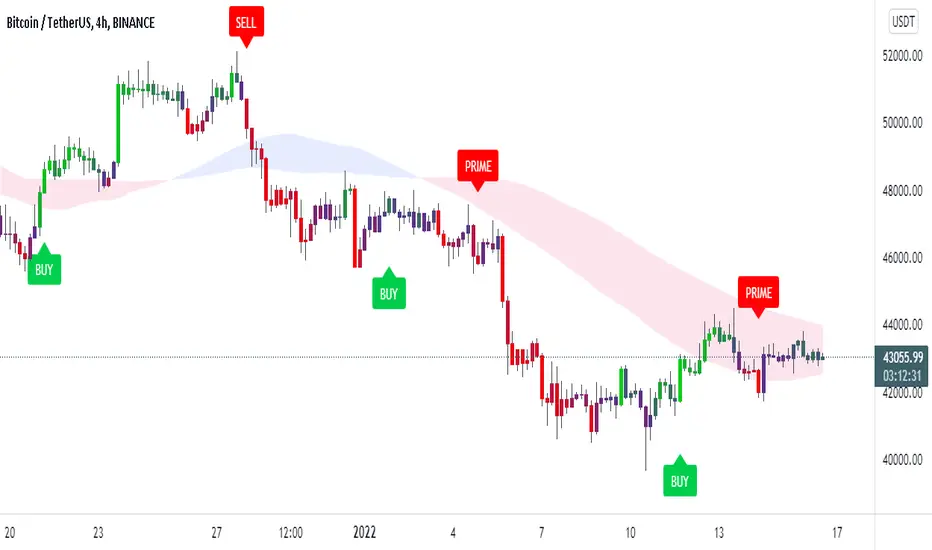
Trendorithm PrimeTrendorithm Prime is a toolkit made up of several different innovative indicators, designed by our team of developers. Get access now and create your own, unique trading strategies using our - all in one algorithm.
Our algorithm works in any market and focuses on finding the direction of the trends and remove noise from the price, for smooth understanding of the market.
Extra Confirmation
Using binomial distribution, the past values are processed to interpret the direction of trend.
After that, the signals are triggered based the volatility of the market,which is derived from the averages of candle size. All of these signals were optimised for each timeframe using timeframe multiplier.
Setting a lesser value on quotient adjusts the lookback length and volatility conditions, thus producing more number of signals that supports scalping trades. Higher the number in quotient, the frequency of trades reduce which helps the trader to hold trades for longer time.
Our Confirmation Signals helps to analyze the direction of trends for all markets and all timeframes, it boosts Trader’s confidence prior taking trades.
We made our Confirmation Signals flexible in order to suit any kind of trading style.
By adjusting the Quotient value in the settings, Traders can control the frequency of signals generated easily.
The Confirmation Signals includes a special type of signal called "Prime" which includes candle coloring to see the strength of the trend.
Our Candle-system is designed in 3 different colorings.
Green ( Bullish )
Red ( Bearish )
Purple (possible reversal or the possible formation of a new trend)
Trendo Cloud
The power of moving averages is always ultimate. This cloud made up of multiple moving averages acts as a dynamic support and resistance. The color and width of the cloud is used to find potential entry and exit points for trades.
Trend Catcher and Trend Chaser
The trend catcher is a trend-following indicator moves close to the price that aims to estimate the recent trend of price. It indicates green in uptrend and red in case of a downtrend.
The trend chaser is similar to the previous Trend Catcher, but it aims to chase long-term trends.
They are specially calculated from the highs and lows of price. Acts as a filter for confirmation signals and provides clarity for the direction of trend.
All of these functionalities tend to help users understand the market conditions as trending or ranging.
If you are using this script, you acknowledge that past performances are not indicative of future results and that there are a lot of factors required that go into being a profitable trader.
You can see the Author’s instructions below to get access to this prime indicator.
Bjorgum AutoTrailOne Time Trade Risk Management
Incorporating the new interactive feature, this script is meant as a one time trailing stop for the active trader to manage positional risk of an ongoing trade. As a crypto trader or Fx trader, many may find themselves in a position late into the evening, or perhaps daily life is calling while a trade progresses in their favor. Adding a trailing stop to a position thats trending can help to keep you in the trade and lock in gains if things turn around when you are unable to react.
To use the trail, the user would add the script to the chart. Once added, a set of crosshairs will appear allowing the user to choose a point to begin. Often choosing to start a trail from a swing high/ low can be an ideal option. This tends to provide some protection for a stop by placing it under support for a long trade or above resistance for a short trade.
Price based trail
The trail will automatically plot and the offset is a factor of the distance from price action selected by the crosshairs. If placed above price action the script will plot a short trail, if placed below it will trail for a long position.
Additionally, there are several other trail types other than price based. There is also percent based, which offsets the trail as a percent from close. A hard stop is placed at the cross hair value, then once the distance is exceeded by the percentage specified, the trail begins.
There are 2 more volatility based trails. There is a PSAR trail which can provide quicker and tighter stops that accelerate with the trend locking in gains faster, and an ATR trail that keeps a distance from price action as a function of volatility. Volatility levels can be adjusted from the menu.
Volatility based trail (ATR)
Volatility based trail (PSAR)
Lastly, within the code for more the more technical savvy, is some starting setups for string alerts to be sent to exchanges via 3rd party or custom API applications. Some string manipulation is required for specific providers to meet their requirements, but there is some building block alerts that will take the ticker symbol, recognize the asset your trading (Fx, Crypto, etc) and take input quantity or exchange names from the settings via inputs.
Complex strings can be built to perform almost any trade related task when to comes to alerts via web hook. A little setup this way with some technology to back your system can mean a semi-automated half man, half machine setup that actually manages your trail stop while you cannot. For those that don’t go this far, there is some basic alert functionality that well trigger when a trail is hit so you can react and make a decision.
Please note that for now, interactive mode is engaged only when the script is added to the chart. Additional stops, or for adjustments to be made it is best to add a new version. Also as real trades could be at play managing an actual position, alerts are designed to go off only once to ensure no duplicate orders are sent meaning alerts are not reoccurring. Once an alert is triggered, a new trail is to be set up.
A modified version of the TradingView built in SAR equation was used in this script. To provide the value of the SAR on the stop candle, it was necessary to alter the equation to extract this value as the regular SAR “flips” at this point. Thank you to TradingView for supplying access to the built in formula so that this SAR could behave the same as the built-in function outside of these alterations
Example of SAR value maintained in trigger candle
Cheers and happy trading.

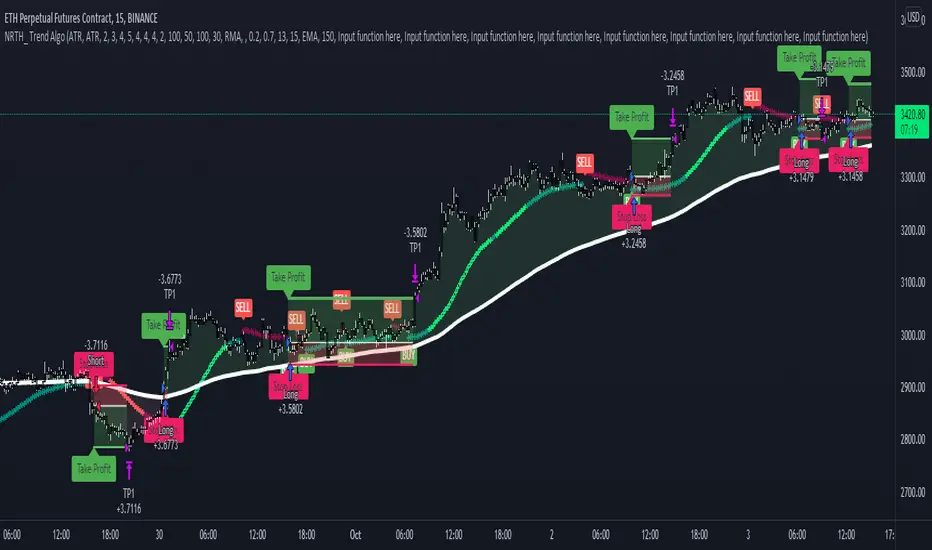
Trend AlgoA NRTH_ Premium Momentum Based Strategy
Comes included with the Premium Package.
Indicator features
Built-In Alerts
Visual Risk Management
Customizable Entry Rules
Usage Tips
This strategy works on timeframes as low as 5m, great for scalping or day trading.
The algo identifies price momentum with strict entry signal settings (can be made more or less sensitive).
Works for all markets with the ability to customize to your liking.
Backtesting Results Info
Period 1/1/2021-1/10/2021
Entry value at $1000 with 10x leverage
Binance standard taker fee rate (0.04%)
ATR Exits : 1:2 RR
-------------------------------------------
Disclaimer
Copyright NRTH_ Indicators 2021.
NRTH_ and all affiliated parties are not registered as financial advisors. The products & services NRTH_ offers are for educational purposes only and should not be construed as financial advice. You must be aware of the risks and be willing to bear any level of risk to invest in financial markets. Past performance is not necessarily indicative of future results. NRTH_ and all individuals associated assume no responsibility for your trading results or investments.
All investments involve risk, and the past performance of a security, industry, sector, market, financial product, trading strategy, or individual’s trading does not guarantee future results or returns. Investors are fully responsible for any investment decisions they make. Such decisions should be based solely on an evaluation of their financial circumstances, investment objectives, risk tolerance, and liquidity needs.
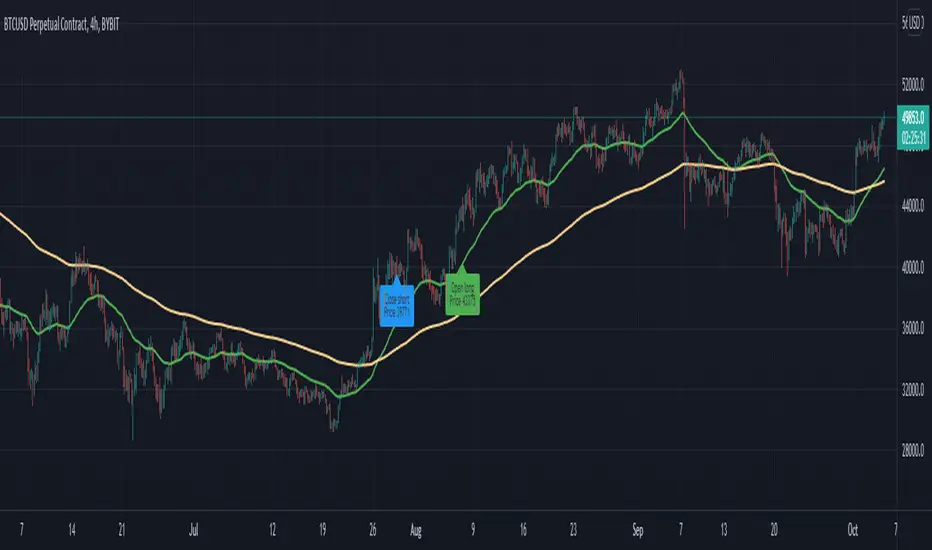
EMASAR Investor ModePLEASE READ THE FULL DESCRIPTION BEFORE BUYING OR USING THIS INDICATOR
THIS IS THE INVESTOR MODE ONLY VERSION OF THE EMASAR INDICATOR. IT INCLUDES THE ORIGINAL SIGNALS TELLING YOU WHEN TO BUY OR SELL. IT ONLY INCLUDES THE OCEAN TO INDICATE PULLBACKS AND NOT OTHER TRADING REGIONS ARE INCLUDED. IT SHOWS THE BUY/SELL SIGNALS AS WAS PUBLISHED IN THE ORIGINAL VERSION OF EMASAR
EMASAR (pronounced Emma-sar) is a strategy based on Exponential Moving Averages and the Parabolic SAR. This is a position trading approach that is derived from Tyler Jenks’ Consensio.
This strategy was developed with four objectives in mind: (1) managing risk (2) protecting from missing out on major moves (3) maximizing risk:reward (4) staying in a trending market and taking profit before it fully reverses.
EMASAR does a great job at accomplishing all of the above through the buy and sell signals that are generated. The data provided below is from the signals that occurred on Bitcoin ( Bitstamp ) from January 1, 2015 to present (November 11, 2019).
(1) Risk is tightly managed, relative to the winners, and losing positions will be exited before the market moves too far against.
The biggest losing trade on Bitcoin , for the time period outlined above, is -18.47%.
(2) Following the EMASAR buy and sell signals guarantees that one will not miss out on a major trend. As a result of the indicators used for this system it is mathematically impossible for a major trend to occur without providing a buy or sell signal. This system isn't meant to catch exact tops or bottoms but it will do a great job of capturing ~85% of a trend.
(3) On average the winning trades will be 5.55 times the losing trades. There will be stretches where the losers are bigger than the winners and this could last for many months, maybe even a year. However, over the long run the average reward is expected to be 5.55 times the average risk*.
*Past performance does not guarantee future results!
(4) This indicator was designed to capitalize on parabolic markets, specifically Bitcoin and alt coins. Crypto markets have a tendency to get moving so fast that many indicators become all but useless.
Entries can get signaled too late and exits will get signaled way too early. This is specifically true when using oscillators that are designed to identify overbought or oversold environments. EMASAR does a great job of keeping us in a position for the duration of a trend and this includes the major parabolic runs that Bitcoin has a tendency to go on.
When Bitcoin , or other alts, really get moving it can be very difficult to distinguish between a correction and a full reversal. We do not want to be exiting during a minor correction, instead this is a time when we want to be holding on or looking to buy the dip.
This is a very fragile balance. The market has a very strong tendency to make corrections looks like reversals and to make reversals look like corrections. Therefore it is very important to have a tool(s) that you trust to distinguish in between the two.
I believe that EMASAR is the best way to find that balance - if I knew of a better way then I would be using it instead!
Following these signals will help us to hold onto positions while the market is still trending in our favor when most think that it has moved too far / too fast, and it will also get us out before a market fully reverses.
Keep in mind that there will be times when we exit a market that is in danger of reversing, only to buy back higher later on. That is okay because it enables us to properly manage risk during times of uncertainty and buying back in at a higher price is more than worth the opportunity cost.
Risks
The biggest risks with trading EMASAR revolve around disobeying the signals. Risk management is built into this system with the exit signals that will occur, however it is up to the individual to execute those signals. Passing on an exit signal could lead to a big loss which would have a dramatic impact on the ROI . Most trading systems will have small and medium losses with small, medium and large wins. That is exactly how this works. The small - medium losses and wins will mostly be a wash and will account for roughly 80% of the trades. The large wins will happen about 20% of the time and will make up 80% - 90% of the profits.
Therefore the two biggest risks are passing on signals entirely, or exiting preemptively. Getting chopped in and out of a market can be quite frustrating. If you become overwhelmed with negative emotions then it could cause you to pass up on the next signal. That signal will often be the one that more than makes up for the small - medium losses that preceded.
On average EMASAR will provide one signal every 6 weeks when using the default settings on the 4h chart. Therefore missing one entry could turn an otherwise profitable year into a loser. If electing to trade a system, whether it is EMASAR or another, it is crucial to commit to taking every signal regardless of outside variables (namely your personal bias about market direction or frustration that follows a losing stretch).
Another major risk with this system is taking too much profit too soon. When getting into a trade that has the potential to be a big winner it can be challenging to continue holding through the swings. Anyone that has watched paper profits vanish will be inclined to start exiting after the market makes a big move in his or her favor. While this is better than watching profits completely evaporate, this mistake can be enough to turn a profitable system into one that loses to the market. If 80% - 90% of our profits come from 10% - 20% of our trades then it is vital we do not cut those positions off at the knees.
If taking too much profit too soon then you will consistently turn potential large winners into medium winners. This may lead to making money over the long run which will make it very difficult to realize that anything is wrong. However making money and beating the market are two very different things. Exiting early and making money is nearly as big of a risk as missing entries entirely.
If you have the discipline to execute signals in a timely manner after they are triggered and the emotional control to let the winners run despite the appearance of a vastly overbought / oversold market, then you should have what it takes to beat the market with EMASAR.
If you are not an experienced trader then it is very important to start out small. The only way to learn is to trade in a live environment and the only way to succeed is to risk much less than you can afford to lose. If you have $2,000 to trade with then start with a maximum position size of $20 - $50 and don’t be shy about scaling that down even further. Focus on ROI instead of actual dollars made. If you can return 100% on a $20 roll then you should be able to do the same with a $2,000 roll.
Important Notes
Make sure that you read / understand the risks outlined above. If you jump into this without understanding the unique risks that this system entails then you are going to have a bad time.
This indicator was developed around the 4h and that is where it works best. For crypto adjusting to higher TF’s will cause for bad results as the entries / exits will be late to the party. For traditional markets the Daily - Weekly time frames are preferred. It was not originally intended for smaller TF's but we have seen some good results on the 15m and 1h. The RSI can be a great compliment when using on smaller TF's. Adding a rule for not entering when RSI > 75 or < 25 and instead entering when RSI retests 50 will help to avoid some bad signals.
Alerts can be set for this indicator. Simply make sure that it is visible on the chart, then click the alert icon on the top panel. In the first dropdown set 'Condition' to 'EMASAR' and the second 'Condition' for the upcoming signal. For example if just entered long then set the second condition to 'Close Long' and you will be notified as soon as that signal occurs. If waiting for the next long entry then set the second condition to 'Open Long' so on and so forth . There is an 'All in One' alert that is also available. If you select that then you will be alerted any time that a signal occurs. The message will tell you to check the chart to see which signal caused the alert.
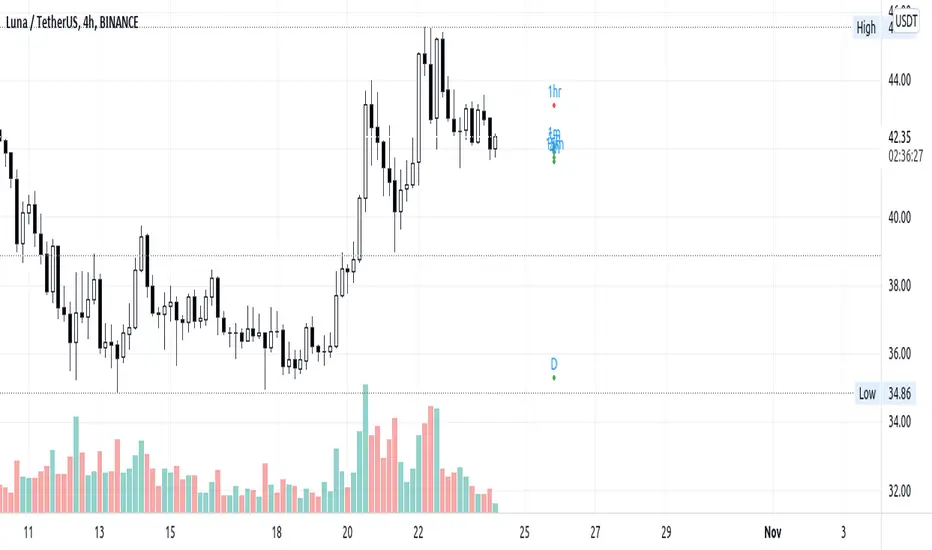
SAR MTF levelsThis indicator displays last Parabolic SAR dot levels on most common timeframes. Default option is cross shape, but can be set as lines as well. Very easy to track visually, without continuously changing chart resolution.
Baekdoo multi OverSold OverBuy colored CandleHi forks,
I'm trader Baekdoosan who trading Equity from South Korea. This Baekdoo multi OverSold OverBuy colored candle will give you the idea of
multiple indicators in one shot with colored candle. Those indicators tell us that oversold or overbuy statistically. For the color, you can freely change
based on your comfort. For me, in Korea white candle has red color and black candle has blue color. So somewhat confusing for you. Anyway you can
easily modify color in the script. Please refer this line.
barcolor(open<close and result_pos == 4 ? color.new(color.red, 0) : open<close and result_pos == 3 ? color.new(color.red, 25) : open<close and result_pos == 2 ? color.new(color.red, 50) : open<close and result_pos == 1? color.new(color.red, 75) : na)
you can see I put different transparency at color.new() function with color code. Let me divide and conquer to explain for up candle
white candle and black candle.
1. White candle
with 4 oversold signal case with white candle tells us it is almost reached real bottom and try to rebound. In this case, I put vivid color (no transparency) on the candle. And all 4 signal case, I put text on "OverSold". It will not happen frequently. Then 2 approaches can be made.
(a) short term approach
You can buy on this time. and you set stop loss with open price. This is mainly aimed for technical rebound.
(b) long term approach
You can accumulate based on your budget with 5 times dividing. At that day might not be the very bottom but those period will most probably real bottom. You can put more weight on latter buy. Let say, 1 : 1.25 : 1.5 : 1.75 : 2.5. So for example, if you have $8,000 to investigate then, buy $1,000 and then $1,250, $1,500, accordingly. If price rebound then don't adding weight on accumulation but with the first amount that you buy(i.e., $1,000 with above example). With this approach, you will not have much stress and you will get profit well. If this is grand bottom case, then you can HODL this long term. What you needs is stick to the plan. :)
with 3 signals the color is less vivid, 2 signals is much less vivid, accordingly.
2. Black candle
The approaches are opposite to above. The signal will tells us for 4 overBuy signals, then vivid blue candle will be shown. Our strategy is distribute to sell. Please do not sell in one shot. As Newton said, "I can calculate the motions of the heavenly bodies, but not the madness of the people". Strong buy phase, we don't know how far will it go. But indicators will tell us it is quite overSold situation. So what I can suggest you is sell it 10% to 20% on resistance price, and put 50% of lower than certain support price. Remember, accumulation and distribution will always better than one shot trading if you want to survive long time on this war field.
Hope this will help your trading on equity as well as crypto. I didn't try it on futures. Best of luck all of you. Gazua~!

PSAR + EMA/TEMA/RSI/OBVThe Parabolic Stop-and-Reservse (PSAR) is a trend indicator, intended to capture reversal signals and show entry and exit points. The PSAR is bullish when the PSAR is below the candle body (usually indicated by a dot) and bearish when the PSAR is above the candle body. The PSAR generally only moves in the direction of the trend, making it useful for markets with an upward or downward trend, as well as swing markets. It is weaker when the market it sideways, as it can be prone to frequent flips (bull-to-bear or vice versa) in markets where a predominant trend is not present.
In order to combat the tendency for rapid swings in the PSAR, it is commonly paired with a second indicator. Often, this is a moving average (MA) to confirm the PSAR signal. Here is a common example:
PSAR + 2 EMAs: A trade would consider entering long when the PSAR is bullish and the fast EMA is above the short EMA.
PSAR + 3 EMAs: As above, but the trader could also add a very long EMA (200, for example) and use that as an additional filter.
In addition to using EMA, other MAs can be used and may be more appropriate to certain instruments and timeframes. Using TEMA, for example, may result in less lag but introduce more noise. Likewise, the Ehler's MAMA is an option.
Some traders use other indicators as PSAR confirmation signals, such as the relative strength index (RSI) on on-balance volume (OBV). The strategy is similar:
bullish PSAR + RSI oversold = consider long entry
bullish PSAR + OBV oscillator > 0 = consider long entry
The strategy presented here is based on my PSAR + EMA + TEMA study. Any of the above strategies are supported by this script:
1. The PSAR is the primary signal.
2. Confirmation is provided by any of the following: EMA , TEMA , Ehler's MAMA , RSI , or OBV.
3. You may use a third EMA (set to 200 as the default) to filter entries -- if used, the strategy will only show signals if the price is above the third (additional) EMA .
For example, a normal long signal would be a bullish PSAR + fast EMA > slow EMA + price > ema 200.
In addition, you may use a SL, which is set to the PSAR dots shown. You may also limit the backtesting dates. (Please note in the chart above, I do not have a limit on the trading dates. I believe this exaggerates the success of the strategy, but the house rules demand I not limit the timeframe to show you a more accurate picture.)

SAR-adjusted extremesThis indicator shows how far (i.e. the absolute distance) of the extremes (i.e. high & low) are from the current parabolic SAR

Parabolic SAR + Take Profit and Stop Loss By Nussara (strategy)Back test strategy for "Parabolic SAR + Take Profit and Stop Loss By Nussara" make it easy setting a strategy to estimate profits and losses.
This strategy uses Parabolic SAR . The Parabolic SAR is a technical indicator developed by J. Welles Wilder to determine the direction that an asset is moving. The indicator is also referred to as a stop and reverse system, which is abbreviated as SAR . It aims to identify potential reversals in the price movement of traded assets.
This indicator has a function to take profit and stop loss level.
Stop loss level = First reverse point of uptrend
Take profit level = Entry price + (Entry price-Stop loss level)
User can set a parabolic SARS and a profit point but I fixed stop loss level at first reversals point of uptrend. I also put alert for Buy, Sell, Stop Loss in this indicator.
This indicator is just a tool for technical analysis . It shouldn't be used as the only indication of trade because it causes you to lose your money. You should use other indicators to analyze together.

Parabolic SAR + %Take Profit and %Stop Loss By NussaraThe parabolic SAR is calculated almost independently for each trend in the price. When the price is in an uptrend, the SAR emerges below the price and converges upwards towards it. Similarly, on a downtrend, the SAR emerges above the price and converges downwards. At each step within a trend, the SAR is calculated one period in advance. That is, tomorrow's SAR value is built using data available today. The general formula used for this is:
SAR n+1=SAR n+ α (EP-SAR n)
where SAR n and SARn+1 represent the current period and the next period's SAR values, respectively.
EP (the extreme point) is a record kept during each trend that represents the highest value reached by the price during the current uptrend – or lowest value during a downtrend. During each period, if a new maximum (or minimum) is observed, the EP is updated with that value.
The α value represents the acceleration factor. Usually, this is set initially to a value of 0.02, but can be chosen by the trader. This factor is increased by 0.02 each time a new EP is recorded, which means that every time a new EP is observed, it will make the acceleration factor go up. The rate will then quicken to a point where the SAR converges towards the price. To prevent it from getting too large, a maximum value for the acceleration factor is normally set to 0.20. The traders can set these numbers depending on their trading style and the instruments being traded. Generally, it is preferable in stocks trading to set the acceleration factor to 0.01, so that it is not too sensitive to local decreases. For commodity or currency trading, the preferred value is 0.02.
-If the next period's SAR value is inside (or beyond) the current period or the previous period's price range, the SAR must be set to the closest price bound. For example, if in an upward trend, the new SAR value is calculated and if it results to be more than today's or yesterday's lowest price, it must be set equal to that lower boundary.
-If the next period's SAR value is inside (or beyond) the next period's price range, a new trend direction is then signaled. The SAR must then switch sides.
Upon a trend switch, the first SAR value for this new trend is set to the last EP recorded on the prior trend, EP is then reset accordingly to this period's maximum, and the acceleration factor is reset to its initial value of 0.02.
I previously released a script called "Parabolic SAR + Take Profit and Stop Loss By Nussara" which I used Parabolic SAR to enter an order and set a stop loss on the first SAR value of uptrend and users can fixed reward for taking profit. This script I use the order entry the same method as "Parabolic SAR + Take Profit and Stop Loss By Nussara", but I use the % of entry price to calculate take profit and stop loss.
Stop loss = Entry Price * (1 - stop loss)
Take profit = Entry Price * (1 + take profit)
This indicator is just a tool for technical analysis . It shouldn't be used as the only indication of trade because it causes you to lose your money. You should use other indicators to analyze together.

EMA 200 + Parabolic SAR + RSI + Take Profit Stop Loss By NussaraThe Parabolic SAR is a technical indicator developed by J. Welles Wilder to determine the direction that an asset is moving. The indicator is also referred to as a stop and reverse system, which is abbreviated as SAR . It aims to identify potential reversals in the price movement of traded assets.
EMA 200 ( Exponential Moving Average ) is important because it determines the overall trend, filters a trading system, and reacts faster than the 200 MA.
The relative strength index ( RSI ) is a technical indicator used in the analysis of financial markets. It is intended to chart the current and historical strength or weakness of a stock or market based on the closing prices of a recent trading period. RSI movement above 50 indicates that more traders are buying assets than selling, and are driving the price up. If the RSI moves below 50, it shows that more traders are selling than buying, and are driving the price down.
This indicator uses EMA 200, RSI and parabolic SARS.
The order will be entered when 3 conditions are true
1. First reverse point uptrend of Parabolic SAR
2. The price is close above EMA 200
3. RSI is over 50.
This indicator has a function to take profit and stop loss level.
Stop loss level = First reverse point uptrend of Parabolic SAR .
Take profit level = 1:1.5
This indicator is just a tool for technical analysis . It shouldn't be used as the only indication of trade because it causes you to lose your money. You should use other indicators to analyze together.

Crypto Scalper Divergence Macd Psar Ema 200This is a very efficient crypto scalper adapted to very short timeframes, however it can be optimized for other timeframes and assests as well.
Its components are
MACD
P SAR
EMA 200
Risk management
Rules for entry:
For short : we have an uptrend on PSAR , histogram is positive (divergence MACD) and close of a candle is below EMA 200
For long : we dont have an uptrend on PSAR, histogram is negative(divergence MACD) and close of a candle is above EMA 200
Rules for exit:
We exit when we either find a reverse condition than the entry one, or based on stop loss/take profit that are calculated on % movements of the price.
If you have any questions, let me know !

[VJ]Phoenix Force of PSAR +MACD +RSIThis is a simple intraday strategy for working on Stocks or commodities based out on PSAR, MACD , RSI and chop index . You can modify the start time and end time based on your timezones. Session value should be from market start to the time you want to square-off
Important: The end time should be at least 2 minutes before the intraday square-off time set by your broker
Comment below if you get good returns
Strategy: Entry Exits using PSAR and momentum and trend using MACD and RSI. A chop index is used as filtering
Indicators used :
Parabolic SAR is a technical indicator that is used to determine the price direction of stocks and it also draws attention to the traders when the price is changing
PSAR helps you:
Identify when a certain price trend is going to change direction
Indicate the most effective level at which to enter into the trade
Indicate the most effective exit point for the trade
Moving average convergence divergence (MACD) is a trend-following momentum indicator that shows the relationship between two moving averages of a security's price. ... Traders may buy the security when the MACD crosses above its signal line and sell—or short—the security when the MACD crosses below the signal line
RSI is intended to chart the current and historical strength or weakness of a stock or market based on the closing prices of a recent trading period.
Buying/Selling
When trading with the parabolic SAR, you would buy a market when the dots move below the current asset price and are green in colour. Alternatively, you would sell a market when the dots move above the current asset price and are red in colour. We use MACD , RSI to ensure that a right trade is picked when PSAR gives an indication. CI is used to stay away from the range bound market as much as possible.
Usage & Best setting :
Choose a good volatile stock and a time frame - 5m.
MA length : 200
RSI threshold : 50
MACD: 12,26,9
There is stop loss and take profit that can be used to optimise your trade
The template also includes daily square off based on your time.

Forex bot full strategy with risk managementThis is a full strategy designed for forex major pairs, specially EUR/USD using 1h time frame chart.
Its components are
200 EMA
MACD
OBV
PSAR
RIsk management with tp and sl movements
Rules for entry
For long = Previous histogram from MACD was below 0 and current one is above 0. CLose of a candle is above EMA 200 , OBV oscillator is negative and we have an uptrend from PSAR
For short = Previous histogram from MACD was above 0 and current one is below 0. CLose of a candle is below EMA 200 , OBV oscillator is positive and we have an downtrend from PSAR
Rules for exit
For tp and sl values we calculate the distance from the close of candle until the psar values.
If you have any questions, let me know !

TradePro Parabolic SAR BackgroundTradePro Parabolic SAR Background
This indicator is a small tribute to youtuber TradePro
The operation is simple. It is the same Parabolic SAR indicator with its default configuration, but in background format. It is a new way to visualize the same information, more understandably. It is in itself a complete trading system, it can be used in conjunction with the traditional Parabolic SAR to locate the stop loss.
Parabolic SAR
In stock and securities market technical analysis, parabolic SAR (parabolic stop and reverse) is a method devised by J. Welles Wilder, Jr., to find potential reversals in the market price direction of traded goods such as securities or currency exchanges such as forex. It is a trend-following (lagging) indicator and may be used to set a trailing stop loss or determine entry or exit points based on prices tending to stay within a parabolic curve during a strong trend.
Similar to option theory's concept of time decay, the concept draws on the idea that "time is the enemy". Thus, unless a security can continue to generate more profits over time, it should be liquidated. The indicator generally works only in trending markets, and creates "whipsaws" during ranging or, sideways phases. Therefore, Wilder recommends first establishing the direction or change in direction of the trend through the use of parabolic SAR, and then using a different indicator such as the Average Directional Index to determine the strength of the trend.
A parabola below the price is generally bullish, while a parabola above is generally bearish. A parabola below the price may be used as support, whereas a parabola above the price may represent resistance.

[francrypto® strategy] 4 EMAs, P.SAR & Vol.Prof. (by kv4coins)(ENG)
This script consists of my own strategy for cryptocurrency (but can be adapted very well for stocks, forex, etc.)
Is a combination of:
- Four Exponentials Moving Average (EMA), configurables: by defect are 10, 21, 55 and 200 periods in yellow, aqua, orange and blue each of them
- Parabolic SAR System (PSAR), configurable
- Volume Profile (that has been developed by kv4coins - he has already authorized me to use it under the same OSS Licence Terms: MPL 2.0), configurable: with another default values and bilingual support for Spanish (SPA)
How it works
1) It is always better to detect specifics candlesticks or patrons: doji , pinbar or inverted pinbar , engulfing bars , morning star or evening star , harami , twizzer bottom or top , etc.
2) The 10 and 21 periods EMA help to identify the short-term behavior
3) The 55 periods EMA can be used like a support or resistance in medium-term, as 200 periods EMA in very long-term
4) It will convenient search for a double cross (10 & 21) or a triple cross (10, 21 & 55) to determine the medium-term change Downtrend to UpTrend (or viceversa)
5) Confirm the change patron with the Parabolic SAR and then identify potencials purchases or sales
6) Use Volume profile to detect potential supports or resistances areas, in order to set stop limit/loss and take profit orders.
Hope this helps!
Cheers,
FRANCRYPTO®
–––––– 0 ––––––
(ESP)
Este script consiste en mi propia estrategia para criptomonedas (pero puede adaptarse muy bien para acciones, forex, etc.)
Es la combinación de:
1) Cuatro Medias Móviles Exponenciales (EMA), configurables: por defecto son de 10, 21, 55 y 200 períodos en amarillo, turquesa, naranja y azul cada una de ellas
2) Sistema Parabolic SAR (PSAR), configurable
3) Perfil de Volumen (que fuera desarrollado por kv4coins - que ya me ha autorizado a su uso bajo las mismas condiciones de la Licencia OSS: MPL 2.0), configurable: con otros valores por defecto y soporte bilingüe para Español (SPA)
Cómo funciona
1) Siempre va a resultar mejor detectar velas japonesas específicas o patrones: doji , martillos o martillos invertidos , velas envolventes , patrón amanecer o atardecer , harami , velas gemelas , etcétera
2) La EMA de 10 y 21 períodos ayudan a identificar el comportamiento de corto plazo
3) La EMA de 55 períodos puede ser usada como un soporte o resistencia de mediano plazo, como así también, la EMA de 200 períodos en el muy largo plazo
4) Será conveniente buscar un doble cruce (10 & 21) o un triple cruce (10, 21 & 55) para determinar un cambio de la tendencia de mediano plazo de bajista hacia alcista (o viceversa)
5) Confirmá el patrón de cambio con la Parabólica de SAR y entonces identificá potenciales compras o ventas
6) Usá el perfil de volumen para detectar las potenciales zonas de soporte o resistencia, principalmente para establecer ordenes stop limit/loss o take profit.
¡Espero que pueda serles de utilidad!
Saludos,
FRANCRYPTO®

PSAR + EMA + TEMACombined PSAR with EMA and/or TEMA lines, including fast/slow plots, for entry/exit signals. Includes signals for all plots.
Credit to TEMA With Alert by BerkSay and Parabolic SAR by Alex Orekhov (everget).

[Sidders] MACDEMASAR IndicatorCame across a cool idea for a strategy that couldn't find in the indicator database, so decided to code it up myself for your pleasure.
Indicators consists of 3 indicators: EMA(200) to determine the overall trend, and the MACD & Parabolic SAR to determine entries (and exits).
Long entry contains 4 conditions and is generated when price is above the 200EMA (1), the MACD crosses above the signal line (2), while they are both below 0 line (3) and when the parabolic SAR is below the closing price of the bar (4).
Short entry is build up the same but in reverse: price is below the 200EMA(1), signal line crosses below the MACD line (2), while they are both above the 0 line (3) and when the parabolic SAR is above the closing price of the bar (4).
Place the stoploss on the parabolic SAR dot below/above the candle that created the signal. Profit target 1:1 risk:reward ratio, but can ofcourse be changed according to your risk apetite. Might add automatically drawn SL/TPs in a later update.
Concept behind the strategy should work on all timeframes, but will require proper backtesting. I think with additional filters the strategy can also be way more finetuned and profitable, personally haven't had the time yet to dive into that.
Have also added alerts for your convenience.
Enjoy!

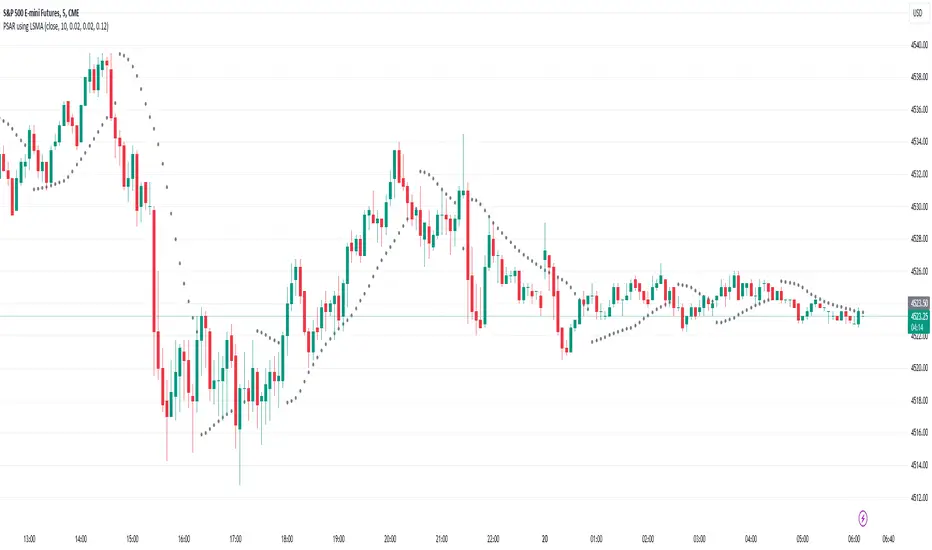
PSAR using Moving Linear Regression (LSMA)Works exactly as the standard PSAR with the only difference that a Moving Linear Regression Line (=Least Squares Moving Average, LSMA) is used as input.
So the PSAR flip is triggered not by price itself but by the LSMA line.
Bjorgum SuperScript
Bjorgum Reversal
Bj Reversal uses Tilson moving averages to identify trend changes
Bars change to yellow as bar close crosses the Tilson moving averages. Blue or red is confirmed as the two Tilson averages themselves cross.
Reversal is great for pinpointing trend change often giving the absolute best entry or exit
Its sensitive nature can mean more false signals on some assets
Be sure to use other indicators from the Bjorgum Collection to confirm signals, or use another strategy that fits the asset or time frame being viewed
Bjorgum HEMA Strategy
Hema uses HA smoothed EMAs to identify trend direction
Default EMA lengths are 5,9, and 21 period
Bar Color will change Malibu or Ruby on a cross of BOTH 5 and 9 EMA
The lengths are customizable to whatever lengths the user desires
Rolando Santos True Relative Movement (TRM)
This underrated momentum strategy conceptualized by Rolando Santos uses 2 indicators to give a 3 color scheme
A leading indicator (RSI) is combined with a lagging indicator (TSI) to produce bar colors based on the condition of each indicator
Both indicators in positive territory produce blue bars
Both indicators in negative bias produce yellow bars
If signals are mixed (one up one down) bars become grey
Speed Selection
The Bjorgum speed selector optimizes the strategy based on the users desires or trading style at the touch of a button
Fast setting is better for swing trades - more timely signals, more whipsaw
Slow setting is better for longer holds or more volatile assets - slower signals, smooths out whipsaw
RSI Bar Color
RSI color changes bar color based on user defined RSI values
Buy/ sell signals are typically given on a cross of the 50 level
Speed selector (fast/Slow) automatically changes lengths between Bj RSI (5 period) and a standard RSI (14 period)
Additional capabilities can be mixed and matched from strategies in the "Strategy Override" section
Add-ons include:
Tilson - The moving average system from Bjorgum Reversal can be toggled to couple with another bar color strategy by clicking this button
PSAR - Parabolic Stop and Reverse indicator can help with trend direction, volatility, and stop losses
HEMA - The 3 moving average system from the HEMA strategy can be coupled with any of the other strategies by clicking "Show HEMA"
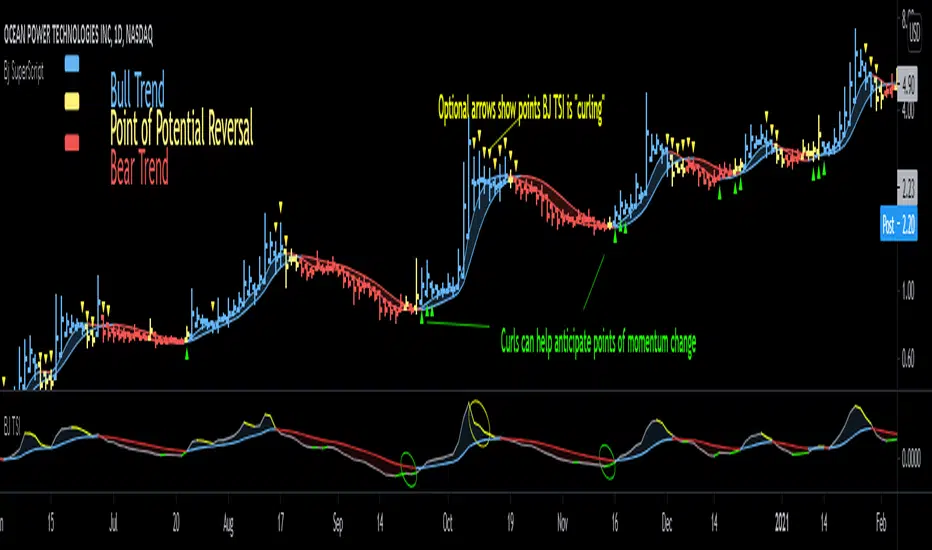
Bj Arrows - These arrows plot at the bar level to draw attention to when the BJ TSI is "curling" (See profile for Bjorgum TSI and download today)
-Optional "Plotbar Overlay" plots bars with Heikin-Ashi Inputs when toggled
-This allows for the benefits of price smoothing without sacrificing moving average and indicator performance as real close value is still used
-This can also help on short time frames and improve results with crypto! The user must "mute" the main series candles when in use to avoid candle overlap.
-Optional price line as muting main bars will disable the TradingView default price line. The horizontal plot will track the real closing price while in HA mode!
Alert// Short+long: SAR+HMA+Bollinger+support/resistanceHello, dear friends.
This script can be used for various strategies. Whether it's a scalp like now or more positional purchases. To determine the minimum and maximum, SAR ,resistance points, support points+HMA+ Bollinger channel are used. The entry occurs when the SAR intersects with the HMA , if it is above or below the support/ resistance levels.
In the settings there is a "back" how many bars to use back to search for these conditions.Also the standard setting is SAR+ multiplier.
The strategy based on these alerts is the same, but the conditions stipulate that the entry into the deal does not occur (while you are in the deal) if the purchase is more expensive than the previous one.

PSAR-Risk Strategy Analysis ToolThis is the strategy version of my PRS indicator, information of how it works and parameters explanation is located there. This generates performance chart and an exportable trading log, but it's incapable of sending alerts (the reason of the fork). Use this tool for backtesting information and the original PRS to generate the alerts, once the optimal input values have been found with this tool.
