Canal parallèle


ATR Channel Multi-Timeframe / EMA / SMAFeatures:
Select alternate resolution
Select type of moving average
Select custom multiplicator

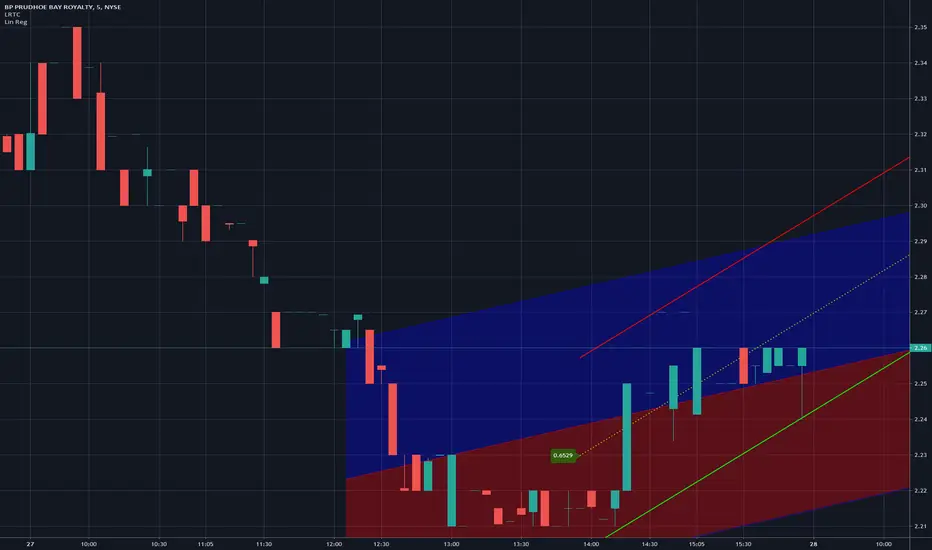
Linear Regression Trend ChannelThis is my first public release of indicator code and my PSv4.0 version of "Linear Regression Channel", as it is more commonly known. It replicates TV's built-in "Linear Regression" without the distraction of heavy red/blue fill bleeding into other indicators. We can't fill() line.new() at this time in Pine Script anyways. I entitled it Linear Regression Trend Channel, simply because it seems more accurate as a proper description. I nicely packaged this to the size of an ordinary napkin within 20 lines of compact code, simplifying the math to the most efficient script I could devise that fits in your pocket. This is commonly what my dense intricate code looks like behind the veil, and if you are wondering why there is no notes, that's because the notation is in the variable naming. I excluded Pearson correlation because it doesn't seem very useful to me, and it would comprise of additional lines of code I would rather avoid in this public release. Pearson correlation is included in my invite-only advanced version of "Enhanced Linear Regression Trend Channel", where I have taken Linear Regression Channeling to another level of fully featured novel attainability using this original source code.
Features List Includes:
"Period" adjustment
"Deviation(s)" adjustment
"Extend Method" option to extend or not extend the upper, medial, and lower channeling
Showcased in the chart below is my free to use "Enhanced Schaff Trend Cycle Indicator", having a common appeal to TV users frequently. If you do have any questions or comments regarding this indicator, I will consider your inquiries, thoughts, and ideas presented below in the comments section, when time provides it. As always, "Like" it if you simply just like it with a proper thumbs up, and also return to my scripts list occasionally for additional postings. Have a profitable future everyone!
Kaufman Adaptive BandsIntroduction
Bands are quite efficient in technical analysis, they can provide support and resistance levels, provide breakouts points, trailing stop loss/take profits positions and can show the current market volatility to the user. Most of the time bands are made from a central tendency estimator like a moving average plus/minus a volatility indicator. Therefore bands can be made out of pretty much everything thus allowing for any kind of flavors.
So i propose a band indicator made from a Kaufman adaptive moving average using an estimate of the standard deviation.
Construction
The Kaufman moving average is an exponential averager using the efficiency ratio as smoothing variable, length control the period of kama and in order to provide more smoothness a power parameter has been introduced, higher values of power will return smoother results.
The volatility indicator is made from a biased estimation of the standard deviation by using the square root of the mean of the square minus the square of the mean method, except that we use kama instead of a mean.
The bands are made by adding/subtracting this volatility indicator with kama.
How To Use
The ability of the indicator to adapt to the current market state is what makes him a great tool for avoiding major exposition during ranging market, therefore the indicator will have a greater motion during trending market, or more simply the bands will move during trending markets while staying "flat" during ranging ones. Therefore the indicator might be more suited to breakouts, even if some cases will return what where turning points, this is particularly true during ranging markets.
Of course the efficiency ratio is not an "unbiased" trend metric indicator, it can consider high volatility markets as trending markets. Its one of his downsides.
High values of power will create smoother bands.
When using a low power parameter use an higher mult. In general using a low power value will make the bands move more freely as well as making them closer to each others.
Conclusion
At least the indicator is really nice to the eyes when using high power values, its ability to adapt to the market is a great addition to other more classical bands indicators, i also introduced a volatility estimator based on kama, some might have used the following estimation : kama(abs(price - kama)) which would have created a slower result. A trailing stop might be made from it if i see request about such addition.
If you are curious here are some more images of the indicator performing on different markets. Thanks for reading !

Combo Strategy 123 Reversal & CCI This is combo strategies for get a cumulative signal.
First strategy
This System was created from the Book "How I Tripled My Money In The
Futures Market" by Ulf Jensen, Page 183. This is reverse type of strategies.
The strategy buys at market, if close price is higher than the previous close
during 2 days and the meaning of 9-days Stochastic Slow Oscillator is lower than 50.
The strategy sells at market, if close price is lower than the previous close price
during 2 days and the meaning of 9-days Stochastic Fast Oscillator is higher than 50.
Second strategy
The Commodity Channel Index (CCI) is best used with markets that display cyclical or
seasonal characteristics, and is formulated to detect the beginning and ending of these
cycles by incorporating a moving average together with a divisor that reflects both possible
and actual trading ranges. The final index measures the deviation from normal, which indicates
major changes in market trend.
To put it simply, the Commodity Channel Index (CCI) value shows how the instrument is trading
relative to its mean (average) price. When the CCI value is high, it means that the prices are
high compared to the average price; when the CCI value is down, it means that the prices are low
compared to the average price. The CCI value usually does not fall outside the -300 to 300 range
and, in fact, is usually in the -100 to 100 range.
WARNING:
- For purpose educate only
- This script to change bars colors.


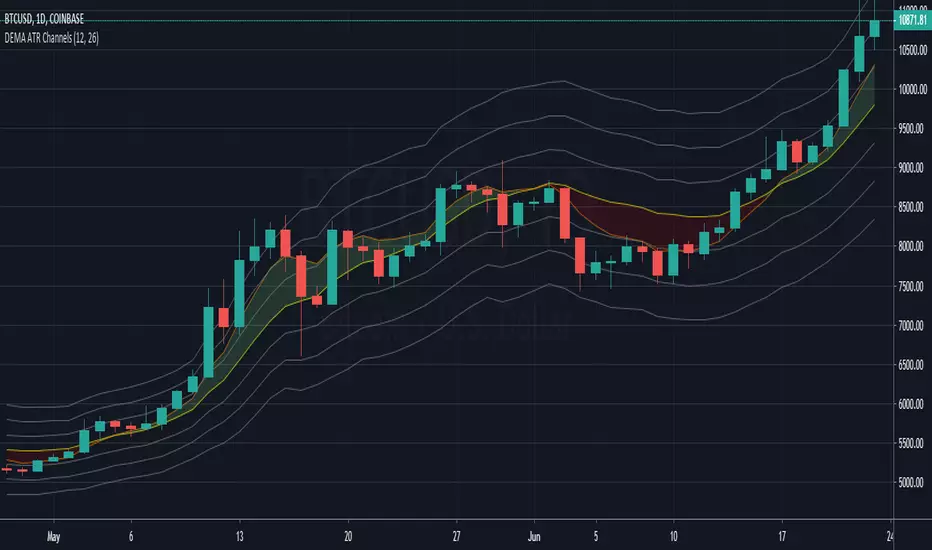
DEMA ATR Channels - New IndicatorA Double Exponential Moving Average (DEMA) with three sets of channel lines each one Average True Range (ATR) apart, above and below the DEMA.
Similar to my "ATR Channels" indicator, but using a DEMA instead of an EMA for the base. In addition, this indicator also plots a fast DEMA as well as a fill between the two. Fully customizable, you can toggle both DEMAs, the fill, and each set of ATR Channels.
ATR channel idea from Kerry Lovvorn as mentioned in Elder's "New Trading for a Living", page 93: "Kerry Lovvorn likes to plot 3 sets of lines around a moving average: at one, two, and three ATRs above and below an EMA . These can be used for setting up entry points and stops, as well as profit targets."
Volume Weighted Donchian ChannelsDonchian channels weighted with volume, they are now closer to the price and can cross it.

♒RBCI - Range Bound Channel Index by Cryptorhythms♒ RBCI - Range Bound Channel Index by Cryptorhythms
Intro
This is my best approximation of the RBCI. Its not perfect, but it does the job well enough.
A good way to use it is to enter when the singal line (light blue) RE ENTERS the channel from below. I circled these points on the indicator in green.
Description
Information to create was gathered mostly here: www.finware.com
RBCI (Range Bound Channel Index) – is calculated by means of the channel (bandwidth) filter (CF). Channel filter simultaneously fulfills two functions:
Removes low frequent trend formed by low frequent components of the spectrum with periods, more T2= 1/fc2;
Removes high frequency noise formed by the high frequent components of the spectrum with periods, less T1= 1/fc1.
👍 Enjoying this indicator or find it useful? Please give me a like and follow! I post crypto analysis, price action strategies and free indicators regularly.
💬 Questions? Comments? Want to get access to an entire suite of proven trading indicators? Come visit us on telegram and chat, or just soak up some knowledge. We make timely posts about the market, news, and strategy everyday. Our community isn't open only to subscribers - everyone is welcome to join.
For Trialers & Chat: t.me

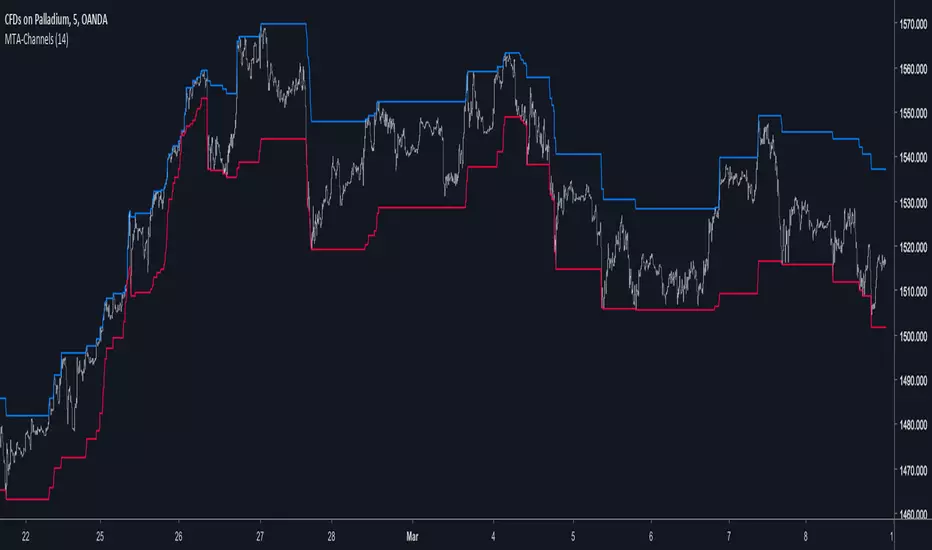
Motion To Attraction ChannelsIntroduction
Channels are used a lot on technical-analysis, however most of the them rely on adding/subtracting a volatility indicator to a central tendency indicator, sometimes the central tendency indicator can even be replaced by pure price. A great channel who does not rely on this kind of architecture is the Donchian channels or the quartiles bands. Here i propose a channel similar to the one made by Richard Donchian with some additional abilities.
The Channels
In my indicator, Motion To Attraction mean that the movement of an object a attract an object b , but we can resume this approach by saying that the longer a trend period is, the smaller the distance between each channels, for example if the price create a new highest then the lowest will move toward this new highest, each time coming closer. The philosophy behind this is that the longer a trend is the more probable it is that she will end.
The code reflect it this way :
here the parameter controlling the channel A (upper)
c = change(b) ? nz(c ) + alpha : change(a) ? 0 : nz(c )
this is traduced by : if channel b move then the parameter c become greater, if channel a move then reset the parameter , the parameter d do the same.
c is used to move the channel A, when c < 1 A is closer to the highest, when c = 1 A is in a central tendency point, when c > 1 A is closer to the lowest.
Slaving the Movement
It is possible to have a better control over the channels, this is done by making c and d always equal or lower than 1. Of course it could be another max value selected by the user.
In order to do that add c1 and d1 as parameter with c1 = c > 1 ? 1 : c , same with d1 but replace c by d.
Its safer to do this but i prefer how the channels act the other way, i will consider implementing this option in the future.
Conclusion
This channel indicator does not rely on past data thanks to recursion. The alpha variable at the start can also be adaptive, this let you make the channels adaptive even if such idea can add non desired results. Low length values can create effects where the lower channel can be greater than the higher one, this can be fixed directly in the code or using the method highlighted in the Slaving the Movement part.
RSI ATR ChannelDraws a channel based on ATR (Average True Range) and RSI. Detects band touches and colors the background appropriately.

Trend Follower With Help of Donchian Channels - TFWHDCThis is a simple Day Trade indicator, but can be used for swing and long term trades.
It is based on Donchian Channels to detect trend and point out resistance or support breakouts using arrows.
The bars ared colored when a breakout occurs. When a resistance breakout occurs the current and the next bars are colored green (default) and when a support breakout occurs the current and the next bars are colored red (default). This way this indicator can show if its an uptrend or a downtrend.
I hope this indicator will be useful for many traders!
Thank you!

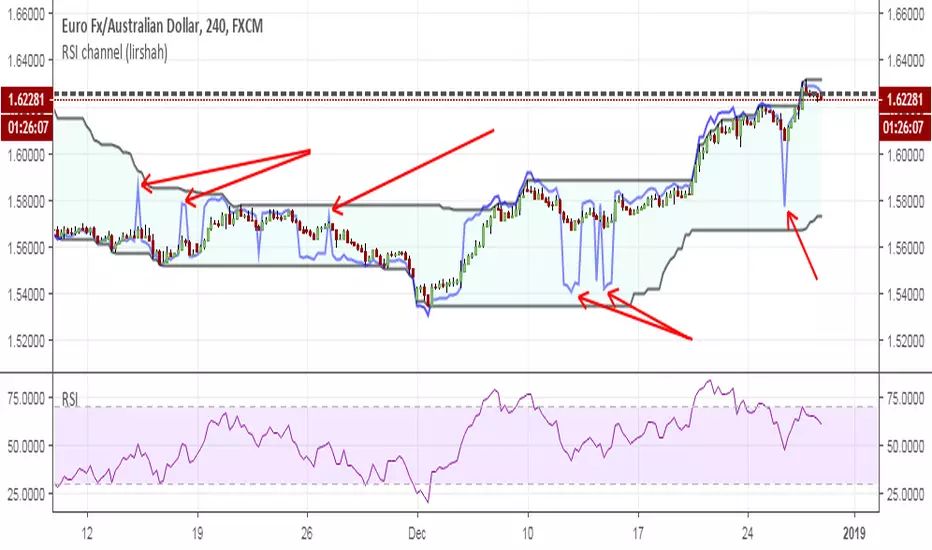
TMA channel (lirshah)The triangular moving average (also known as the TMA) is similar to other moving averages in that it shows the average price over a specified number of bars.
The purpose of the triangular moving average is to double smooth the price data, which will produce a line on your chart which doesn't react as quickly as an SMA would.
this channel has been plotted based on TMAs and can easily show trends and important key levels.

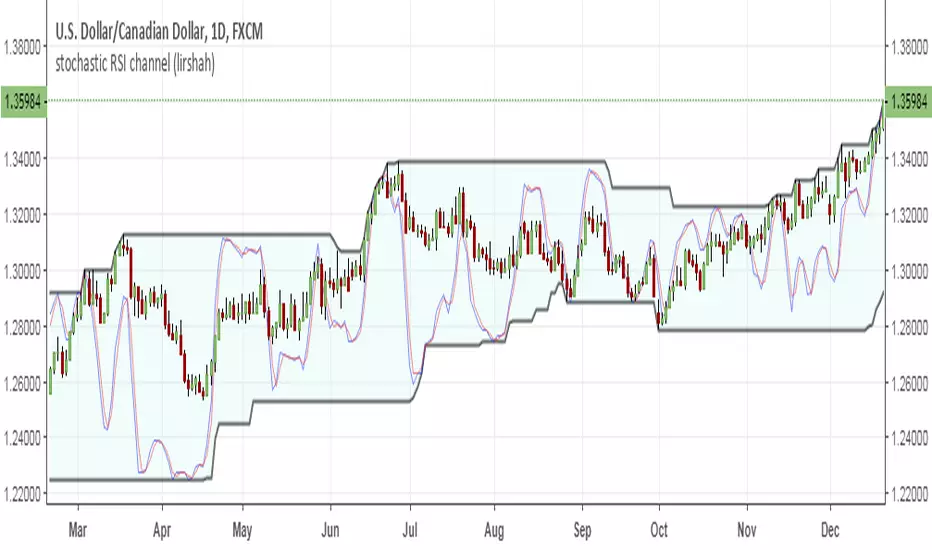
stochastic RSI channel (lirshah) this indicator plots stochastic RSI inside donchian channel.
0% stochastic rsi is coinciding with lower band while 100% stochastic rsi is matched on upper band
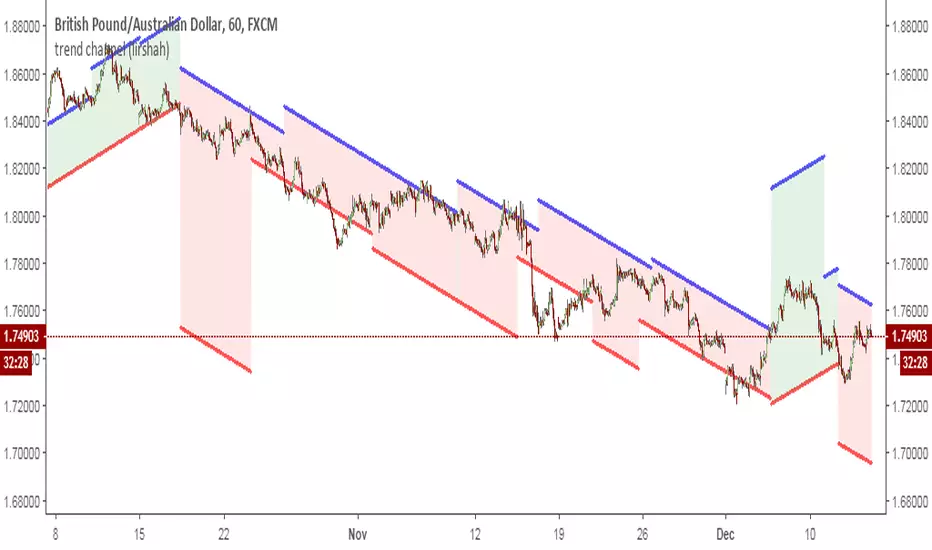
trend channel (lirshah)this indicator shows the trend lines and the channel which price fluctuate within, according to highest and lowest prices (historical data)
every line is calculated according to present bar and no repaint occurs.
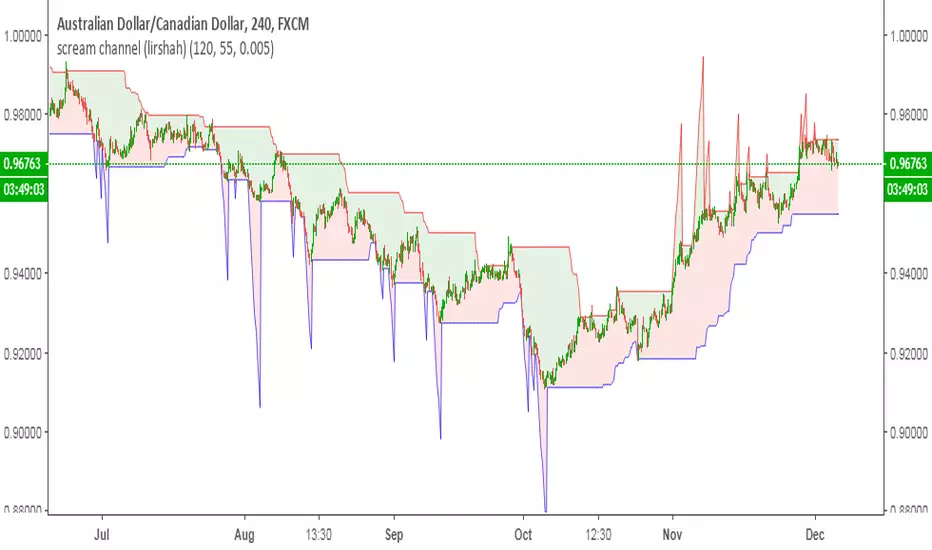
scream channel (lirshah)scream channel indicator is an indicators, which shows extreme price actions.
when the blades are downward, the trend is downward and the price tend to falling, and also for upward blades.
scream channel is compatible with all markets and time-frames.
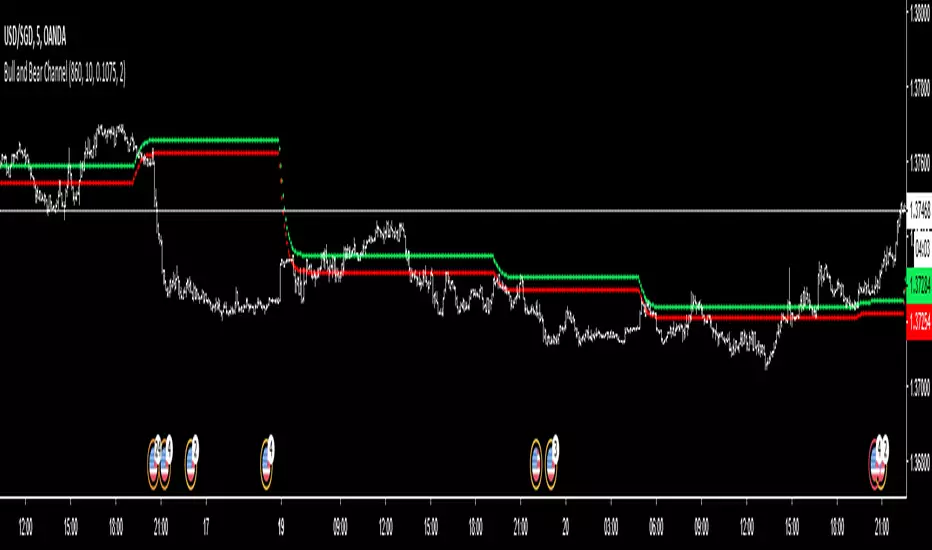
Bull and Bear ChannelGreen means buy and red means sell. Adjust according to your fits. Have to lock the code just in case someone will commercialise this.
AutoEnvelopeA channel that contains approximately 95% of all price data for the past 100 bars, about five months on a daily chart. It automatically plots correct channels for any trading vehicle in any timeframe.
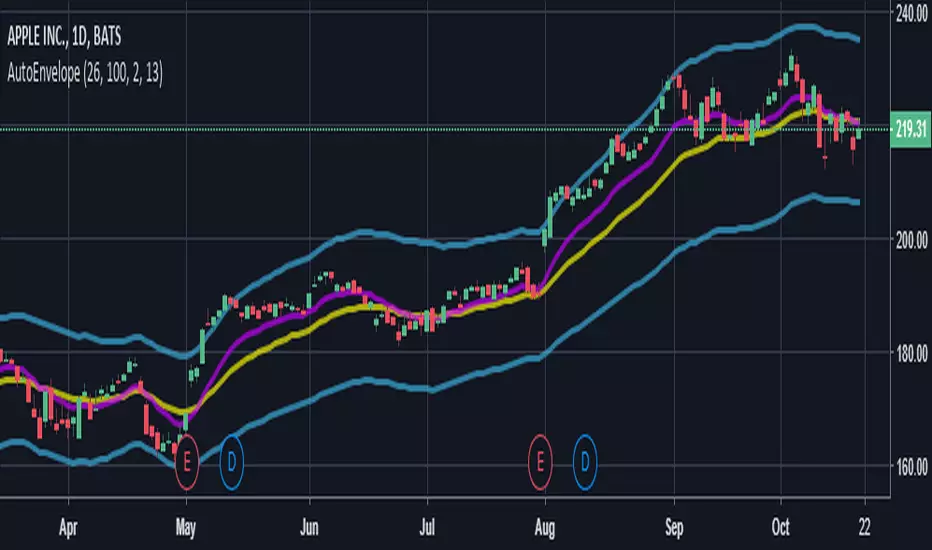
AutoEnvelopeA channel that contains approximately 95% of all price data for the past 100 bars, about five months on a daily chart. It automatically plots correct channels for any trading vehicle in any timeframe.
