Premarket Gapper Swing Filter (Long) – v6here’s a plug-and-play Pine Script v5 “screener” you can drop on any chart to flag pre-market gainers that also meet swing-friendly trend/liquidity filters. It works as a chart-level scanner (since Pine can’t screen the whole market by itself): add it to a watchlist; symbols that qualify will light up and you can set alerts to ping you right at the opening bell.
Services Pine

Event Marking [zidaniee]This is not a technical analysis indicator, but a visual tool designed to mark important global events using vertical lines on your chart.
By placing a single marker at the exact time an event occurred, you can compare how different assets reacted to that global event — before, during, and after it happened.
In the example provided, the marking corresponds to the moment when U.S. President Donald Trump announced a 100% tariff on goods from China, which was immediately reflected in market reactions worldwide.
The indicator includes full customization features for:
• Event label text
• Label size and position
• Line color, style, and width
Enjoy

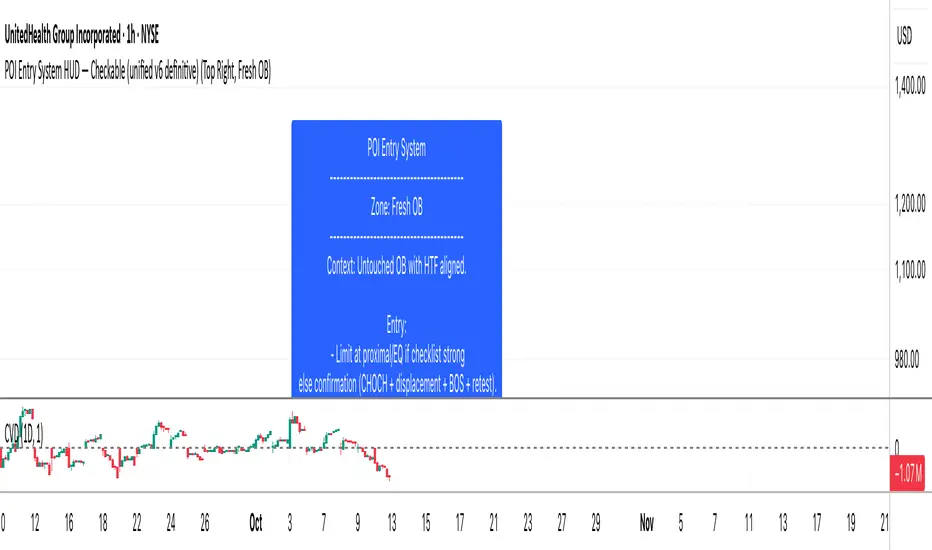
SMC POI Entry System HUDEntry, RR, Exit, of supply and demand zones taught in smart money trading. 12 types of zones and setups around Flips, Order Blocks, High Probability, and Extreme Demand Zones. Includes Checklist for Entry, Exit Rules, Take Profit Targets, Stop Loss spots, and Context

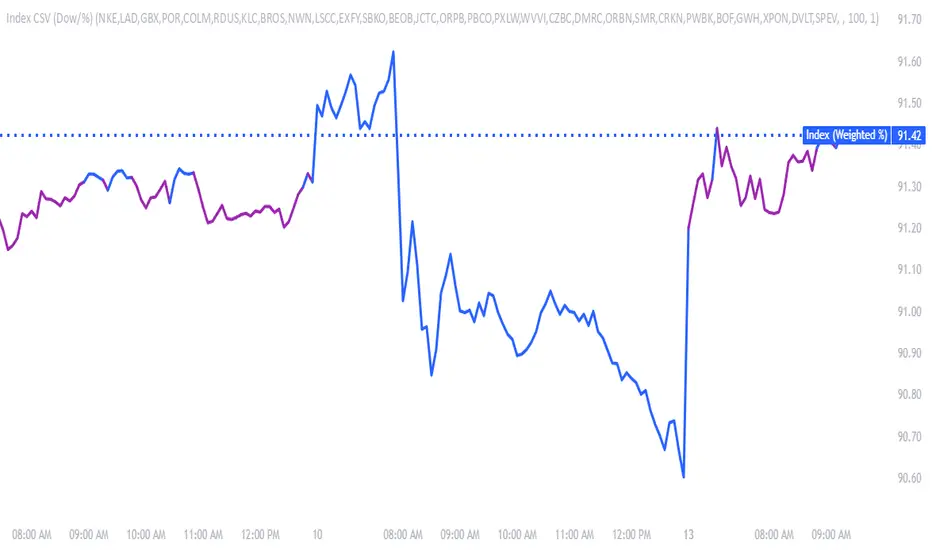
Make & Track An Index — Custom Weighted (by Quinn Millegan)Fixed pinescript security call issue limiting to 40 calls
Test for firing alerts on candle openThis fires an alert on every candle open. Nice to use if you need to test the performance of TradingView Alerts.
CyberTradingV1.4 TRexCyberTradingV1.3 — Multi-TF Volatility/Structure + FVG Suite (by College Pips)
TL;DR
One utility to read volatility regime (ATR vs TH), map market structure & swings, and track FVG/CE imbalances—so you can gauge range, context and entries in one place. No signals or promises; it’s a contextual toolkit.
What it does
Volatility table (multi-TF): Shows ATR-style and TH proxies across 1m → Monthly, so you can compare current TF vs higher TFs.
Composite levels: LQC / GAM / Trigger / TRex quantify “how much is enough” for legs/impulses relative to the active TF.
Structure & swings: Validated swing highs/lows with optional time-anchored rectangles (height sized by LQC) and auto structure/diagonal lines.
Imbalances (FVG): Auto-detect UP/DOWN FVGs, extend forward, optional CE line; alerts fire on touches/entries/fills.
Candle sizing: Directional color map by fixed ATR-ratio buckets; Inside Bars are force-colored for clarity.
How components work together (mashup rationale)
Read regime with the table (ATR vs TH per TF).
Map structure with swings/lines to see HH/HL/LH/LL context.
Focus imbalances with FVG + optional CE; monitor with alerts.
Act with thresholds using LQC/GAM/Trigger/TRex to standardize expectations across symbols/TFs.
Method transparency
ATR/TH math: ATR is a smoothed multi-window blend; TH scales the daily range to TF via √time.
Composites: LQC ≈ √(ATR×TH) × C(TF); GAM2/3/4 and Trigger/TRex apply TF-specific scalars to min/max aggregates (see source for exact coefficients).
Multi-TF: Values come from request.security and finalize on higher-TF bar close (no look-ahead).
Swings: Confirmed using left/right strengths; labels are offset back to the pivot bar.
FVG/CE: Classic 3-bar definition; CE is the midpoint line. Boxes extend until touched/filled; optional auto-delete on fill.
Usage
Enable the table to gauge expansion/contraction.
Turn on swing rectangles for LQC-sized reaction zones.
Toggle FVG + CE on your execution TF; use alerts to catch re-entries/resolutions.
Combine with price action and your own trade plan.
Limitations & fair warnings (be honest)
Offsets/past plotting: Swing labels and rectangles are anchored to past bars (offset = -right_strength). They do not predict future bars.
Repainting notes: Swings confirm after right_strength bars; higher-TF values finalize on their close. Past markings can update as confirmations occur.
Tick handling: Uses syminfo.mintick (special cases for JPY/XAU/XAG). Validate on exotic symbols.
No promises: This is a context tool, not a buy/sell signal generator.
Alerts included
ABOVE/BELOW threshold: Price crossing CE or FVG bounds.
IOFED up/down: Price entering an FVG from above/below.
Inputs (high-level)
Layout/positioning, color palettes, swing rectangle styling (width/fill/border), detection strengths, label/line widths, FVG lookback, CE on/off & style, auto-delete filled boxes.
Credits & reuse
Concepts like FVG/CE are widely known in market-microstructure education.
This implementation—table architecture, LQC/GAM/Trigger framework, swing rectangles, candle bucketing, and alert logic—is original to College Pips / CyberTradingV1.4

Knock-Out Warrant CalculatorKnock-Out Warrant Calculator
The Knock-Out Warrant Calculator enables live calculation and visualization of knock-out products, turbos, and mini futures (german market specific) directly on the chart – including leverage, profit, loss, and total position value.
How It Works
The script uses a two-point calibration method to calculate the current warrant price in real time:
– You enter two known Bid prices of the product at different underlying levels .
– From this data, the script calculates the product’s delta sensitivity .
– Based on the selected strike / knock-out level and the current underlying price, it determines the current Bid and Ask price of the warrant.
Main Features
– Live price calculation of the warrant based on the underlying’s movement
– Automatic leverage calculation (underlying price / warrant price)
– Investment and profit display in EUR with real-time updates
– Color-coded P/L display – green for profit, red for loss
– Total value display (investment + current profit) for quick overview
– Compact info panel with customizable color, transparency, and font size
– Optional KO line and price scale for visual orientation in the chart
Customization Options
– Freely adjustable panel position (top/bottom, left/right)
– Individual background and text colors
– Adjustable font size for all panel elements
– Customizable number and spacing of displayed price levels
Usage Steps
– Enter the strike (KO level) and select the product type ( Call or Put ).
– Enter two reference points (underlying + Bid price).
– Adjust spread, panel design, and scale settings.
– Set investment and entry price to calculate live profit/loss.
Purpose
This script is designed for active traders and investors who trade knock-out or turbo products and want to:
– Track the price development of their product directly on the chart
– Understand the leverage effect more precisely
– Monitor profits and losses directly in TradingView – without external tools or spreadsheets
⚠️ Disclaimer ⚠️
This script is intended for informational and demonstration purposes only .
It does not constitute financial advice, or a buy or sell recommendation .
Displayed calculations are based on model values and may deviate from actual market prices.
The author assumes no liability for losses resulting from the use or misinterpretation of this script.
Issuers may use different pricing models that can lead to deviations from the calculated values. Extensive testing and fine-tuning of parameters are recommended to achieve the best possible approximation of the real warrant price.
Trading leveraged products involves significant risk and may result in the total loss of invested capital .

Premarket & Extended Hours High/LowSnippet to display extended hours (ETH) and premarket graph displays. Once activated, you will see next to the UTC time display at the lower right corner of the graph window a dropdown option of RTH. Click on it and you'll see ETH. RTH: Regular Trading Hours -- ETH: Extended Trading Hours.
Multiverse ORBJust a simple ORB method to help you to decide. Built for Malaysian & US market. Simple tips, when you see the orb, get ready to TEKAN

Risk-Reward Position SizerRisk-Reward Position Sizer – Features Checklist
Purpose:
A visual calculator and position sizing tool for day traders, providing realistic risk, stop-loss, take-profit, and reward-to-risk information based on account size and position constraints.
Features:
Flexible Risk Settings
Set risk as a percentage of your account or a fixed dollar amount per trade.
Automatically calculates position size based on desired risk and stop distance.
Stop Loss Options
Stop distance can be defined as a percent of entry price or a fixed price.
Automatically adjusts stop distance when position is cash-limited to achieve your target risk.
Take Profit Options
TP can be defined as a fixed R multiple (e.g., 2R) or fixed absolute price.
Cash-Limited Position Handling
Optional “Cap Position to Account Size” prevents buying more shares than your cash allows.
Shows actual achievable risk if your cash limits position size.
Realistic Risk / Reward Calculations
Calculates Actual Risk $ based on position size and stop distance.
Calculates Projected Win $ based on take profit and position size.
Calculates Actual Reward-to-Risk (R:R) ratio using actual stop and TP.
Position Metrics
Estimated quantity of shares/contracts to buy.
Estimated position value.
Estimated leverage used relative to account size.
Top-Right Table Display
Clear, compact table showing:
Account size
Target risk $
Actual risk $
Stop distance
Quantity
Position value
Take profit and stop-loss prices
Projected win $ and %
Projected loss %
Actual R:R
Leverage
Trading Decision Aid
Gives traders a realistic snapshot of achievable risk and reward before entering a trade.
Helps avoid the common trap of setting tight stops that don’t actually match desired account risk.
Why It’s Useful:
This indicator turns abstract risk/reward concepts into concrete, actionable numbers, helping day traders size positions safely, plan stops and targets realistically, and maintain consistent risk management across trades.

Forex Session High/Low TrackerThis indicator maps out each Forex session along with their relative highs and lows.

Range Breakout with Volume ConfirmationRange Breakout along with Volume Build up. However, ADX needs to be checked manually

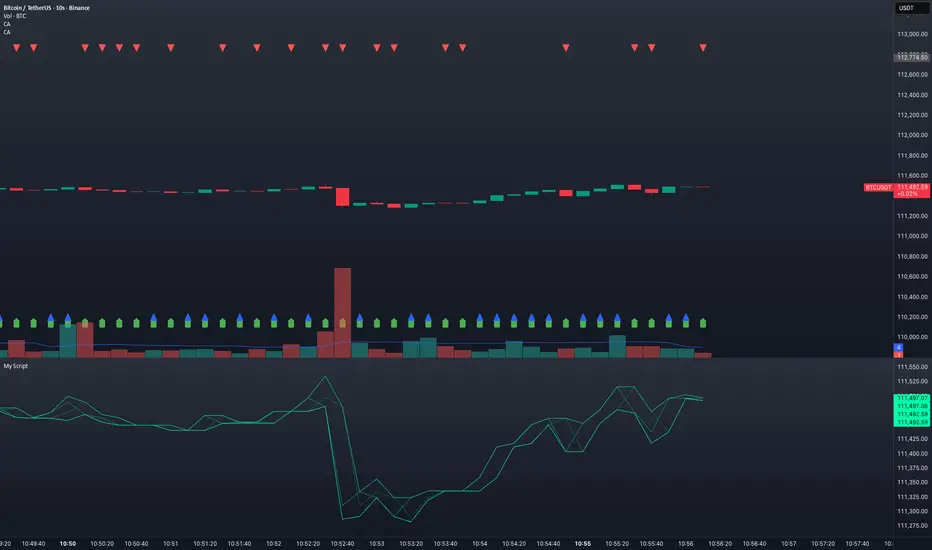
BTC Price Spread Heatmap (Coinbase vs Binance (chart symbol))Observation was made about price spread varying among exchanges. Original event took place Oct 4-5th. BIN/BTC was about 1K lower than COIN/BTC.
Implemented a visualization to capture specifically Binance and coinbase spread comparison. This may lend as a tool to help build a case if there is a correlation. At this time Binance holds 43.1% of the market share and coinbase a mear 5.5%...

LBR Oscillator with Signals & AlertsLinda Bradford Raschke MacD indicator. Has alerts and can be used in the pine screener on different timeframes.

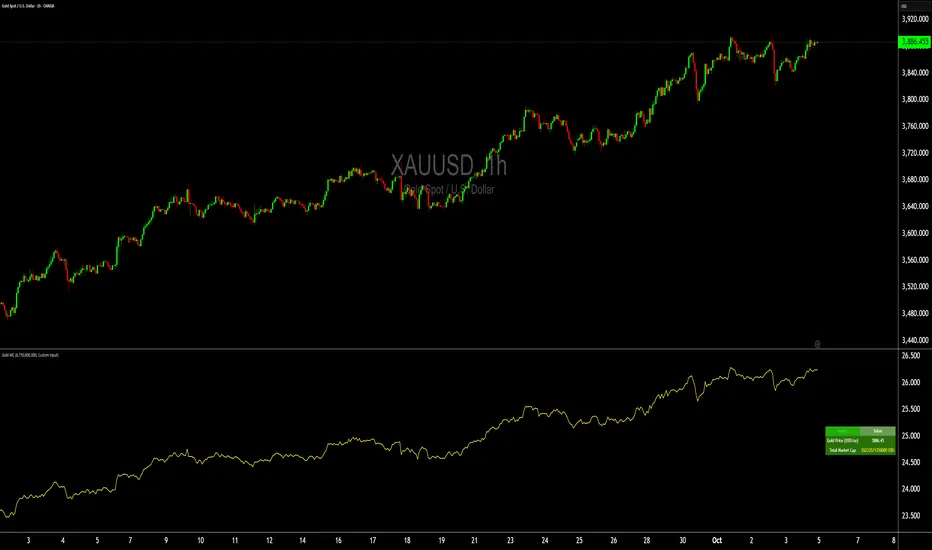
Gold Total Market Cap By Wave Trader Gold Total Market Cap (Updated 2025)
Overview
This indicator calculates and visualizes the total market capitalization of gold in real-time, based on the current XAUUSD spot price and the estimated above-ground gold supply. It transforms the raw gold price into a scaled "market cap" view (in trillions USD), helping traders contextualize gold's global value—often compared to stocks, crypto, or fiat reserves. As of October 2025, gold's cap hovers around $26–27T, underscoring its status as a premier safe-haven asset.
How It Works
Core Formula: Market Cap = Gold Price (USD/oz) × Total Supply (troy oz), scaled to trillions for chart readability.
Supply Data: Defaults to the World Gold Council (WGC) mid-2025 estimate of ~218,000 metric tonnes (~7.01B troy oz), but customizable for scenarios like historical or projected figures.
Plotted as a smooth yellow line below the price pane, mirroring gold's price movements but in cap terms.
Key Features
Dynamic Label: A real-time label on the yellow line displays the exact market cap (e.g., "26.8") for instant reference, styled like popular TradingView cap indicators.
Reference Line: Horizontal dashed line at 25T USD to highlight key thresholds (e.g., surpassing Bitcoin's cap).
Info Table: Top-right panel shows current gold price and full market cap (e.g., "26.8T USD") for quick stats.
Overlay-Free: Designed for a separate pane to avoid cluttering your main XAUUSD chart.
Data Sources & Customization
Relies on live XAUUSD close prices from TradingView.
Supply input: Switch between "WGC Mid-2025" (default) or custom values—ideal for sensitivity analysis (e.g., adding future mining output).
No external API calls; fully self-contained for fast performance.
Usage Tips
For Gold Traders: Spot divergences between price momentum and cap growth to gauge overbought/oversold conditions.
Portfolio Context: Compare to S&P 500 cap (~$50T) or BTC (~$2T) by adding multi-symbol alerts.
Timeframes: Best on daily/weekly for long-term trends; works on 1H+ for intraday macro views.
Alerts: Set notifications for cap milestones (e.g., "Gold Cap > 28T") via TradingView's alert system.
Track gold's "infinite market cap" evolution—because unlike stocks, gold's supply grows slowly, amplifying price impact. Updated for 2025 data; feedback welcome! 🚀
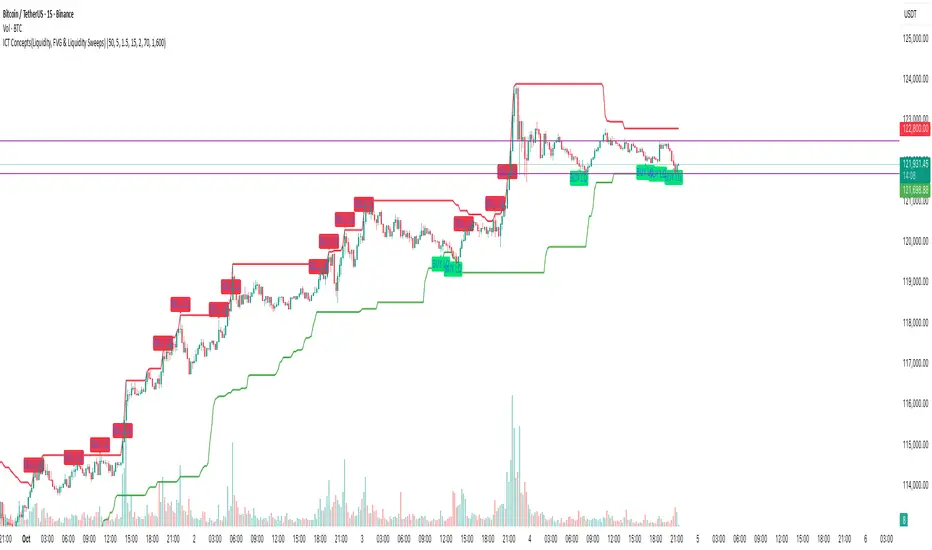
ICT Concepts(Liquidity, FVG & Liquidity Sweeps)📄 Description:
A Smart Money Concept (SMC)-based utility that blends ICT-style Liquidity Sweeps, Fair Value Gap (FVG) mapping, and Swing Structure proxies – designed for traders seeking clean precision in price imbalance analysis.
⸻
🔍 1. What This Script Does
T his indicator brings together three core Institutional Concepts:
• Liquidity Sweep Detection : Identifies buy/sell-side liquidity grabs (fakeouts) confirmed by volume spikes – a common precursor to institutional order flow shifts.
• Fair Value Gaps (FVGs) : Highlights inefficiencies between price legs using strict ICT-style 3-candle or gap-based rules. These are areas institutions often revisit.
• Swing Structure Proxy (OB Mapping) : Tracks dynamic swing highs/lows to act as proxy zones for potential order blocks and structural boundaries.
It also includes a cooldown-based signal filtering engine to prevent overfitting and noise, helping traders avoid false positives in choppy markets.
⚙️ 2. How It Works (Core Logic)
✅ A. Liquidity Sweep Engine
• Looks back N bars to find Equal Highs or Equal Lows.
• Triggers a signal only if price sweeps the level and closes on the other side with a volume spike.
• Customizable volume threshold (e.g., 1.5x average volume).
• Includes a signal cooldown period to reduce clutter and boost quality.
Bullish Sweep = Price dips below equal lows but closes higher
Bearish Sweep = Price spikes above equal highs but closes lower
Visuals: Signal arrows with alerts (BUY LQ / SELL LQ)
⸻
✅ B. Fair Value Gap (FVG) Zones
• Detects FVGs using:
• Sequential logic: Low > High (bullish), High < Low (bearish)
• Gap logic: Open gaps at bar open
• Dynamic box drawing:
• Automatically extends FVG zones until price fully closes through them.
• Different color coding for bullish (teal) and bearish (orange) gaps.
• Customizable:
• Opacity control
• Option to include/exclude gap-based FVGs
• Hide filled zones
• Limit total zones rendered (for performance)
⸻
✅ C. Swing High/Low Structure
• Uses a lookback period to find latest swing high/low levels.
• Acts as a proxy for Order Block zones or structural shift reference points.
• Plotted as red (high) and green (low) lines.
⸻
🚀 3. How to Use It
• Scalpers and Intraday Traders can use Liquidity Sweep + FVG Confluence to time reversals or catch early entries into trend continuation moves.
• Swing Traders can observe swing OB proxies and recent FVG zones to frame directional bias and target zones.
• Volume-Aware Traders benefit from the volume filter that confirms sweeps are meaningful – not just random stop hunts.
🔔 Set alerts on:
• Bullish Liquidity Sweeps
• Bearish Liquidity Sweeps
You can use this in combination with your own trend filters, or even confluence it with Order Blocks, VWAP, or EMA trend tools.
⸻
💡 What Makes It Original?
• The script doesn’t merely combine standard tools — it builds a cohesive ICT-style detection system using:
• A custom volume-confirmed liquidity sweep filter
• Dynamic FVG rendering with filled logic + performance optimization
• Visual hierarchy to avoid clutter: clean line plots, contextual boxes, and conditional signals
• Highly customizable yet lightweight, making it suitable for fast-paced decision making.
⸻
✅ Notes
• Invite-only script for serious traders interested in Smart Money and ICT concepts.
• Does not repaint signals.
• All visuals are dynamically managed for clarity and performance.
IDX Utility Set [zidaniee]Purpose
This indicator is not a technical analysis tool. It’s a companion overlay designed to guide your analysis of the uniquely structured Indonesia Stock Exchange (IDX).
Core Features
Centered Ticker Display – Clean, readable ticker shown at the center of the chart.
Company Name – Displays the listed company’s full name.
Active Timeframe – Shows the currently selected timeframe.
Additional Features
ATH & ATL Markers – Labels the All-Time High (ATH) and All-Time Low (ATL) and shows the percentage distance from the latest price to each level, so you can quickly gauge upside/downside room.
IDX Fraction (Tick) Levels – Visualizes Indonesia’s price-fraction (tick) brackets. This matters because tick size changes by price range—very useful for scalpers and fast traders.
ARA/ARB Levels (Realtime) – Plots Auto-Reject Upper (ARA) and Auto-Reject Lower (ARB) levels in real time. Levels refresh in line with IDX trading hours 09:00–16:00 WIB (UTC+7), so your view stays consistent both during and outside market hours. This feature already complies with the latest rules and adjustments set by the Indonesia Stock Exchange (IDX).
Suspension Status – Shows SUSPENDED if the stock is halted/suspended, helping you avoid unnecessary analysis. The suspension check compares today’s date with the last available candle date and accounts for weekends.
Note: WIB = Western Indonesia Time (UTC+7).

Kz GC1! ORBStrategy that trades breakouts on GC1! futures on the 5min timeframe. It also works on MGC1! for lower drawdown and to manage Apex and Top Step accounts with the lower risk.
Risk Disclaimer:
Past results as well as strategy tester reports do not indicate future performance. Guarantees do not exist in trading. By using this strategy you risk losing all your money.
Important:
It trades all days that markets are open. Set times may be seen on settings. Trades multiple times a day sometimes.
It works on the 5 and 15min timeframe only. Results are better on 5min timeframe.
The settings are optimized already for GC1! on the 5min timeframe.
How it works:
Every trading day it measures the range of the first 15min candle of pre-selected hours. As soon as price closes above or below on the 15min timeframe, it will trade the breakout targeting a set risk to reward ratio. SL on the opposite side of the range.
Settings:
Hourly Trading Hours: These are the times that worked best for this strategy. All boxes should be checked for best results. Excluded times were when it performed bad which is why those times have been left out.
ORB Formation Period: This setting determines on which timeframe candle has to close outside the opening range box in order to take a trade. It's set to 15min by default because this is what worked by far the best
Entry Type: Entries are immediate instead of waiting for a pull back to enter on a limit order.
Limit Orders: If enabled, the strategy will place a pending order x points from the current price, instead of a market order. Immediate orders are enabled by default for a better performance. Important: It doesn't actually place a limit order. The strategy will just wait for a pullback and then enter with a market order. It's more like a hidden limit order.
Limit Order Offset Points: If you have limit orders enabled, this setting determines how many points from the current price the limit order will be placed.
FVG Detection Type: How fast it detects the fair value gaps. Standard detection over immediate had better performance
Risk Type: You can chose either between Fixed USD Amount, Risk per Trade in % or Fixed Contract Size. By default it's set to fixed contract size.
Risk Amount (USD or Contracts): This setting is to set how many USD or how many contracts you want to risk per trade. Make sure to check which risk type you have selected before you choose the risk amount.
Take Profit Multiplier: This is simply the total SL size in points multiplied by x.
Example: If you put 2, you get a 2:1 Risk to Reward Ratio. By Default it's set to 2.5 because this gave the best results in backtests.
Stop Loss Padding: This is simply the buffer in points that is added to the SL for safety reasons. If you have it on 0, the SL will be at the exact price of the opposite side of the range. By default it's set to 5 because this is what delivered the best results in backtests.
Stop Loss Placement: This determines where the stop loss gets placed for the order. It has been set to ORB Range by default as this delivered the best results.
Max Trades Per Hour: This allows the user to decide how many trades are taken an hour. 1 is been set to default for best results
Visual Settings: Check boxes to show orb range, FVG's, Entry points, and trade visualization boxes.
Backtest Settings:
For the backtest the commissions were set to 1.29USD per contract and .35USD for micros which is the highest amount Tradovate charges Margin was not accounted for because typically on prop accounts you can use way more contracts than you need for the extremely low max drawdown. Margin would be important on personal accounts but even there typically it's not an issue at all especially because this strategy runs on the 15min timeframe so it won't use a lot of contracts anyways.
Why the source code is hidden:
The source code is hidden because I invested a lot of time and money into developing this strategy and optimizing it with paid 3rd party software.

Current Price (Customizable) by DRtradeCurrent Price Line & Dynamic Label (Fully Customizable)
The ultimate tool for clear, real-time price visualization.
This powerful, lightweight indicator draws a clean horizontal line at the current market price, updating instantly with every price tick. Unlike other current price line scripts, this tool ensures you always see where the price is right now and provides full control over every visual element.
Key Features:
- Real-Time Tracking: The line moves dynamically with price ticks within the current candle, eliminating lag and providing true current market price awareness.
- Line Extension Control: Choose to extend: Left, Right, or Both. Helpful for scalpers and options traders
- Visual Customizations: Color, Style, Size, Width, etc.
- Label Positioning: Left of Candle, Above Candle, or Right of Candle
All customization options are available in the indicator's settings menu.
Ping me with feature reqeusts.
