Seasonal pivot datesPlots approximate equinox and solstice dates, which are often zones around which market pivots occur.
Pivot

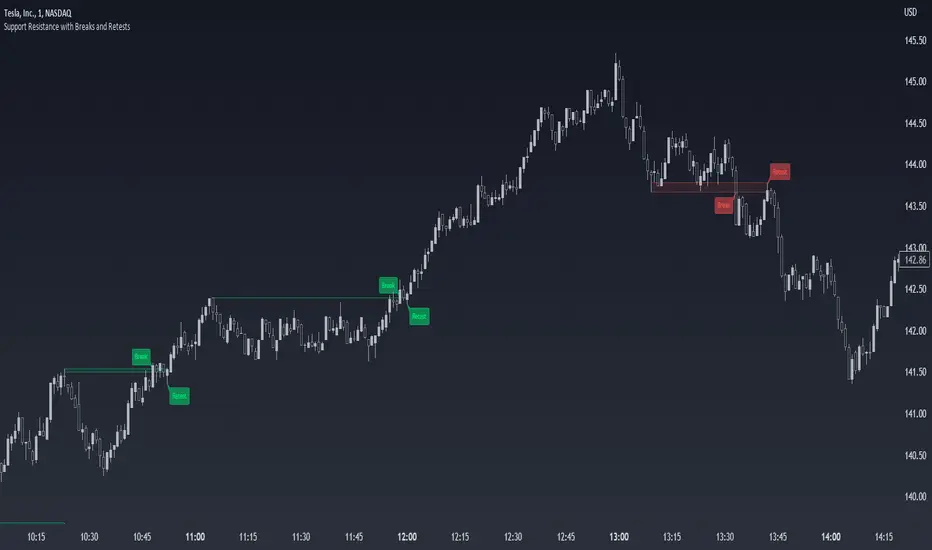
Support Resistance with Breaks and RetestsThe Break and Retest indicator strives to provide a visual aid for spotting areas of continuation and pullbacks. Support and resistance levels are drawn out automatically and have sequential conditions in place to determine a breakout following an eventual retest. Additionally, there are methods in place that try and detect liquidation events and still output a retest.
Although there are options to adjust repaint settings, "potential labels" are structured in a way to detect live ongoing retest events and therefore will be the only thing in the script that will be forced to repaint.
🔳 Settings
Lookback Range: Lookback period to trigger a new support/resistance level when pivot conditions are met.
Bars Since Breakout: How many bars since breakout in order to detect a retest.
Retest Detection Limiter: Whenever a potential retest is detected, the indicator knows that a retest is about to happen. In that given situation, this input grants the ability to raise the limit on how many bars are allowed to be actively checked while a potential retest event is active. For example, if you see the potential retest label, how many bars do you want that potential retest label to be active for to eventually confirm a retest?
🔳 Repaint Options
By default, the break and retest system uses the current close value to determine a condition. (Repaints by default)
On: Allows repainting
Off - Bar Confirmation: Prevents repainting and generates alerts when the bar closes. (1 candle later)
Off - High & Low: Prevents repainting, but in return utilizes both the high and low values instead of the close which may yield a higher outcome and inaccurate results.
🔳 How it works
In the background, calculations aren't searching for the perfect retest within the zone but instead focuses its attention towards price fluctuation around the zones. This allows the indicator to yield more results than it would otherwise.
The chart below provides an example of how potential retests are established. These are updated constantly until a retest is confirmed, and deleted if not. If a potential retest is active and the next candle drops below the value when the potential retest was detected, a retest is placed..
🔳 Alerts
PSAR-Support ResistanceParabolic Support Resistance -PSAR SR is based on the Dynamic Reversal Points of Price. This indicator eliminates the false signals of regular Parabolic SAR (Stop and Reverse). The Price of previous SAR Reversal point is plotted as Support and Resistance. The idea is to trade only after the previous reversal point is crossed and a new candle formation above / below the support resistance lines.
Price moves sideways in between the S/R Lines mostly.
Buy and Sell Signals are based on normal P-SAR settings however this S/R must be considered. Please be aware that the indicator cannot be used as a stand alone. Please make required confirmations before going into action.
Disclaimer: Please use it at your own Risk.

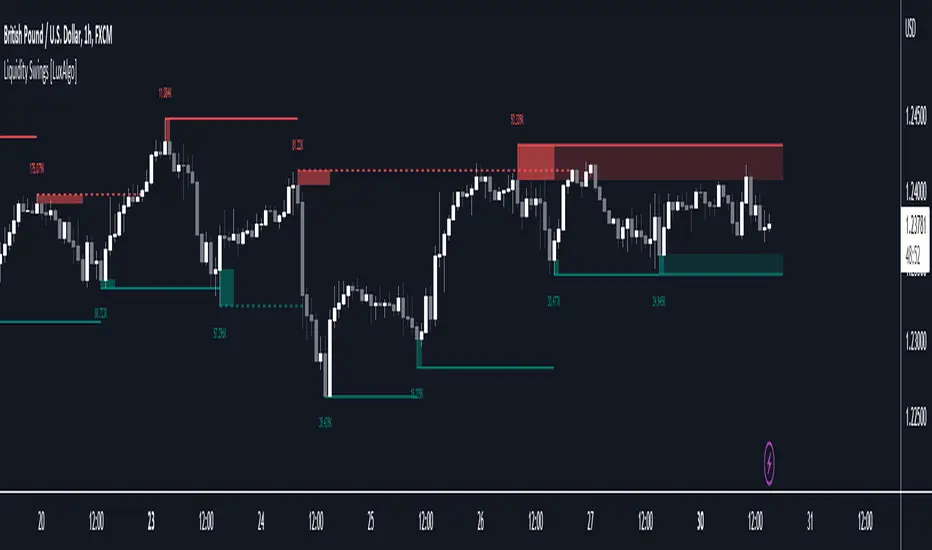
Liquidity Swings [LuxAlgo]The liquidity swings indicator highlights swing areas with existent trading activity. The number of times price revisited a swing area is highlighted by a zone delimiting the swing areas. Additionally, the accumulated volume within swing areas is highlighted by labels on the chart. An option to filter out swing areas with volume/counts not reaching a user-set threshold is also included.
This indicator by its very nature is not real-time and is meant for descriptive analysis alongside other components of the script. This is normal behavior for scripts detecting pivots as a part of a system and it is important you are aware the pivot labels are not designed to be traded in real-time themselves.
🔶 USAGE
The indicator can be used to highlight significant swing areas, these can be accumulation/distribution zones on lower timeframes and might play a role as future support or resistance.
Swing levels are also highlighted, when a swing level is broken it is displayed as a dashed line. A broken swing high is a bullish indication, while a broken swing low is a bearish indication.
Filtering swing areas by volume allows to only show significant swing areas with an higher degree of liquidity. These swing areas can be wider, highlighting higher volatility, or might have been visited by the price more frequently.
🔶 SETTINGS
Pivot Lookback : Lookback period used for the calculation of pivot points.
Swing Area : Determine how the swing area is calculated, "Wick Extremity" will use the range from price high to the maximum between price close/open in case of a swing high, and the range from price low to the minimum between price close/open in case of a swing low. "Full Range" will use the full candle range as swing area.
Intrabar Precision : Use intrabar data to calculate the accumulated volume within a swing area, this allows obtaining more precise results.
Filter Areas By : Determine how swing areas are filtered out, "Count" will filter out swing areas where price visited the area a number of time inferior to the user set threshold. "Volume" will filter out swing areas where the accumulated volume within the area is inferior to the user set threshold.
🔹 Style
Swing High : Show swing highs.
Swing Low : Show swing lows.
Label Size : Size of the labels on the chart.
Note that swing points are confirmed after Pivot Lookback bars, as such all elements are displayed retrospectively.
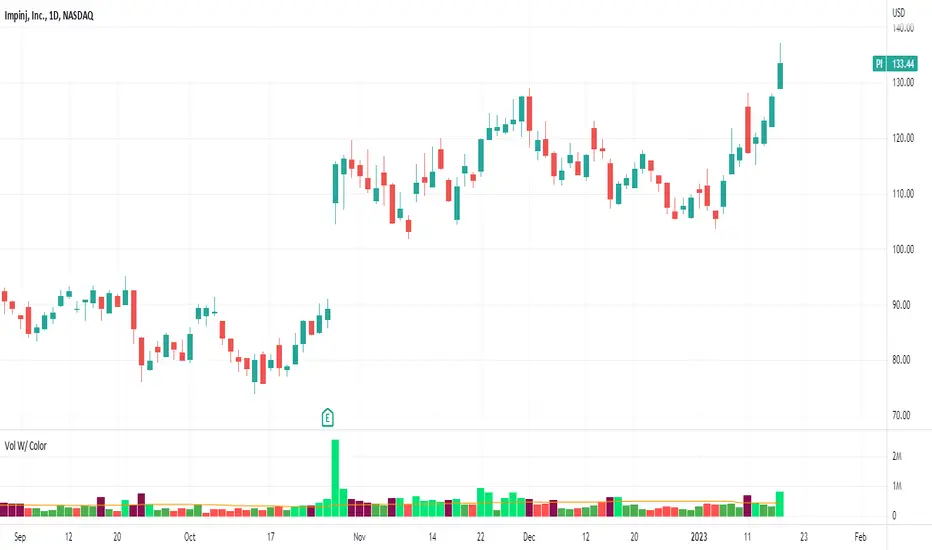
Volume With ColorVolume with color helps to quickly identify accumulation or distribution.
An accumulation day is an up day with volume greater than a user selected average.
A distribution day is a down day with volume greater than a user selected average.
This indicator will highlight those days by changing the volume bar colors for an easy visual.
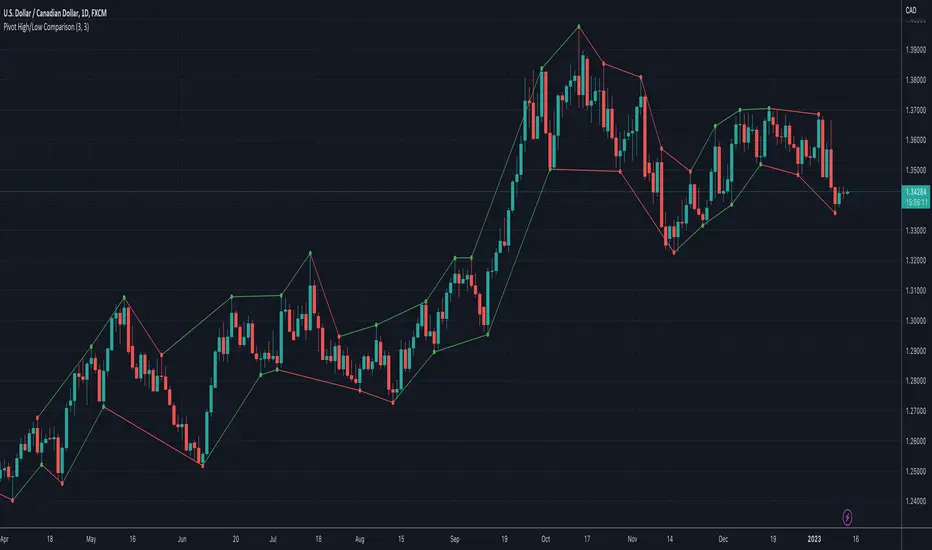
Pivot High/Low ComparisonThis script will show you at a glance the following trends:
Higher Highs (Green line on top)
Lower Highs (Red line on top)
Higher Lows (Green line on bottom)
Lower Lows (Red line on bottom)
It utilizes the Pivot High and Pivot Low functions to determine if the previous pivot was higher or lower than the current pivot .
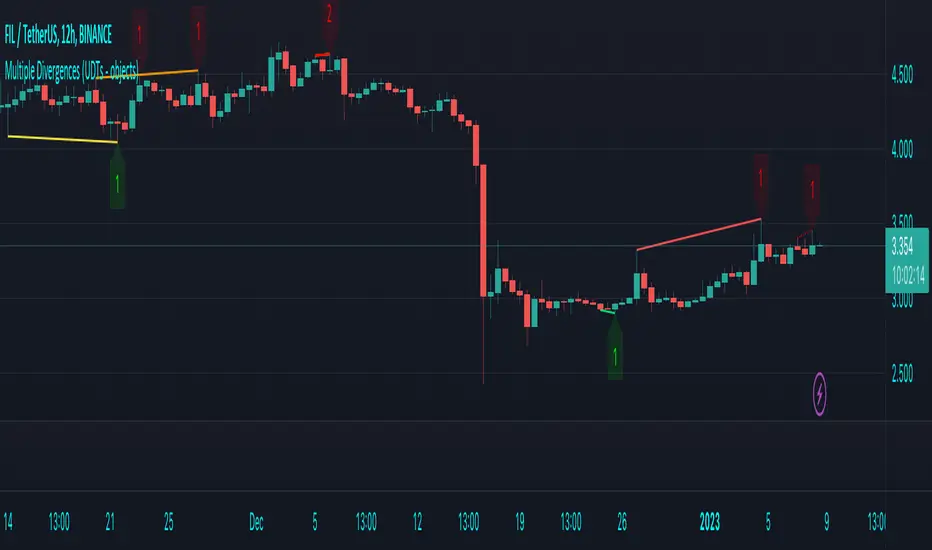
Multiple Divergences (UDTs - objects) - Educational█ OVERVIEW
This script highlights the usage of User-defined Types (UDTs) and objects , and bullish /bearish divergences.
Pivotpoints are used to find divergences, the result of this script will be different against other public multiple divergences scripts.
FOR Pine Script™ CODERS
Besides the information found in CONCEPTS , the comments in the script will, hopefully ), guide you through my thought process.
█ CONCEPTS
The main principle of this script are bullish /bearish divergences, this with 3 different oscillators ( RSI , CCI , MFI )
If you want to know more about divergences, have a look at some Education and Research idea's .
On every bar, an object HLs is made, containing bar_index , high , low , and 2 bool variables ( isPh , isPl ).
On every bar, an object Osc is made, containing bar_index , o (oscillator value), and 2 bool variables ( isPh , isPl ).
If a pivothigh (ph ) is found, isPh will be true on that bar, false otherwise.
If a pivotlow (pl) is found, isPl will be true on that bar, false otherwise.
These objects are added to an array, with limited size.
If a ph is found, the script draws a testline from that ph to every previous ph , found in the array.
Then every high in between these 2 points are checked if they don't pierce the testline .
If the testline isn't broken, the Reg_Div_Piv() function will give 4 values, 1 check (not pierced) variable and the 4 points of the line.
The testline is deleted.
Once a positive check is found, the script will perform the same, but now with the Osc objects.
The script will ONLY compare Osc pivots which are maximum 1 bar away from the high/low pivot .
If everything is confirmed, a line is drawn, visible on the chart.
█ REMARKS
A label will be visible with a number, this is the amount of divergences found with the according oscillator .
EXAMPLE
Div with RSI and CCI -> 2
Div with MFI alone -> 1
Div with RSI and CCI and MFI -> 3
...
Divergences should only be used when confirmed, this is after bar close .
As an aid, lines that are not confirmed will be dotted , if confirmed, they will be solid .
The divergence check start when a ph/pl is found, after which oscillator pivot are checked.
Optionally the same can be done, when a oscillator pivot is found and then check the ph/pl ,
this should give more results, although it can make the script slower.
█ SETTINGS
Left - amount of bars at the left which needs to be lower/higher
Right - amount of bars at the right which needs to be lower/higher
Max values - maximum values in array of objects
3 oscillator settings with
• ON/OFF
• Length
• color bullish divergence
• color bearish divergence
Have FUN !
3 indicators in another time frame "3 indicators in another time frame"
1- In the indicator settings section, you can save and change another time period
2-For time frame changes, it should be calculated in minutes
3-Includes three performance indicators ( ichimoku , bollinger bans, pivot ) that are set to a 15-minute timeframe by default.

CAT Month Opening RangeA trading range which is formed during the first three trading day of any month sets an important "Month Opening Range".
The lowest price made during the first three trading days can be considered the Monthly Support level (see the green line drawn by the indicator).
The highest price made during the first three trading days can be considered the Monthly Resistance level (see the red line drawn by the indicator).
In an Up trending market price tends to break over the upper edge of the Month Opening Range and keep moving higher at the very least until the middle of that month.
In an Up trending market once price broke out of the Month Opening Range, the Monthly Resistance level tends to work as a support.
In a Down trending market price tends to break under the lower edge of the Month Opening Range and keep moving higher at the very least until the middle of that month.
In a Down trending market once price broke under the Month Opening Range, the Monthly Support level tends to work as a resistance
There are may ways to use that instrument:
(1) Trend Confirmation.
The first three days of a month tends to bring volatile trading. The market sets boundaries for the following four trading weeks.
Once the range has been set, swing traders may wait for the market to break out of the range and consider that direction of the prevailing trend direction.
(2) Short "Failed Breakout" setup
Quite often price breaks out of the Month Opening Range on the fourth or fifth trading day of a month but then drops back into the range.
That failed breakout quite often is followed by decline back down to the Month Support level (the lower edge of the Month Opening Range).
(3) Long "Failed Breakdown" setup
Quite often price breaks down under the Month Support on the fourth or fifth trading day of a month but then pops back up over the Monthly Support.
That failed breakdown quite often is followed by a rally targeting to retest the Monthly Resistance (the red line).
The indicator generates signals, trade set-ups and alerts that are for educational and hypothetical purposes only and shall not be considered trade recommendations.
Any signals or trading setups drawn by the indicator is not to be construed as an offer to sell or the solicitation of an offer to buy, nor is it to be construed as a recommendation to buy, hold or sell (short or otherwise) any security. All users of the indicator must determine for themselves what specific investments to make or not make and are urged to consult with their own independent financial advisors with respect to any investment decision.

Wavetrend in Dynamic Zones with Kumo Implied VolatilityI was asked to do one of those, so here we go...
As always free and open source as it should be. Do not pay for such indicators!
A WaveTrend Indicator or also widely known as "Market Cipher" is an Indicator that is based on Moving Averages, therefore its an "lagging indicator". Lagging indicators are best used in combination with leading indicators. In this script the "leading indicator" component are Daily, Weekly or Monthly Pivots . These Pivots can be used as dynamic Support and Resistance , Stoploss, Take Profit etc.
This indicator combination is best used in larger timeframes. For lower timeframes you might need to change settings to your liking.
The general Wavetrend settings are the same that are used in Market Cipher, Market Liberator and such popular indicators.
What are these circles?
-These are the WaveTrend Divergences. Red for Regular-Bearish. Orange for Hidden-Bearish. Green for Regular-Bullish. Aqua for Hidden-Bullish.
What are these white, orange and aqua triangles?
-These are the WaveTrend Pivots. A Pivot counter was added. Every time a pivot is lower than the previous one, an orange triangle is printed, every time a pivot is higher than the previous one an aqua triangle is printed. That mimics a very common way Wavetrend is being used for trading when using those other paid Wavetrend indicators.
What are these Orange and Aqua Zones?
-These are Dynamic Zones based on the indicator itself, they offer more information than static zones. Of course static lines are also included and can be adjusted.
What are the lines between the waves?
-This is a Kumo Cloud Implied Volatility indicator. It is color coded and can be used to indicate if a major market move/bottom/top happened.
What are those numbers on the right?
-The first number is a Bollinger Band indicator that shows if said Bollinger Band is in a state of Oversold/Overbought, the second number is the actual Bollinger Band Width that indicates if the Bollinger Band squeezes, normally that happens right before the market makes an explosive move.
Please keep in mind that this indicator is a tool and not a strategy, do not blindly trade signals, do your own research first! Use this indicator in conjunction with other indicators to get multiple confirmations.

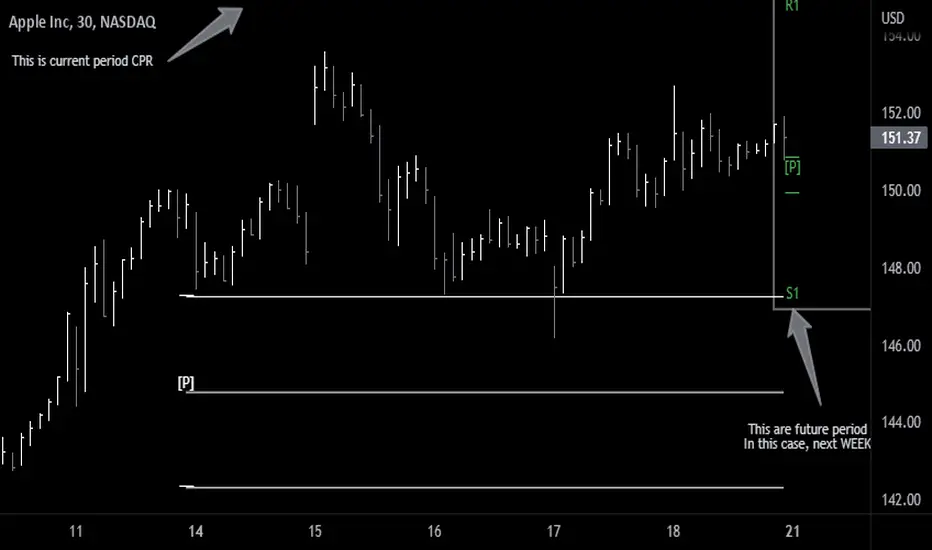
Future Pivots CPR - All Timeframes
Simple idea that allows you to display tomorrow CPR/ Standard Floor Trader Pivots based on the high, low and close of today session. Likewise, it works for higher timeframes taking into account the high, low, close of the period (e.g. weekly, monthly, year).
Just be aware that -regardless of the timeframe- if the period is still in development, the indicator will constantly/ live update the values until the period is closed!! This indicator is meant to be used when preparing for the next trading period. If you want to use it live, I'd suggest using the function of this indicator which allows to display only current/closed pivots-
Similar to other script I published, this indicator lower timeframes (Daily and Weekly) will work with lower timeframe bars, this is the Minutes and Hour bars. Conversely, higher timeframe CPR/Pivots will work better with timeframes/charts from Daily and above.
Available tick/untick functions:
- Select timeframe
- Show current CPR & Support/Resistance
- Show tomorrow CPR & Support/Resistance
- Display historical CPR (CPR only)
- Show extended support and resistance lines (S2,S3,R2,R3) for current and future pivots.
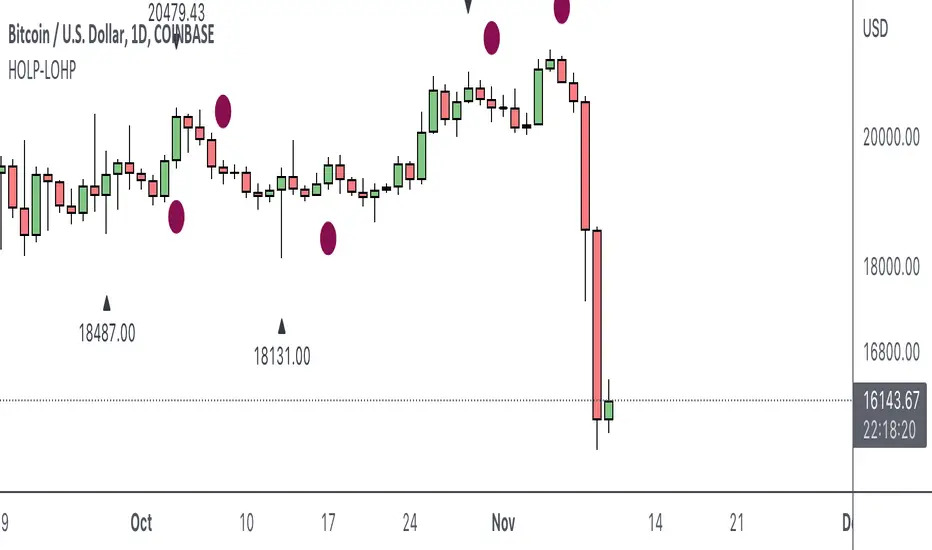
HOLP LOHP PivotCOINBASE:BTCUSD
HOLP and LOHP based on John Carter's Mastering the Trade.
HOLP stands for High Of the Low Period
LOHP stands for Low Of the High Period
This indicator is based on John Carter’s HOLP and LOHP from Mastering the Trade. The basic idea is to identify the session high and mark the low of the session high for a short entry, and vice versa for a long entry.
The default look back period is set to 10 here, albeit John Carter didn’t specify a hard coded number but rather the use of experience and common sense.
Option to turn on labels of the highs and lows of the pivots.
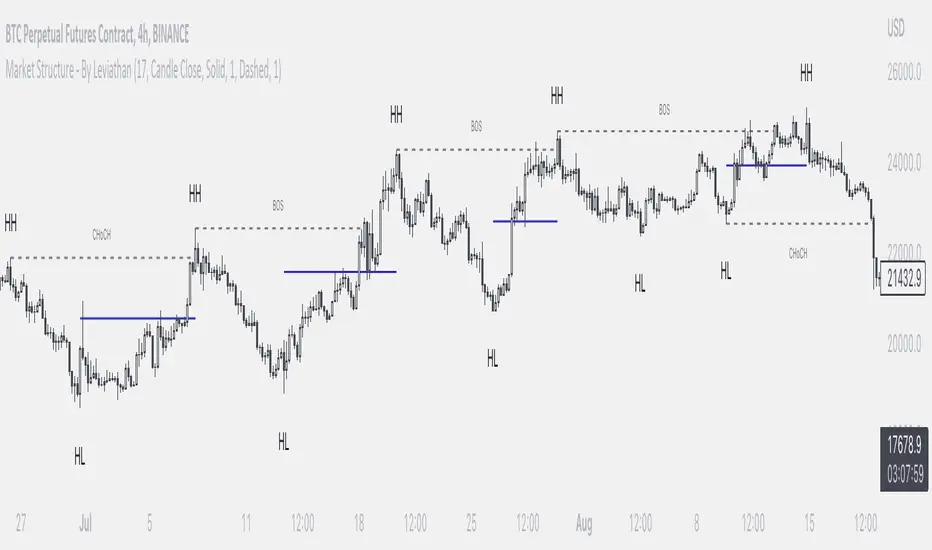
Market Structure - By LeviathanThis indicator helps you identify market structure by plotting swing highs and lows (HH, LH, HL, LL), BOS/CHOCH and 0.5 retracement levels. Other functionalities will be added in future updates.
Indicator Settings Overview
SWING LENGTH
The number of leftbars and rightbars when searching for swing points. The lower the value, the more swing points are shown and the higher the value, the less swing points are shown. I suggest adjusting it to fit your style and when switching between different timeframes.
BOS CONFIRMATION
Choose whether a Break of Structure is determined by a candle close or a wick breaching previous swing point. Using the "Wick" confirmation option will result in more breaks of structure.
CHOCH
Turning this ON renames the first counter trend Break of Structure (BOS) to CHoCH (Change of Character) and therefore signaling a possible trend shift.
SHOW 0.5 RETRACEMENT LEVEL
This will show a level halfway between a swing low and a swing high of an expansion move, which can act as an approximate retracement point if the trend continues.
In uptrends, 0.5 level is drawn between Higher Lows (HL) and Higher Highs ( HHs ). Long entries can be placed around that level if you suspect that the uptrend will continue.
In downtrends, 0.5 level is drawn between Lower Highs (LH) and Lower Lows (LLs). Short entries can be placed around that level if you suspect that the downtrend will continue.
RSI & BB QQE Mod (highlight)This script is a combination of the RSI, QQE and BB
Here is an explanation on how I combined them, and how they are used:
- RSI (Relative Strength Index)
- Display a smoothed version of the RSI to identify "oversold" and "overbought" market phases
- Used to calculate a QQE
- QQE (Quantitative Qualitative Estimation)
- Used to identify trend direction and trend strength
- Used to set a basis for the BB
- BB (Bollinger Bands)
- Used with QQE as a basis to determine a relative definition of "high RSI" and "low RSI"
- Used with QQE as a basis to determine the volatility of the RSI at a given moment
- Used to predict pivot points
Here are the main signals:
- When "RSI Smoothed" line above the Upper BB then "RSI Smoothed" line turns green
- Also , display green background color highlight
- Also , and if "RSI Smoothed" is above the overbought line then display a second green background color highlight
- When "RSI Smoothed" line bellow the Lower BB then "RSI Smoothed" line turns red
- Also , display red background color highlight
- Also , and if "RSI Smoothed" is bellow the oversold line then display a second red background color highlight
A tool codded to be aesthetically pleasing and VERY customisable:
- Designed for both light theme and dark theme users
- Value can be easily modified in the settings
- Colors can be easily swapped in the settings
- Opacity of "fill" & "bgcolor" regrouped as a single input
A tool codded to be easy to read and to learn from:
- Sources and inspirations all listed within the script
- Structure easily identifiable (to understand with little to no effort how the script works)
Notes :
- This script is lagging, because of that I do recommend using it on relatively large timeframe
- This script is OpenSource, feel free to reuse it, but if so please remember to include a link to my script in your sources
- This script is not a magical tool, use at your own risk

Support & Resistance Trendlines with PP + Fib. Channel█ Support & Resistance Trendlines with Pivot Points + Fibonacci Channel
This script automatically draw support and resistance trend lines based on pivot points and add a fibonacci channel.
It will show potential patterns with the help of support and resistance lines as well as breakout target and pullback entry with the fibonacci extension and retracement levels.
It is based on atolelole's script, I only made it more configurable so please check out his script.
I added the possibility to change values and add additional retracement and extension levels.
I also made it customizable with the possibility to change lines color, width and style.

Pivot mtf semaphore support&resistance [LM]Hello Traders,
I would like to introduce you pivot semaphore mtf support&resistance levels. The idea is the same as my other S/R scripts to have a look at the important levels. The Semaphore is used to spot future multi-level Supports and Resistance zones. It is also useful to spot HL or LL or HH or LH zones. The script is based on amazing work of @LucF so really big thanks for your work on mtf line offsetting.
It has three settings:
First two settings are for higher timeframes
Third setting is setting for pivots on current timeframe
!!!! Very important is there is limitation in pinescript how many candles you can look back(4999) if you choose timeframes that are very distant from each other there is a chance that those lines won't show up
Hopefully you will enjoy
Cheers, Lukas

PivotsSimply plots pivots found on any timeframe based on length specified.
Supports other timeframes, you choose to display gaps or not, with gaps on the labels may disappear so keep that in mind.

RSI Trend Veracity (RSI TV)The RSI only plots itself between a high and a low value. It does not show its bullish/bearish sentiment.
The RSI TV shows the sentiment and helps anticipate the RSI trend but not the price trend.
When the Trend Veracity Line is in green, there is bullish sentiment. When it is in red, there is bearish sentiment.
The closer the lines get to their extremities, the more the current trend of the RSI is exhausted.
It works quite well even in choppy markets. See notes in the picture for more details.

FREE PVT 2 [BELES]This indicator was created by using a pivot strategy for testing purposes, by making arrangements from a different open source software. 100% ineffective, do not perceive it as a buy-sell and investment recommendation, Bu indikatör test amacıyla pivot strateji kullanılarak açık kaynak kodlu farklı bir yazılımdan düzenlemeler yapılarak oluşturlulmuştur. %100 sonuç vermez al sat ve yatırım öneri olarak algılamayın

TrapointsAn indicator that has Camarilla Pivot Points with some preferred color settings and Fibonacci Pivot Points with some custom levels. This indicator was created to facilitate a "plug & play" version of these pivot points for a friend's community, and I like to share all the scripts I create so that they can potentially serve as helpful references for fellow authors in the community.
The main uses of the pivot points for this indicator are for reference as support/resistance levels.
Liquidity Heatmap (Nephew_Sam_)Liquidity Heatmap
This indicator plots a heatmap of resting liquidity above and below swing lows and multiple timeframes
The darker the color is or the larger the zone is, the more liquidity is lying there. If you think there are too many zones, you can increase the timeframes in the settings or just disable it.
Liquidity simply means orders such as stoplosses, buy/sell stops.
Disclaimer: You are free to use this code but your should be open source too

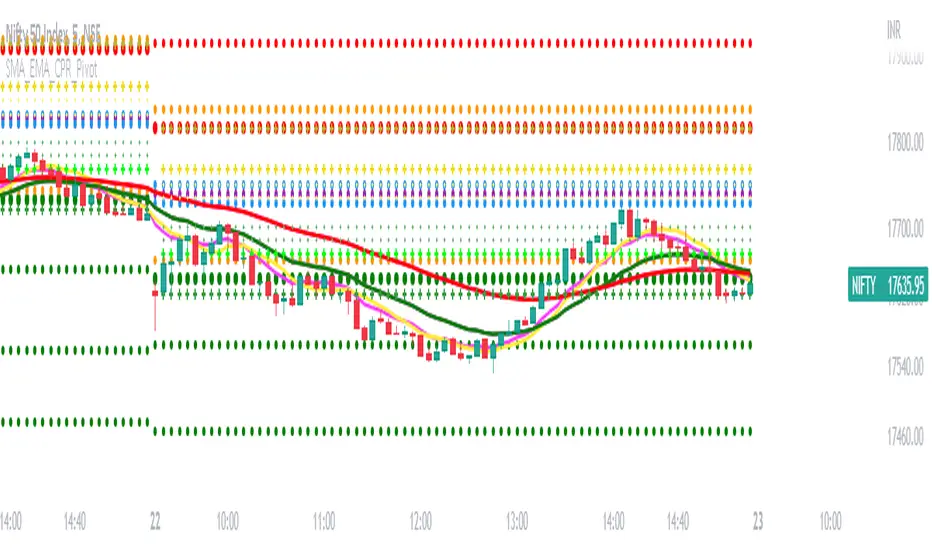
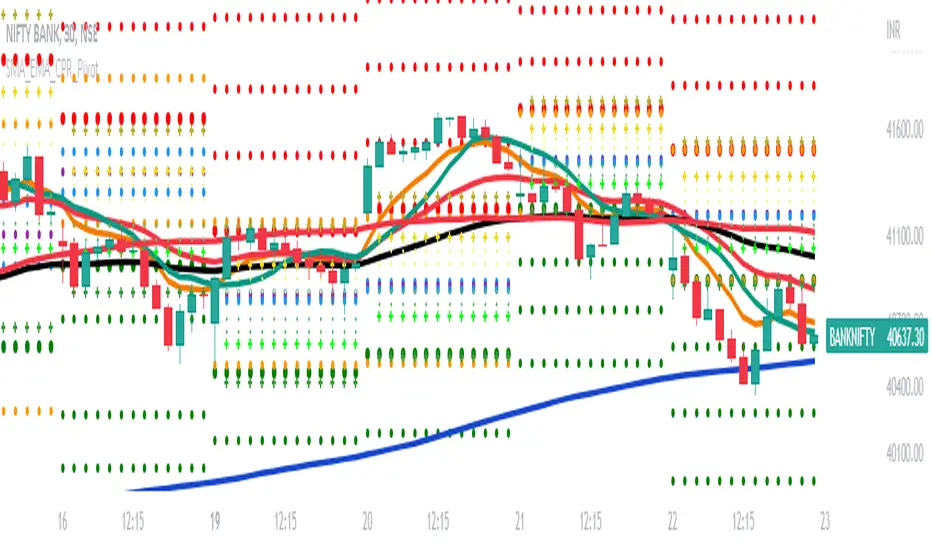
SMA_EMA_CPR_PivotThis Script can do multiple jobs in single indicator.
Like -:
Plot 3 SMA as per your inputs.
Plot 3 EMA as per your inputs.
Plot CPR Levels.
Plot Pivot Levels.
Plot Previous Day High Low.
Indicator can used in Intraday stock trading, Positional Trading and options trading.
Please Enjoy.