Month breaksA very simple indicator that marks the start of every month with a vertical line. But default the vertical line is gray with 80% transparency but you can customize the style/color/transparency as you like.
I hate crowded charts, bloated with all kind of crazy shapes and I created this indicator for two main reasons:
1. beginning/end of the month is an excellent pivot-point
2. to be simple, easy to customize and non-intrusive with the underlying chart
See the attached EURUSD daily chart, at the beginning of every month the price pivoted up and down, can you figure out what happens at the end of Dec 2019?
Trade long and prosper!!!
Points pivots


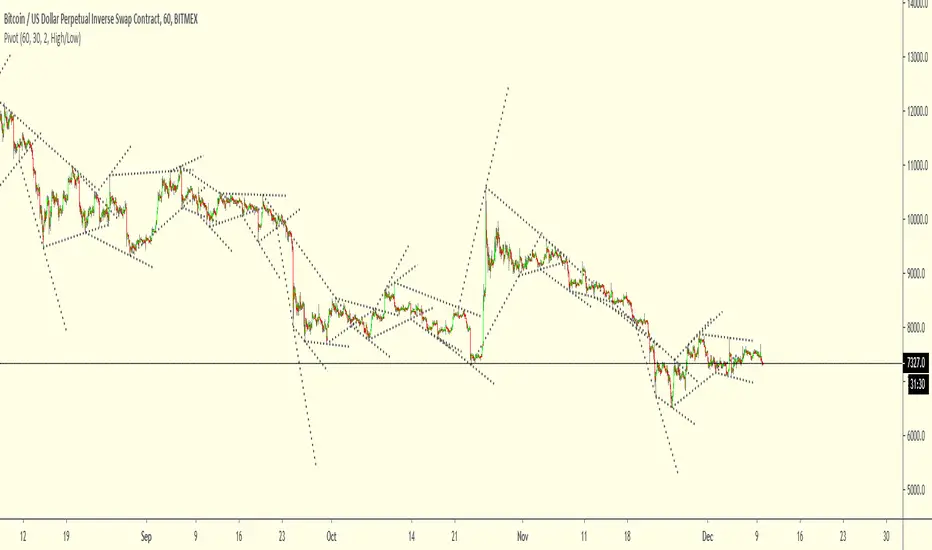
Triangle finderBased on the diags indicator to find triangle patterns on the chart.
Increase the "Line Length" to find more patterns

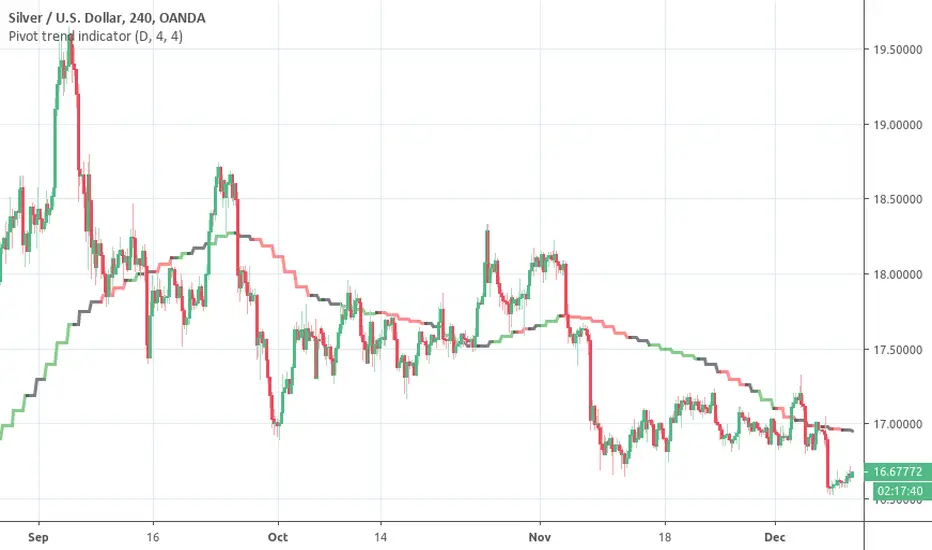
Pivot trend indicatorThis is a LAGGING indicator which can provide a good indication of trend. It require a certain (configurable) number of candles to have closed before it can determine whether a pivot has formed.
It provides a 20 period SMA for the timeframe of your choice which is color coded to show the trend according to confirmed pivots.
Anticipated usage:
Long / Short bias is determined by pivot trend
Trader seeks entries according to their strategy
Black consolidation areas may trigger a re-evaluation of the trade and can serve as good profit taking areas
The SMA colors:
Green -> Higher highs & Higher lows
Red -> Lower highs & Lowers lows
Black -> No clear trend from the pivots
Why the 20 SMA?
Feel free to adjust it for your purposes. I personally find that using a higher time frame 20 SMA is a better indication of trend than longer period MAs on shorter time frames. This can be seen from comparing the 20 daily SMA and 200 hourly SMA.
Pivot adjustment
The pivots use the selected time frame (not) the MA trend time frame. You can specify the left and right candles required to confirm a pivot
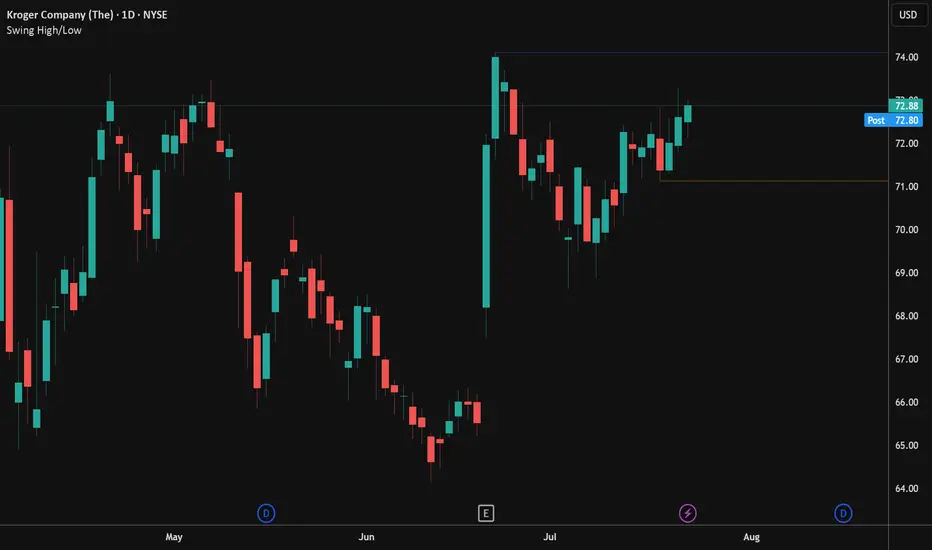
Swing High/LowPlots the swing high and low points based on user configurable look back settings. Also allows you to plot the most recent swing low as a horizontal line for obvious stop point on long setups.
CPR WidthThe indicator shows the width of the Central Pivot Range. Frank Ochoa call it It Pivot Range Histogram in his book.
Use it in conjunction with the Central Pivot Range indicator.
Below is the interpretation of the reading.
CPR Width > 0.5 - Sideways or Trading Range Day,
CPR Width > 0.75 - increases the likelihood of sideways trading behavior,
CPR Width < 0.5 - Trending type of day,
CPR Width < 0.25 - increases the likelihood of a trending market.
The above reading only increases the likely-hood of the possibility and not always right.

The Multi-day Central Pivot RangeThe indicator is a Multi-day CPR.
It shows CPR range as per yesterday's HLC and also CPR range for last n number of trading sessions.
For example: If you mention the value as two in Multi-day CPR (blue color) then it calculates the CPR using HLC of the last two trading sessions.
Also, the daily CPR is designed in such a way to highlight Virgin CPR (purple color) separately from the normal CPR(fuchsia color) .

Swings High Low with dates BY CheI share this simple indicator for free.
The indicator consists of marking the most important swings, either high or low.
So you can analyze how the price interacts in the future with these values.
The original code belongs to another author.
I added the possibility to filter swings between dates, this way only the swings we are interested in between those dates are marked.
Feel free to share and copy this script!
Enjoy!

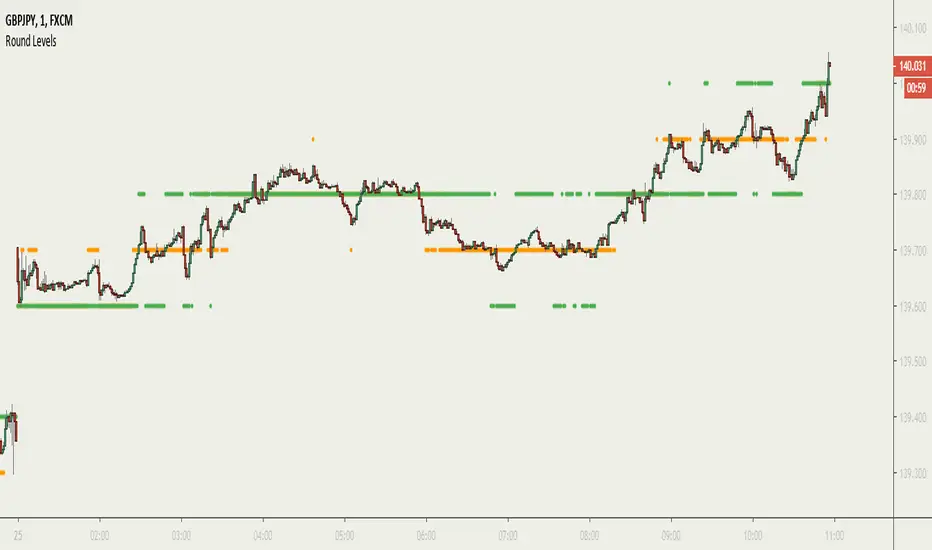
Round LevelsАutomatic drawing of round levels depending on the trader's preferences (such as currency pair or timeframe). Change the "Delimiter" parameter to build the levels you need.
This indicator is based on the "NL Round Levels" indicator. Thank you to the developer.
Автоматическое рисование круглых уровней в зависимости от предпочтений трейдера (таких как актив или таймфрейм). Меняйте параметр "Delimiter" для того, чтобы построить нужные вам уровни.
Этот индикатор базируется на индикаторе "YK Round Levels". Спасибо разработчику.
The Golden PivotsThe Golden Pivots indicator is a combination of the following:
1. Central Pivot Range
2. Floor Pivots
3. Camarilla Pivots
4. Monthly, Weekly, Daily Highs and lows
5. Candlestick Setups
All the pivot calculations are based on Secret of Pivot Boss book by Frank Ochoa.
One can also view tomorrow's central pivot range by today end of the day.

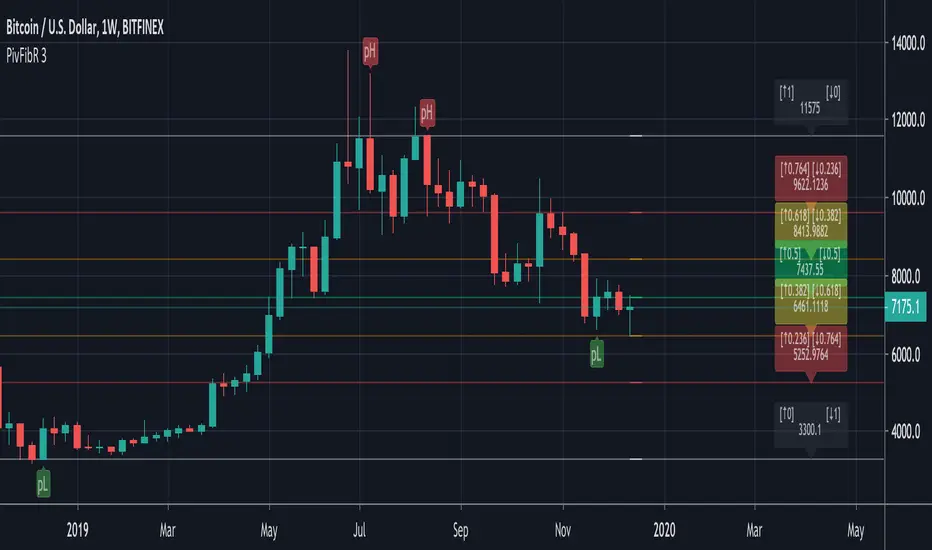
Pivots Fibonacci RetracementThis is a Fibonacci Retracement indicator based on Pivots.
The Fibonacci lines are always drawn between the LAST High Pivot (Red Triangle Down) and the LAST Low Pivot (Green Triangle Up)
Every time a new High or Low Pivot is found, the Fibonacci lines changes.
"RightBars" & "LeftBars" from Pivots are kept the same > "Bars"
In this example (BTCUSDT) the "Bars" are set as 10 (= period "Left" & "Right" where "Highs" & "Lows" are found):
This is the bigger picture:
If the settings are changed, for example "Bars" > 30, the Fibonacci lines are placed on different points:
If we need to take the previous "Low" Pivot ("Bars" > 45):
You see you need to change the "Bars" a bit to get what you want.
The extended Fibonacci levels (1.618 & 2) and (-0.618 & -1) are also included,
these can be used for future "Target-lines":
IF there is a NEW Pivot ("High" or "Low") which is visible because the Fibonacci lines HAVEN'T passed the "Red Triangle Down" or "Green Triangle Up" YET,
please WAIT until the close of that period, otherwise the "Triangle" possibly could still disappear again.
The dashed coloured lines and coloured Fibonacci numbers at the right are for easier readings and interpretation.
Significant PP - Swing Failure / Stop Run Alerts [QN]Tried to create a script for Swing Failure / Stop Run patterns. It is based on my QuantNomad - "Significant Pivot Reversal" Indicator.
It's quite tricky to code these kinds of patterns, so it's really not ideal. I alert when a candle cross pivot level but close below (above for bottom) it and previous close was below (above) it as well.
You can setup params for pivot points and also by how much it should cross pivot level with "SF ATR Mult".
I have in mind a few other things I'd like to test:
* Different types of pivot points
* Few recent pivot levels at once
* Pivots from higher timeframe
* Different types of "touching" levels
* etc.
Ideally, I want to create a strategy from it, but I'm far from it for now.
Do you have any ideas on how to make it better?
Original Significant Pivot Reversal Indicator:

NYSE Session for 24/7 marketsThis script is used for analyzing the correlation between 24/7 markets with regards to the price action during NYSE session. Defaults to showing daily session open/high/low but there is the option to show the weekly session data.
IMR DAILY FIBGREETINGS TRADERS !!!
TRADE in trend
with support & resistence of fibonachi pivot of daily
usefull for each & every script
built in ema crossovers for safe traders
specialy used for intraday (1-2-3-5 min timeframe )& swing trades SIMPEL & HANDY INDICATOR
tried to kept the function of indicatoer very easy & user freindly
plz use & share your feedback
ENJOY LIKE & SHARE TO OTHERS !!!!

Pivot Points HIgh LowRemake of the integrated Pivot Points indicator
With higher resolution you should lower the indicator values to get a good result

Market Profile for Futures with Session and After Hours SplitAdapted existing Market Profile scripts to be move suitable for Futures Markets with Session and After Hours split
Script Provides split Market Profiles for Session and After Hours
Users can customize the Session and AH hours inputs to suit any ticker and their interpretation of prime and non-prime hours

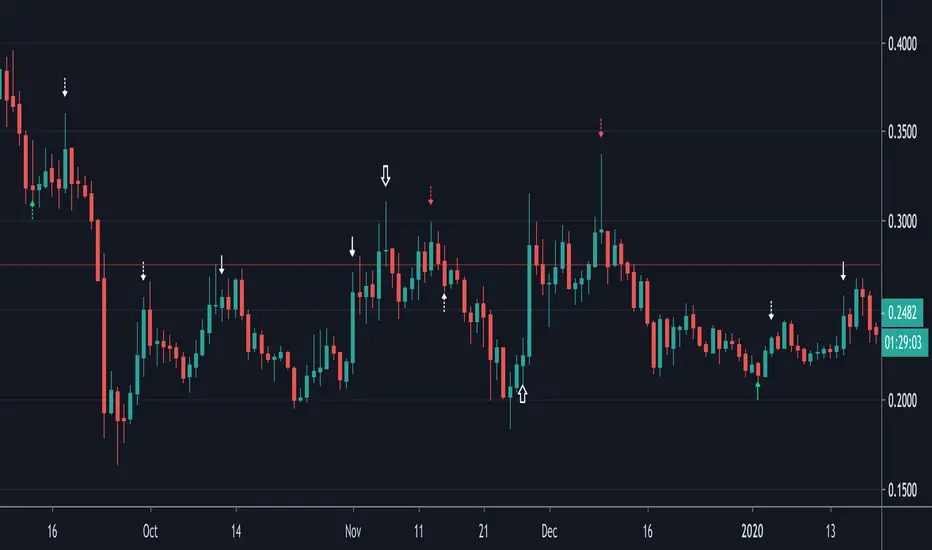
Divergences (Pivots)I created the divergence indicator using pivot points.
Leftbars and Rightbars of Pivots are the same here and taken together as "Div Period", default set as 2 (= "Short" period).
The second period ("Long") multiplies this by 2, if a period of 2 is set, the "Long" period will be 4.
The third period ("Long2") multiplies the "Long" by 2, in this case the "Long2" period would be 8.
In these periods the high and lows of "source" (default = "close", can be changed though) and "RSI" are captured and compared.
The default "RSI length" of "14" can be changed as well.
"Short", "Long" and "Long2" periods can be made visible together or separately (Settings > Inputs).
I recommend to use a "Period" of "1" when using "W" charts, "1 or 2" on "D" charts, and "2 or 3" (maybe higher) when using lower timeframes.
Bullish divergences are "Green", Bearish divergences are "Red", Hidden divergences (Bullish and Bearish) are "White".
"Short" > "▲▼" (Bullish = Up, Bearish = Down)
"Long" > "∆∇" (Bullish = Up, Bearish = Down)
"Long2" > "⇧⇩" (Bullish = Up, Bearish = Down)
The "Values" of "HH"(Higher High), "LL" (Lower Low"), "HL"(Higher Low) & "LH"(Lower High) can be made visible (Settings > Inputs).
Thank you!
Simple AverageSimple average, with builtin plot of a true Weekly, Monthly, Quarterly and Yearly average
(A variation on Pivots, with only the P line (HLC/3))

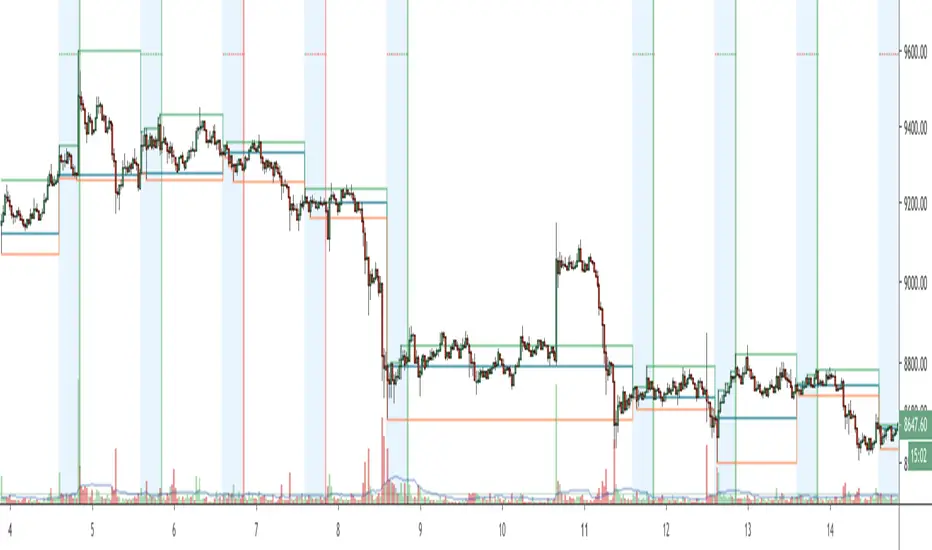
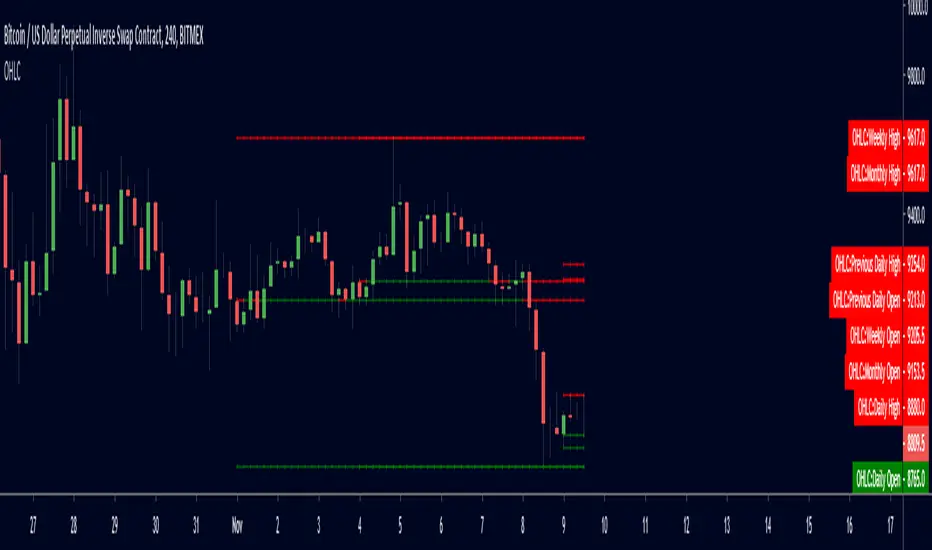
Simple OHLCSimple OHLC containing daily, previous daily, weekly and monthly levels. Hides past levels to keep chart clean.
Colors levels red if current price is below level and green if current price is above level.
QuantNomad - Significant Pivot Reversal Strategy AlertsAlerts for "Significant Pivot Reversal Strategy":
As one of the ways to filter out insignificant levels I decided to check that pivot point is not above/below neighbors, but check that it's above/below at least by a certain amount.
I use ATR, so in params, you can set length of ATR and also ATR multiplier. The new level will be calculated only if PP will be above/below neighbors by atr * atr_mult.
It seems this approach might help in some cases.

Murreys Math Lines Box OR Ratio PivotsI'm publishing my second script, though nothing extraordinary, I believe there is user group for Murry Math indies and the only "proper one" (According to my usage) I found was of RicardoSantos, here is the link :
He developed that script in 2014 and it is in need of update to Pine V4 and I'm doing the needful as its user.
All the updates from my end are listed below:
1. Updated to Pine V4
2. Automatic octave selection
3. In auto mode one can switch octave
4. This script is color coded with intention of use on dark theme, one can change the colors to use it on white background with simple few clicks as pinelines have been used
Other thing I want to add is that usage of this is not very clear to many users, so I'll do little explaining here;
Lets start with what is Octave? Octave is basically distance between square of two whole numbers, this is hard-fast method to calculate, Murry has made it far more complicated to use practically. In mathematical formula terms it could be something like this for script trading at 11890 (CMP)
Step 1: Square Root of CMP i.e Square Root of 11890 = 109.041 = Rounded to 109
Step 2: You can either take one whole number higher or lower than 109, which is 108 or 110. We will take 108
Step 3: Square of 108 = 11664 and Square of 109 = 11881
Step 4: Octave => Distance between (Lowlevel) 11664 and (Higherlevel) 11881
I've automated it so you don't need to calculate, but there is also manual entry possible if you want to calculate octaves yourself, there are different ways to calculate and some like to just take High and Low's of the day or week or month, whatever you like. When I used it I did it strictly this way, so automation is based on it. This is very subjective matter so don't ask to change the calculation of this, if I started doing that every second person would ask me to modify it to different calculation..and thats...just not possible to do.
This is output for calculation we just did above
This is octave shift option (Which basically shifts to next whole number square in above calculation)
Normal nomenclature on octaves and important color codes
+2/8: Extreme overbought = Blue Color and solid line
+1/8: OverBought
8/8: Hardest line to rise above (overbought) = White Color and solid line
7/8: Fast reverse line (weak)
6/8: Pivot reverse line = Yellow Color and solid line
5/8: Upper trading range
----------------------------------------
4/8: Major reversal line = Green Color and solid line
----------------------------------------
3/8: Lower trading range
2/8: Pivot reverse line = Blue Color and solid line
1/8: Fast reverse line (weak)
0/8: Hardest line to fall below (oversold) = White Color and solid line
-1/8: Oversold
-2/8: Extreme Oversold = Yellow Color and solid line
Other lines that I've not mentioned color codes for are minor and are usually plotted in dotted format.
Resources on complete technique to trade and importance of levels (highly recommended to read carefully before trading), if you don't know how to get this for free don't worry you can just google Murrey math and you will find it somewhere, its just that it would be in little scattered manner.
www.scribd.com
Enjoy!
