Advanced Momentum Scanner [QuantAlgo]The Advanced Momentum Scanner is a sophisticated technical indicator designed to identify market momentum and trend direction using multiple exponential moving averages (EMAs), momentum metrics, and adaptive visualization techniques. It is particularly valuable for those looking to identify trading and investing opportunities based on trend changes and momentum shifts across any market and timeframe.
🟢 Technical Foundation
The Advanced Momentum Scanner utilizes a multi-layered approach with four different EMA periods to identify market momentum and trend direction:
Ultra-Fast EMA for quick trend changes detection (default: 5)
Fast EMA for short-term trend analysis (default: 10)
Mid EMA for intermediate confirmation (default: 30)
Slow EMA for long-term trend identification (default: 100)
For momentum detection, the indicator implements a Rate of Change (RoC) calculation to measure price momentum over a specified period. It further enhances analysis by incorporating RSI readings for overbought/oversold conditions, volatility measurements through ATR, and optional volume confirmation. When these elements align, the indicator generates trading signals based on the selected sensitivity mode (Conservative, Balanced, or Aggressive).
🟢 Key Features & Signals
1. Multi-Period Trend Identification
The indicator combines multiple EMAs of different lengths to provide comprehensive trend analysis within the same timeframe, displaying the information through color-coded visual elements on the chart.
When an uptrend is detected, chart elements are colored with the bullish theme color (default: green/teal).
Similarly, when a downtrend is detected, chart elements are colored with the bearish theme color (default: red).
During neutral or indecisive periods, chart elements are colored with a neutral gray color, providing clear visual distinction between trending and non-trending market conditions.
This visualization provides immediate insights into underlying trend direction without requiring separate indicators, helping traders and investors quickly identify the market's current state.
2. Trend Strength Information Panel
The trend panel operates in three different sensitivity modes (Conservative, Aggressive, and Balanced), each affecting how the indicator processes and displays market information.
The Conservative mode prioritizes trend sustainability over frequency, showing only strong trend movements with high probability.
The Aggressive mode detects early trend changes, providing more frequent signals but potentially more false positives.
The Balanced mode offers a middle ground with moderate signal frequency and reliability.
Regardless of the selected mode, the panel displays:
Current trend direction (UPTREND, DOWNTREND, or NEUTRAL)
Trend strength percentage (0-100%)
Early detection signals when applicable
The active sensitivity mode
This comprehensive approach helps traders and investors:
→ Assess the strength of current market trends
→ Identify early potential trend changes before full confirmation
→ Make more informed trading and investing decisions based on trend context
3. Customizable Visualization Settings
This indicator offers extensive visual customization options to suit different trading styles and preferences:
Display options:
→ Fully customizable uptrend, downtrend, and neutral colors
→ Color-coded price bars showing trend direction
→ Dynamic gradient bands visualizing potential trend channels
→ Optional background coloring based on trend intensity
→ Adjustable transparency levels for all visual elements
These visualization settings can be fine-tuned through the indicator's interface, allowing traders and investors to create a personalized chart environment that emphasizes the most relevant information for their strategy.
The indicator also features a comprehensive alert system with notifications for:
New trend formations (uptrend, downtrend, neutral)
Early trend change signals
Momentum threshold crossovers
Other significant market conditions
Alerts can be customized and delivered through TradingView's notification system, making it easy to stay informed of important market developments even when you are away from the charts.
🟢 Practical Usage Tips
→ Trend Analysis and Interpretation: The indicator visualizes trend direction and strength directly on the chart through color-coding and the information panel, allowing traders and investors to immediately identify the current market context. This information helps in assessing the potential for continuation or reversal.
→ Signal Generation Strategies: The indicator generates potential trading signals based on trend direction, momentum confirmation, and selected sensitivity mode. Users can choose between Conservative (fewer but more reliable signals), Balanced (moderate approach), or Aggressive (more frequent but potentially less reliable signals).
→ Multi-Period Trend Assessment: Through its layered EMA approach, the indicator enables users to understand trend conditions across different lookback periods within the same timeframe. This helps in identifying the dominant trend and potential turning points.
🟢 Pro Tips
Adjust EMA periods based on your timeframe:
→ Lower values for shorter timeframes and more frequent signals
→ Higher values for higher timeframes and more reliable signals
Fine-tune sensitivity mode based on your trading style:
→ "Conservative" for position trading/long-term investing and fewer false signals
→ "Balanced" for swing trading/medium-term investing with moderate signal frequency
→ "Aggressive" for scalping/day trading and catching early trend changes
Look for confluence between components:
→ Strong trend strength percentage and direction in the information panel
→ Overall market context aligning with the expected direction
Use for multiple trading approaches:
→ Trend following during strong momentum periods
→ Counter-trend trading at band extremes during overextension
→ Early trend change detection with sensitivity adjustments
→ Stop loss placement using dynamic bands
Combine with:
→ Volume indicators for additional confirmation
→ Support/resistance analysis for strategic entry/exit points
→ Multiple timeframe analysis for broader market context
Gestion de portefeuille

Vietnamese Stocks: Multi-Ticker Fibonacci AlertThis Pine Script™ indicator is designed specifically for traders monitoring the Vietnamese stock market (HOSE, HNX). Its primary goal is to automate the tracking of Fibonacci retracement levels across a large list of stocks, alerting you when prices breach key support zones.
Core Functionality:
The script calculates Fibonacci retracement levels (23.6%, 38.2%, 50%, 61.8%, 78.6%) for up to 40 tickers simultaneously. The calculation is based on the highest high and lowest low identified since a user-defined Start Time. This allows you to anchor the Fibonacci analysis to a specific market event, trend start, or time period relevant to your strategy.
What it Does For You:
Automated Watchlist Scanning: Instead of drawing Fib levels on dozens of charts, select one of the two pre-configured watchlists (up to 40 symbols each, customizable in settings) populated with popular Vietnamese stocks.
Time-Based Fibonacci: Define a Start Time in the settings. The script uses this date to find the subsequent highest high and lowest low for each symbol in your chosen watchlist, forming the basis for the Fib calculation.
Intelligent Alerts: Get notified via TradingView's alerts when the candle closing price of any stock in your active watchlist falls below the critical 38.2%, 50%, 61.8%, or 78.6% levels relative to its own high/low range since the start time. Alerts are consolidated for efficiency.
Visual Aids:
- Plots the same time-based Fibonacci levels directly on your current chart symbol for quick reference.
- Includes an optional on-chart table showing which monitored stocks are currently below key Fib levels (enable "Show Debug Info").
- Features experimental background coloring to highlight potential bullish signals on the current chart.
Configuration:
Start Time: Crucial input – sets the anchor point for Fib calculations.
WatchList Selection: Choose between WatchList #1 (Bluechip/Midcap focus) or WatchList #2 (Defensive/Other focus) using the boolean toggles.
Symbol Customization: Easily replace the default symbols with your preferred Vietnamese stocks directly in the indicator settings.
Notification Prefix: Add custom text to the beginning of your alert messages.
Alert Setup: Remember to create an alert in TradingView, selecting this indicator and the alert() condition, usually with "Once Per Bar Close" frequency.
This tool is open-source under the MPL 2.0 license. Feel free to use, modify, and learn from it.

Enhanced Execution ToolA comprehensive position sizing calculator for disciplined risk management
Description :
This tool provides traders with precise position sizing calculations based on their account parameters and market conditions. The indicator calculates optimal position sizes for different entry scenarios while maintaining strict risk control.
Key Features:
Multiple entry options (High, Close, Manual)
Flexible stop loss configuration (LoD or Previous Day Low)
Account-based risk management (1% risk by default)
ATR-based distance metrics for volatility assessment
Clear visual table displaying all critical trade parameters
How to Use:
Configure your account size and risk percentage
Select your preferred entry methods (High/Close/Manual)
Choose stop loss reference (Low of Day or Previous Day Low)
View calculated position sizes and risk parameters
For manual entries, input your desired entry and stop prices
Input Parameters:
Account Configuration: Set your capital and risk tolerance
Entry Options: Choose which entry methods to display
Stop Loss: Select stop loss reference level
Technical Settings: Adjust ATR length and distance limits
Display Options: Customize table appearance
Output Includes:
Risk amount in dollars
Risk as percentage of entry price
Entry to stop loss as percentage of ATR
Stop loss price
Entry price
Position size as % of account
Share quantity
Ideal For:
Traders who want to maintain consistent risk management
Those who need quick position sizing calculations
Investors who trade with multiple entry strategies
Note: Always verify calculations before executing trades. This tool is designed to assist with trade planning, not as trade advice.

AI-123's BTC vs Gold (Lag Correlation)
DISCLAIMER
I made this indicator with the help of ChatGPT and using what I have learned so far from The Pine Script Mastery Course, LOTS of edits based on what I have learned so far had to be made as well as additions and modifications to my liking thanks to what I have learned so far. I am aware this already exists but I have done my best to make a first ever script/indicator while learning how to properly publish as well, so please bear that in mind.
Overview
This indicator analyzes the correlation between Bitcoin (BTC) and Gold (XAUUSD), with a customizable lag applied to the Gold price, providing insight into the macro relationship between these two assets.
It is designed for traders and investors who want to track how Bitcoin and Gold move in relation to each other, particularly when Gold is lagged by a specific number of days.
Key Features:
BTC and Gold (Lagged) Price Overlay: Display Bitcoin (BTC) and Gold (XAUUSD) prices on the chart, with an adjustable lag applied to the Gold price.
Rolling Correlation Calculation: Measures the correlation between Bitcoin and lagged Gold prices over a customizable lookback period.
Adjustable Lag: The number of days that Gold is lagged relative to Bitcoin is fully customizable (default: 20 days).
Customizable Correlation Length: Allows you to choose the lookback period for the correlation (default: 50 days), providing flexibility for short-term or long-term analysis.
Normalized Plotting: Prices of Bitcoin and Gold are normalized for better visual alignment with the correlation values. BTC is divided by 1000, and Gold by 100.
Correlation Scaling: The correlation value is amplified by 10 for better visual clarity and comparison with price data.
Zero Line: Horizontal line representing a correlation of 0, making it easier to identify positive or negative correlation shifts.
Maximum Correlation Lines: Horizontal lines at +10 and -10 values for extreme correlation scenarios.
Input Settings:
Gold Symbol: Customize the Gold ticker (default: OANDA:XAUUSD).
Bitcoin Symbol: Customize the Bitcoin ticker (default: BINANCE:BTCUSDT).
Lag (in trading days): Adjust the number of trading days to lag the Gold price relative to Bitcoin (default: 20).
Correlation Length (days): Set the number of days over which the rolling correlation is calculated (default: 50).
How to Use:
Price Comparison: The BTC (Spot) and Lagged Gold plots give you a side-by-side visual comparison of the two assets, normalized for clarity.
Correlation Line: The correlation line helps you gauge the strength and direction of the relationship between BTC and lagged Gold. Positive values indicate a strong positive correlation, while negative values indicate a negative correlation.
Visual Analysis: Watch how the correlation shifts with changes in lag and correlation length to identify potential market dynamics between Bitcoin and Gold.
Potential Applications:
Macro Trading: Track how Bitcoin and Gold behave in relation to each other during periods of economic uncertainty or inflation.
Sentiment Analysis: Use the correlation data to understand the sentiment between digital and traditional assets.
Strategic Timing: Identify potential opportunities where Bitcoin and Gold show a strong correlation or diverge based on the lag adjustment.
Understanding Macro Trends/Correlations.
Disclaimer:
This indicator is for informational purposes only. The correlation between Bitcoin and Gold does not guarantee future performance, and users should conduct their own research and use risk management strategies when making trading decisions.
Notes: This script uses historical data, so results may vary across different timeframes.
Customization options allow users to adjust the lag and correlation length to better fit their trading strategy.
Future Enhancements: Additional Correlation Line: A second correlation line for different lengths of lag or different assets.
Color-Coding of Correlation: Future updates may include color-coded correlation strength, visually indicating positive or negative correlation more effectively.

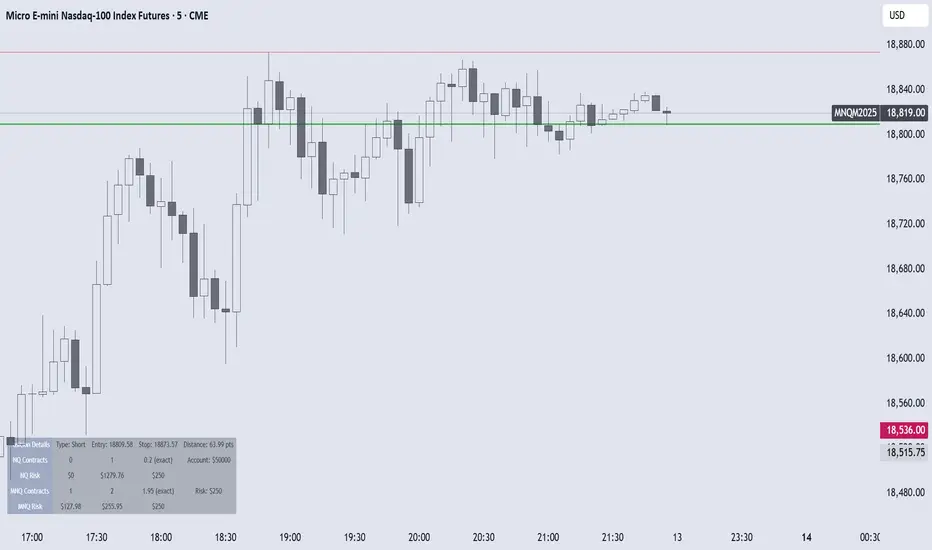
NQ/MNQ Position Sizing
Despite having my own position sizing calculator in an excel sheet, the manual process of having to identify my next trade, switch tabs/screens, input my values into the sheet, go back into TV, input the trade parameters with appropriate contract sizing, has always really gotten to me. I also found that I would often miss ideal entries due to the delay this caused.
I searched TV for position sizing calculators but almost all the ones I found seemed to be similar: based on some form of manual input for the entry and stop parameters, many of which had way more settings and parameters than I needed, also over complicated things.
I just needed something that would allow me to dynamically set my entry and stop levels directly on the chart, and spit out the appropriate contracts I should be using, either on NQ or MNQ, to maintain my desired level of risk, so I could quickly execute the necessary trade.
So, I coded my own and it's been a huge help to me already, so I thought I may as well publish the script as can't imagine there aren't others out there that also hate the manual data entry process of calculating risk.
Upon first load, the script will ask you to set your Entry and Stop levels, before drawing respective lines for these on the chart, and calculating contract sizing based on your risk settings, which you can update directly. The reset values may be buggy, will be easier to just remove the script and re-apply it to your chart if you ever lose track of the levels you've set.
Hope it's useful.
Lot Size TableLot Size Table Indicator – Pine Script (v5)
This TradingView script, “Lot Size Table,” creates a dynamic on-chart table that helps forex traders quickly calculate position sizes (lot sizes) for different capital and risk settings across various stop-loss (SL) pip scenarios.
🔧 Key Features:
📊 Real-time Forex Price Integration
Retrieves daily forex prices from OANDA for accurate lot size adjustments.
Instruments supported: USDJPY, USDCHF, AUDUSD, GBPUSD, NZDUSD, USDCAD, EURUSD.
🧠 Smart Lot Size Adjustments
Custom function adjustLotSize() adjusts lot sizes based on:
The currency of the instrument (e.g., JPY, GBP, AUD, etc.).
Special multiplier for symbols like US30 (e.g., ×8.5).
🧾 Flexible Capital & Risk Inputs
Supports 3 customizable capital groups, each with its own:
Capital amount
Risk percentage
📉 Multiple Stop-Loss (SL) Scenarios
Users input a comma-separated list of SL pip values (e.g., "20,25,30,...").
For each SL value, lot sizes are calculated for all 3 capital/risk combinations.
📋 Formatted On-Chart Table
Displays in a user-selected corner of the chart.
Customizable size, background color, and border.
Header row includes capital values and risk % (formatted to "k" if over 1,000).
Remaining rows show calculated lot sizes for each SL pip value.
📐 How It Works:
User Inputs: Capital, risk %, SL pip list, and table styling.
Calculation:
Lot size = (capital × risk%) / (SL pips × 10)
Adjusted based on instrument’s currency.
Display:
Table shows all SL pip scenarios and the corresponding adjusted lot sizes for each capital group.

Drawdown Visualizer v1.0Drawdown Visualizer
The Drawdown Visualizer tracks the percentage decline from all-time highs, providing valuable insights into market corrections and potential buying opportunities.
Key Features:
1) Real-Time Drawdown Tracking: The indicator continuously calculates and displays the current percentage drawdown from the all-time high price, color-coded from green (minimal drawdown) to red (severe drawdown) for instant visual feedback.
2) Maximum Drawdown Detection: Permanently tracks and displays the maximum historical drawdown encountered during the analyzed period, helping traders understand worst-case scenarios.
3) Statistical Analysis: Calculates and displays three important statistical measures:
* Average Drawdown: The mean value of all drawdowns recorded
* Median Drawdown: The middle value in the sorted list of all drawdowns, providing insight
into typical decline patterns
* Normal Drawdown Range: Visualizes the expected range of typical drawdowns based on
statistical standard deviation
Practical Applications:
1) Risk Management: Understand typical and extreme drawdowns to set appropriate stop-loss levels
2) Market Context: Gain perspective on whether current corrections are normal or exceptional
3) Entry Point Analysis: Identify potential buying opportunities when drawdowns reach statistical extremes

OverUnder Yield Spread🗺️ OverUnder is a structural regime visualizer , engineered to diagnose the shape, tone, and trajectory of the yield curve. Rather than signaling trades directly, it informs traders of the world they’re operating in. Yield curve steepening or flattening, normalizing or inverting — each regime reflects a macro pressure zone that impacts duration demand, liquidity conditions, and systemic risk appetite. OverUnder abstracts that complexity into a color-coded compression map, helping traders orient themselves before making risk decisions. Whether you’re in bonds, currencies, crypto, or equities, the regime matters — and OverUnder makes it visible.
🧠 Core Logic
Built to show the slope and intent of a selected rate pair, the OverUnder Yield Spread defaults to 🇺🇸US10Y-US2Y, but can just as easily compare global sovereign curves or even dislocated monetary systems. This value is continuously monitored and passed through a debounce filter to determine whether the curve is:
• Inverted, or
• Steepening
If the curve is flattening below zero: the world is bracing for contraction. Policy lags. Risk appetite deteriorates. Duration gets bid, but only as protection. Stocks and speculative assets suffer, regardless of positioning.
📍 Curve Regimes in Bull and Bear Contexts
• Flattening occurs when the short and long ends compress . In a bull regime, flattening may reflect long-end demand or fading growth expectations. In a bear regime, flattening often precedes or confirms central bank tightening.
• Steepening indicates expanding spread . In a bull context, this may signal healthy risk appetite or early expansion. In a bear or crisis context, it may reflect aggressive front-end cuts and dislocation between short- and long-term expectations.
• If the curve is steepening above zero: the world is rotating into early expansion. Risk assets behave constructively. Bond traders position for normalization. Equities and crypto begin trending higher on rising forward expectations.
🖐️ Dynamically Colored Spread Line Reflects 1 of 4 Regime States
• 🟢 Normal / Steepening — early expansion or reflation
• 🔵 Normal / Flattening — late-cycle or neutral slowdown
• 🟠 Inverted / Steepening — policy reversal or soft landing attempt
• 🔴 Inverted / Flattening — hard contraction, credit stress, policy lag
🍋 The Lemon Label
At every bar, an anchored label floats directly on the spread line. It displays the active regime (in plain English) and the precise spread in percent (or basis points, depending on resolution). Colored lemon yellow, neither green nor red, the label is always legible — a design choice to de-emphasize bias and center the data .
🎨 Fill Zones
These bands offer spatial, persistent views of macro compression or inversion depth.
• Blue fill appears above the zero line in normal (non-inverted) conditions
• Red fill appears below the zero line during inversion
🧪 Sample Reading: 1W chart of TLT
OverUnder reveals a multi-year arc of structural inversion and regime transition. From mid-2021 through late 2023, the spread remains decisively inverted, signaling persistent flattening and credit stress as bond prices trended sharply lower. This prolonged inversion aligns with a high-volatility phase in TLT, marked by lower highs and an accelerating downtrend, confirming policy lag and macro tightening conditions.
As of early 2025, the spread has crossed back above the zero baseline into a “Normal / Steepening” regime (annotated at +0.56%), suggesting a macro inflection point. Price action remains subdued, but the shift in yield structure may foreshadow a change in trend context — particularly if follow-through in steepening persists.
🎭 Different Traders Respond Differently:
• Bond traders monitor slope change to anticipate policy pivots or recession signals.
• Equity traders use regime shifts to time rotations, from growth into defense, or from contraction into reflation.
• Currency traders interpret curve steepening as yield compression or divergence depending on region.
• Crypto traders treat inversion as a liquidity vacuum — and steepening as an early-phase risk unlock.
🛡️ Can It Compare Different Bond Markets?
Yes — with caveats. The indicator can be used to compare distinct sovereign yield instruments, for example:
• 🇫🇷FR10Y vs 🇩🇪DE10Y - France vs Germany
• 🇯🇵JP10Y vs 🇺🇸US10Y - BoJ vs Fed policy curves
However:
🙈 This no longer visualizes the domestic yield curve, but rather the differential between rate expectations across regions
🙉 The interpretation of “inversion” changes — it reflects spread compression across nations , not within a domestic yield structure
🙊 Color regimes should then be viewed as relative rate positioning , not absolute curve health
🙋🏻 Example: OverUnder compares French vs German 10Y yields
1. 🇫🇷 Change the long-duration ticker to FR10Y
2. 🇩🇪 Set the short-duration ticker to DE10Y
3. 🤔 Interpret the result as: “How much higher is France’s long-term borrowing cost vs Germany’s?”
You’ll see steepening when the spread rises (France decoupling), flattening when the spread compresses (convergence), and inversions when Germany yields rise above France’s — historically rare and meaningful.
🧐 Suggested Use
OverUnder is not a signal engine — it’s a context map. Its value comes from situating any trade idea within the prevailing yield regime. Use it before entries, not after them.
• On the 1W timeframe, OverUnder excels as a macro overlay. Yield regime shifts unfold over quarters, not days. Weekly structure smooths out rate volatility and reveals the true curvature of policy response and liquidity pressure. Use this view to orient your portfolio, define directional bias, or confirm long-duration trend turns in assets like TLT, SPX, or BTC.
• On the 1D timeframe, the indicator becomes tactically useful — especially when aligning breakout setups or trend continuations with steepening or flattening transitions. Daily views can also identify early-stage regime cracks that may not yet be visible on the weekly.
• Avoid sub-daily use unless you’re anchoring a thesis already built on higher timeframe structure. The yield curve is a macro construct — it doesn’t oscillate cleanly at intraday speeds. Shorter views may offer clarity during event-driven spikes (like FOMC reactions), but they do not replace weekly context.
Ultimately, OverUnder helps you decide: What kind of world am I trading in? Use it to confirm macro context, avoid fighting the curve, and lean into trades aligned with the broader pressure regime.

Correlation Heatmap█ OVERVIEW
This indicator creates a correlation matrix for a user-specified list of symbols based on their time-aligned weekly or monthly price returns. It calculates the Pearson correlation coefficient for each possible symbol pair, and it displays the results in a symmetric table with heatmap-colored cells. This format provides an intuitive view of the linear relationships between various symbols' price movements over a specific time range.
█ CONCEPTS
Correlation
Correlation typically refers to an observable statistical relationship between two datasets. In a financial time series context, it usually represents the extent to which sampled values from a pair of datasets, such as two series of price returns, vary jointly over time. More specifically, in this context, correlation describes the strength and direction of the relationship between the samples from both series.
If two separate time series tend to rise and fall together proportionally, they might be highly correlated. Likewise, if the series often vary in opposite directions, they might have a strong anticorrelation . If the two series do not exhibit a clear relationship, they might be uncorrelated .
Traders frequently analyze asset correlations to help optimize portfolios, assess market behaviors, identify potential risks, and support trading decisions. For instance, correlation often plays a key role in diversification . When two instruments exhibit a strong correlation in their returns, it might indicate that buying or selling both carries elevated unsystematic risk . Therefore, traders often aim to create balanced portfolios of relatively uncorrelated or anticorrelated assets to help promote investment diversity and potentially offset some of the risks.
When using correlation analysis to support investment decisions, it is crucial to understand the following caveats:
• Correlation does not imply causation . Two assets might vary jointly over an analyzed range, resulting in high correlation or anticorrelation in their returns, but that does not indicate that either instrument directly influences the other. Joint variability between assets might occur because of shared sensitivities to external factors, such as interest rates or global sentiment, or it might be entirely coincidental. In other words, correlation does not provide sufficient information to identify cause-and-effect relationships.
• Correlation does not predict the future relationship between two assets. It only reflects the estimated strength and direction of the relationship between the current analyzed samples. Financial time series are ever-changing. A strong trend between two assets can weaken or reverse in the future.
Correlation coefficient
A correlation coefficient is a numeric measure of correlation. Several coefficients exist, each quantifying different types of relationships between two datasets. The most common and widely known measure is the Pearson product-moment correlation coefficient , also known as the Pearson correlation coefficient or Pearson's r . Usually, when the term "correlation coefficient" is used without context, it refers to this correlation measure.
The Pearson correlation coefficient quantifies the strength and direction of the linear relationship between two variables. In other words, it indicates how consistently variables' values move together or in opposite directions in a proportional, linear manner. Its formula is as follows:
𝑟(𝑥, 𝑦) = cov(𝑥, 𝑦) / (𝜎𝑥 * 𝜎𝑦)
Where:
• 𝑥 is the first variable, and 𝑦 is the second variable.
• cov(𝑥, 𝑦) is the covariance between 𝑥 and 𝑦.
• 𝜎𝑥 is the standard deviation of 𝑥.
• 𝜎𝑦 is the standard deviation of 𝑦.
In essence, the correlation coefficient measures the covariance between two variables, normalized by the product of their standard deviations. The coefficient's value ranges from -1 to 1, allowing a more straightforward interpretation of the relationship between two datasets than what covariance alone provides:
• A value of 1 indicates a perfect positive correlation over the analyzed sample. As one variable's value changes, the other variable's value changes proportionally in the same direction .
• A value of -1 indicates a perfect negative correlation (anticorrelation). As one variable's value increases, the other variable's value decreases proportionally.
• A value of 0 indicates no linear relationship between the variables over the analyzed sample.
Aligning returns across instruments
In a financial time series, each data point (i.e., bar) in a sample represents information collected in periodic intervals. For instance, on a "1D" chart, bars form at specific times as successive days elapse.
However, the times of the data points for a symbol's standard dataset depend on its active sessions , and sessions vary across instrument types. For example, the daily session for NYSE stocks is 09:30 - 16:00 UTC-4/-5 on weekdays, Forex instruments have 24-hour sessions that span from 17:00 UTC-4/-5 on one weekday to 17:00 on the next, and new daily sessions for cryptocurrencies start at 00:00 UTC every day because crypto markets are consistently open.
Therefore, comparing the standard datasets for different asset types to identify correlations presents a challenge. If two symbols' datasets have bars that form at unaligned times, their correlation coefficient does not accurately describe their relationship. When calculating correlations between the returns for two assets, both datasets must maintain consistent time alignment in their values and cover identical ranges for meaningful results.
To address the issue of time alignment across instruments, this indicator requests confirmed weekly or monthly data from spread tickers constructed from the chart's ticker and another specified ticker. The datasets for spreads are derived from lower-timeframe data to ensure the values from all symbols come from aligned points in time, allowing a fair comparison between different instrument types. Additionally, each spread ticker ID includes necessary modifiers, such as extended hours and adjustments.
In this indicator, we use the following process to retrieve time-aligned returns for correlation calculations:
1. Request the current and previous prices from a spread representing the sum of the chart symbol and another symbol ( "chartSymbol + anotherSymbol" ).
2. Request the prices from another spread representing the difference between the two symbols ( "chartSymbol - anotherSymbol" ).
3. Calculate half of the difference between the values from both spreads ( 0.5 * (requestedSum - requestedDifference) ). The results represent the symbol's prices at times aligned with the sample points on the current chart.
4. Calculate the arithmetic return of the retrieved prices: (currentPrice - previousPrice) / previousPrice
5. Repeat steps 1-4 for each symbol requiring analysis.
It's crucial to note that because this process retrieves prices for a symbol at times consistent with periodic points on the current chart, the values can represent prices from before or after the closing time of the symbol's usual session.
Additionally, note that the maximum number of weeks or months in the correlation calculations depends on the chart's range and the largest time range common to all the requested symbols. To maximize the amount of data available for the calculations, we recommend setting the chart to use a daily or higher timeframe and specifying a chart symbol that covers a sufficient time range for your needs.
█ FEATURES
This indicator analyzes the correlations between several pairs of user-specified symbols to provide a structured, intuitive view of the relationships in their returns. Below are the indicator's key features:
Requesting a list of securities
The "Symbol list" text box in the indicator's "Settings/Inputs" tab accepts a comma-separated list of symbols or ticker identifiers with optional spaces (e.g., "XOM, MSFT, BITSTAMP:BTCUSD"). The indicator dynamically requests returns for each symbol in the list, then calculates the correlation between each pair of return series for its heatmap display.
Each item in the list must represent a valid symbol or ticker ID. If the list includes an invalid symbol, the script raises a runtime error.
To specify a broker/exchange for a symbol, include its name as a prefix with a colon in the "EXCHANGE:SYMBOL" format. If a symbol in the list does not specify an exchange prefix, the indicator selects the most commonly used exchange when requesting the data.
Note that the number of symbols allowed in the list depends on the user's plan. Users with non-professional plans can compare up to 20 symbols with this indicator, and users with professional plans can compare up to 32 symbols.
Timeframe and data length selection
The "Returns timeframe" input specifies whether the indicator uses weekly or monthly returns in its calculations. By default, its value is "1M", meaning the indicator analyzes monthly returns. Note that this script requires a chart timeframe lower than or equal to "1M". If the chart uses a higher timeframe, it causes a runtime error.
To customize the length of the data used in the correlation calculations, use the "Max periods" input. When enabled, the indicator limits the calculation window to the number of periods specified in the input field. Otherwise, it uses the chart's time range as the limit. The top-left corner of the table shows the number of confirmed weeks or months used in the calculations.
It's important to note that the number of confirmed periods in the correlation calculations is limited to the largest time range common to all the requested datasets, because a meaningful correlation matrix requires analyzing each symbol's returns under the same market conditions. Therefore, the correlation matrix can show different results for the same symbol pair if another listed symbol restricts the aligned data to a shorter time range.
Heatmap display
This indicator displays the correlations for each symbol pair in a heatmap-styled table representing a symmetric correlation matrix. Each row and column corresponds to a specific symbol, and the cells at their intersections correspond to symbol pairs . For example, the cell at the "AAPL" row and "MSFT" column shows the weekly or monthly correlation between those two symbols' returns. Likewise, the cell at the "MSFT" row and "AAPL" column shows the same value.
Note that the main diagonal cells in the display, where the row and column refer to the same symbol, all show a value of 1 because any series of non-na data is always perfectly correlated with itself.
The background of each correlation cell uses a gradient color based on the correlation value. By default, the gradient uses blue hues for positive correlation, orange hues for negative correlation, and white for no correlation. The intensity of each blue or orange hue corresponds to the strength of the measured correlation or anticorrelation. Users can customize the gradient's base colors using the inputs in the "Color gradient" section of the "Settings/Inputs" tab.
█ FOR Pine Script® CODERS
• This script uses the `getArrayFromString()` function from our ValueAtTime library to process the input list of symbols. The function splits the "string" value by its commas, then constructs an array of non-empty strings without leading or trailing whitespaces. Additionally, it uses the str.upper() function to convert each symbol's characters to uppercase.
• The script's `getAlignedReturns()` function requests time-aligned prices with two request.security() calls that use spread tickers based on the chart's symbol and another symbol. Then, it calculates the arithmetic return using the `changePercent()` function from the ta library. The `collectReturns()` function uses `getAlignedReturns()` within a loop and stores the data from each call within a matrix . The script calls the `arrayCorrelation()` function on pairs of rows from the returned matrix to calculate the correlation values.
• For consistency, the `getAlignedReturns()` function includes extended hours and dividend adjustment modifiers in its data requests. Additionally, it includes other settings inherited from the chart's context, such as "settlement-as-close" preferences.
• A Pine script can execute up to 40 or 64 unique `request.*()` function calls, depending on the user's plan. The maximum number of symbols this script compares is half the plan's limit, because `getAlignedReturns()` uses two request.security() calls.
• This script can use the request.security() function within a loop because all scripts in Pine v6 enable dynamic requests by default. Refer to the Dynamic requests section of the Other timeframes and data page to learn more about this feature, and see our v6 migration guide to learn what's new in Pine v6.
• The script's table uses two distinct color.from_gradient() calls in a switch structure to determine the cell colors for positive and negative correlation values. One call calculates the color for values from -1 to 0 based on the first and second input colors, and the other calculates the colors for values from 0 to 1 based on the second and third input colors.
Look first. Then leap.

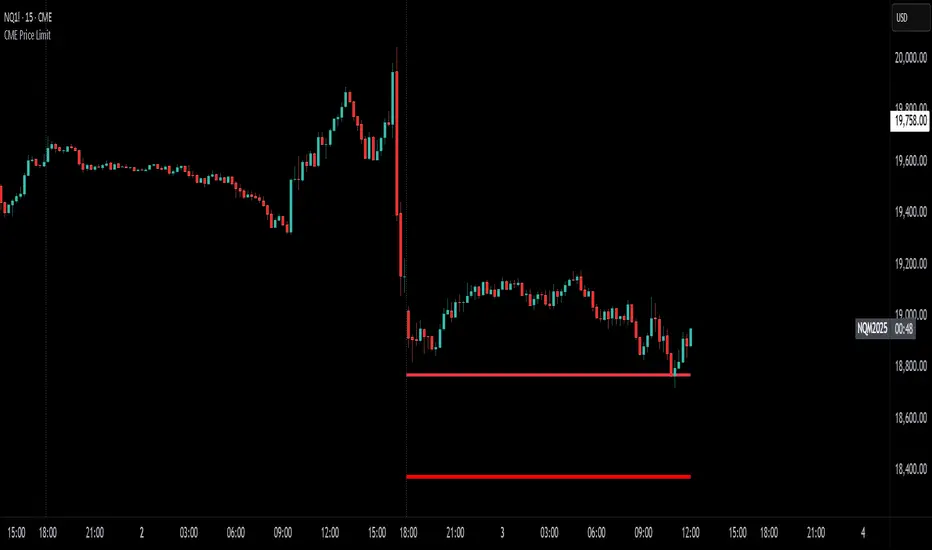
CME Price Limits (Futures Prop Firm Rule)This indicator shows the CME Price Limit, combined with a safety distance that is used by several futures prop firms. Trading in the highlighted area means a rule violation for many Futures prop firm accounts.
The levels are calculated from the "Settlement as close" closing price of the previous daily candle.

Live Risk/Reward Lines (Dynamic Update: Tick or Bar Close)This script displays dynamic Risk and Reward target lines directly on the chart.
You can choose whether the updates happen live with each price tick or only once a bar closes.
It supports both long and short trading directions, with customizable risk and reward percentages.
Key Features:
Dynamic live updates (per tick or per bar close).
Choose Long or Short trade direction.
Customize risk and reward percentages individually.
Adjustable line length and color.
Option to show or hide risk and reward lines.
How It Works:
For long trades: Risk = Close Price * (1 - Risk %), Reward = Close Price * (1 + Reward %).
For short trades: Risk = Close Price * (1 + Risk %), Reward = Close Price * (1 - Reward %).
Lines are automatically centered around the current bar.
Why It Is Unique:
Unlike static risk/reward indicators, this script allows traders to see real-time dynamic changes based on the latest tick or bar close.
It offers full flexibility for scalpers and swing traders by allowing manual control over update timing and visualization style.
Usage Instructions:
Select your trade direction (Long or Short) from the settings.
Set your preferred risk and reward percentages.
Choose whether lines should update with every tick or only on bar close.
Optionally adjust the length and colors of the lines.
Important:
The script focuses on visualizing risk and reward directly on the price chart without giving buy or sell signals.
Disclaimer:
This tool is intended for educational and informational purposes only and should not be considered financial advice.

Circuit Breaker - MFFUThis Indicator Is Used To Protect User From Over Trading After Market Hit The Circuit Breakers.
The CME Exchange Usually Halts Trading If Market Hit + or - 7%.
To Protect Users From Extreme Volatile Condition MFFU, Halts Trading If Market Hits + or - 5%.
This Indicator helps us to plot the circuit breaking lines helping us to when to stop trading.

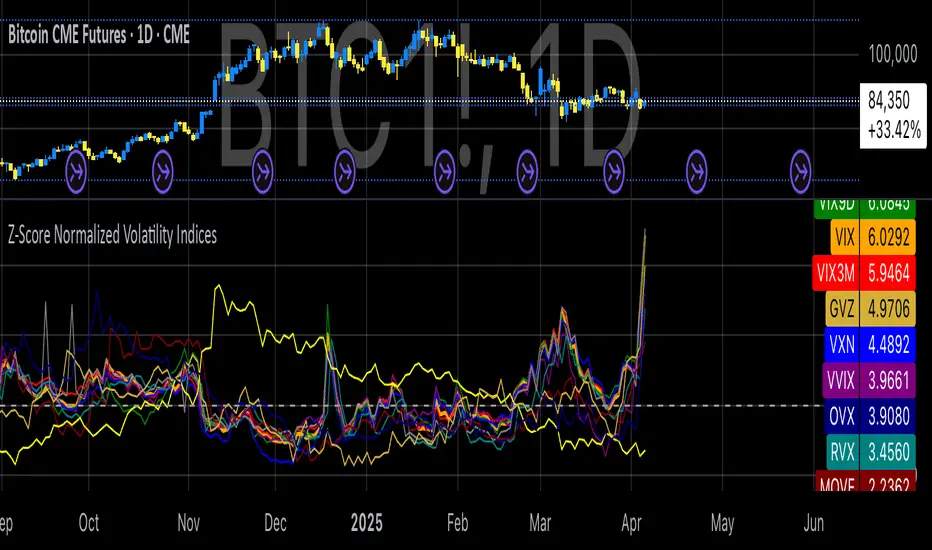
Z-Score Normalized Volatility IndicesVolatility is one of the most important measures in financial markets, reflecting the extent of variation in asset prices over time. It is commonly viewed as a risk indicator, with higher volatility signifying greater uncertainty and potential for price swings, which can affect investment decisions. Understanding volatility and its dynamics is crucial for risk management and forecasting in both traditional and alternative asset classes.
Z-Score Normalization in Volatility Analysis
The Z-score is a statistical tool that quantifies how many standard deviations a given data point is from the mean of the dataset. It is calculated as:
Z = \frac{X - \mu}{\sigma}
Where X is the value of the data point, \mu is the mean of the dataset, and \sigma is the standard deviation of the dataset. In the context of volatility indices, the Z-score allows for the normalization of these values, enabling their comparison regardless of the original scale. This is particularly useful when analyzing volatility across multiple assets or asset classes.
This script utilizes the Z-score to normalize various volatility indices:
1. VIX (CBOE Volatility Index): A widely used indicator that measures the implied volatility of S&P 500 options. It is considered a barometer of market fear and uncertainty (Whaley, 2000).
2. VIX3M: Represents the 3-month implied volatility of the S&P 500 options, providing insight into medium-term volatility expectations.
3. VIX9D: The implied volatility for a 9-day S&P 500 options contract, which reflects short-term volatility expectations.
4. VVIX: The volatility of the VIX itself, which measures the uncertainty in the expectations of future volatility.
5. VXN: The Nasdaq-100 volatility index, representing implied volatility in the Nasdaq-100 options.
6. RVX: The Russell 2000 volatility index, tracking the implied volatility of options on the Russell 2000 Index.
7. VXD: Volatility for the Dow Jones Industrial Average.
8. MOVE: The implied volatility index for U.S. Treasury bonds, offering insight into expectations for interest rate volatility.
9. BVIX: Volatility of Bitcoin options, a useful indicator for understanding the risk in the cryptocurrency market.
10. GVZ: Volatility index for gold futures, reflecting the risk perception of gold prices.
11. OVX: Measures implied volatility for crude oil futures.
Volatility Clustering and Z-Score
The concept of volatility clustering—where high volatility tends to be followed by more high volatility—is well documented in financial literature. This phenomenon is fundamental in volatility modeling and highlights the persistence of periods of heightened market uncertainty (Bollerslev, 1986).
Moreover, studies by Andersen et al. (2012) explore how implied volatility indices, like the VIX, serve as predictors for future realized volatility, underlining the relationship between expected volatility and actual market behavior. The Z-score normalization process helps in making volatility data comparable across different asset classes, enabling more effective decision-making in volatility-based strategies.
Applications in Trading and Risk Management
By using Z-score normalization, traders can more easily assess deviations from the mean in volatility, helping to identify periods when volatility is unusually high or low. This can be used to adjust risk exposure or to implement volatility-based trading strategies, such as mean reversion strategies. Research suggests that volatility mean-reversion is a reliable pattern that can be exploited for profit (Christensen & Prabhala, 1998).
References:
• Andersen, T. G., Bollerslev, T., Diebold, F. X., & Vega, C. (2012). Realized volatility and correlation dynamics: A long-run approach. Journal of Financial Economics, 104(3), 385-406.
• Bollerslev, T. (1986). Generalized autoregressive conditional heteroskedasticity. Journal of Econometrics, 31(3), 307-327.
• Christensen, B. J., & Prabhala, N. R. (1998). The relation between implied and realized volatility. Journal of Financial Economics, 50(2), 125-150.
• Whaley, R. E. (2000). Derivatives on market volatility and the VIX index. Journal of Derivatives, 8(1), 71-84.
Option Contract Size CalculatorOption Contract Size Calculator
This indicator helps you to figure out the ideal number of contracts for your trade and its only used for options day trading.
The indicator needs to fill the input section in order to give you the information table that includes Contract size .
The input section consists of two sections. The first section requires user entry of the delta of the options contract from the broker chain and the stop loss size on the chart.
The second section allows you to enter your account balance and risk per trade
(2% recommended) .
There is also the option for where you wish to display your table like bottom right , bottom left or top right, top left.
special thanks to @Mohamedawke for the open source script this code is based off

TP/SL Percentage & RR Visual ToolThis tool is designed to help traders visually and statistically assess their trade setup by calculating Stop Loss (SL), Take Profit (TP), and Risk-to-Reward (RR) based on percentage inputs from the current price.
🔧 How It Works:
Uses the current candle’s close price as your entry.
Calculates TP and SL as percentage-based levels (e.g., 1% SL, 1.5% TP).
Displays horizontal lines and labels on the chart for TP and SL (only on the latest candle to reduce clutter).
Shows a compact table in the top-right corner with all key values:
Entry Price
Current Price
TP Price (+%)
SL Price (-%)
TP Distance from current price
RR Ratio (e.g., 1:1.5)
💡 Use Cases:
Quickly validate if a trade setup meets your desired RR profile (e.g., 1:2).
Perfect for scalpers, swing traders, and position traders who rely on structured risk management.
Combine with your entry signal strategy to visualize targets and stops without manual calculations.
⚙️ Inputs:
Stop Loss % – Sets how far your SL is from the entry.
Take Profit % – Sets how far your TP is from the entry.

Metatrader CalculatorThe “ Metatrader Calculator ” indicator calculates the position size, risk, and potential gain of a trade, taking into account the account balance, risk percentage, entry price, stop loss price, and risk/reward ratio. It supports the XAUUSD, XAGUSD, and BTCUSD pairs, automatically calculating the position size (in lots) based on these parameters. The calculation is displayed in a table on the chart, showing the lot size, loss in dollars, and potential gain based on the defined risk.

CME Price LimitCalculates the CME Price Limit
The reference price is obtained from the previous day's closing settlement price
(data pulled from the asset's daily chart with settlement enabled)
Percentage limit can be modified in settings
Buffer can be enabled (for example, 2% buffer on a 7% limit, so a line gets drawn at 5% too)
Alert can be enabled for price crossing a certain percentage from reference on the day
You can choose to plot the historical lines on every day, or the current day only
The reference price output can be found in the data window, or in the indicator status line if enabled in the settings.
Before placing real trades with this, you should compare the indicator's reference price to what's shown on CME's website, to double check that TradingView's data matches for your contract.
www.cmegroup.com
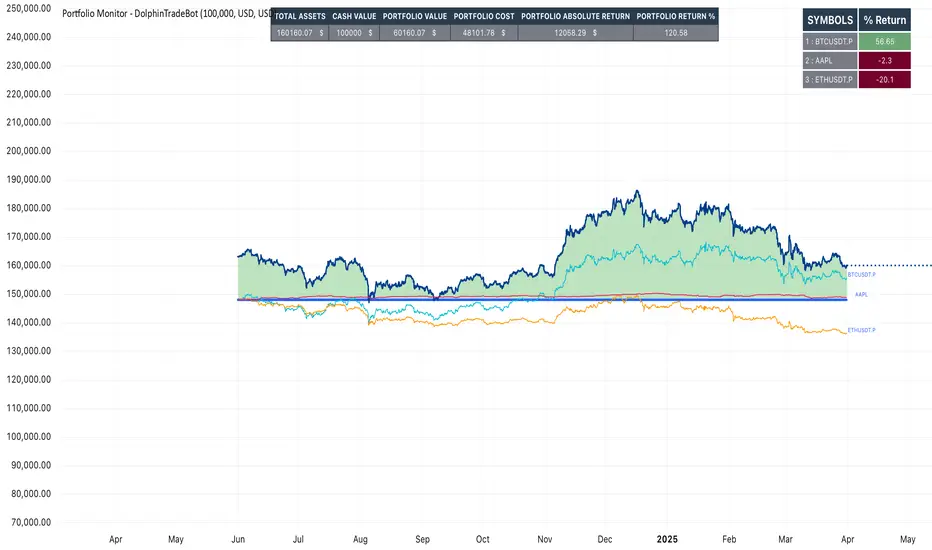
Portfolio Monitor - DolphinTradeBot1️⃣ Overview
▪️This indicator unifies the value of all your investments—whether stocks, currencies, or cryptocurrencies—in your chosen currency. This tool not only provides a clear snapshot of your overall portfolio performance but also highlights the individual growth of each asset with intuitive visualizations and an easy-to-understand performance report.
2️⃣ What sets this indicator apart
▪️is its ability to convert values from various currency pairs into any currency you choose. This means you can monitor your portfolio's performance against any currency pair you prefer, offering a flexible and comprehensive view of your investments.
3️⃣ How Is It Work ?
🔍The indicator can be analyzed under two main categories: visual representations and tables.
1- Visual representations ;
The indicator includes three different types of lines:
1. 1 - Reference Line → This represents the cost of all assets we hold, based on the selected date.
1. 2 - Total Assets Line → Displays the real-time value of all assets in our possession, including cash value, in the selected trading pair.
The area between the reference line is filled with green and red. The section above the reference line is represented in green, while the section below is shown in red.
1. 3 - Performance Lines → These visualize the performance of the assets, starting from the reference line and taking into account their weights in the portfolio. (Note: The lines are scaled for visualization purposes, so their absolute values should not be considered.)
"The names of the lines are shown in the image below."⤵️
2- Tables
The indicator includes three different types of tables:
2. 1 - Analysis Table : It provides a superficial overview of wallet statistics and values.
▪️TOTAL ASSETS → The current equivalent of all assets in the target currency
▪️CASH VALUE → The current value of the amount "Cash Value", in the target currency.
▪️PORTFOLIO VALUE → The total value of assets excluding Cash, in the target currency.
▪️POSTFOLIO COST → The cost of assets excluding Cash, in the target currency.
▪️PORTFOLIO ABSOLUTE RETURN → It shows the profit or loss relative to the cost of assets
▪️PORTFOLIO RETURN % →It shows the profit or loss relative to the cost of assets on a percentage basis
2. 2 - Performance Table : It displays the names of assets excluding Cash and their profit amounts, sorted from highest to lowest profit. If "Show as Percentage" is selected in the settings, it shows the percentage profit or loss relative to the cost. Profits are represented in green, while losses are represented in red.
"You can see the visual showing the tables below"⤵️
4️⃣How to Use ?
1- Choose the date on which the visualization will begin (📌The start date only affects the exchange rate used for calculating the reference line in the target currency.)
2- If you have cash holdings, enter the amount and specify the currency.
3- Select the currency in which your portfolio value will be displayed.(Default value is USD)
4- To set up your portfolio;
SYMBOLS - QUANTITY - PURCHASE PRICE
Enter the symbols of your assets - the number of units you hold - and their cost levels.
5- If you have cash, be sure to include your cash balance. If you also hold other currencies, enter them as separate assets with their corresponding quantities and purchase prices.
6- If you want to see the percentage returns of the assets in the performance table relative to their cost, select the "Show as Percent" option.
7- If you want to see the performance visuals of the assets, click on the "Show Asset Performance" option.
You can find an image of the settings section where the numbers above are used as references below.⤵️
📌 NOTE → By default, a few assets and their values have been pre-added in the initial settings. This is to ensure that you don’t see an empty screen when adding the indicator to the chart. Please remember to enter your own assets and values. The default settings are only provided as an example.
Nasan Risk Score & Postion Size Estimator** THE RISK SCORE AND POSITION SIZE WILL ONLY BE CALCUTAED ON DIALY TIMEFRAME NOT IN OTHER TIMEFRAMES.
The typically accepted generic rule for risk management is not to risk more than 1% - 2 % of the capital in any given trade. It has its own basis however it does not take into account the stocks historic & current performance and does not consider the traders performance metrics (like win rate, profit ratio).
The Nasan Risk Score & Position size calculator takes into account all the listed parameters into account and estimates a Risk %. The position size is calculated using the estimated risk % , current ATR and a dynamically adjusted ATR multiple (ATR multiple is adjusted based on true range's volatility and stocks relative performance).
It follows a series of calculations:
Unadjusted Nasan Risk Score = (Min Risk)^a + b*
Min Risk = ( 5 year weighted avg Annual Stock Return - 5 year weighted avg Annual Bench Return) / 5 year weighted avg Annual Max ATR%
Max Risk = ( 5 year weighted avg Annual Stock Return - 5 year weighted avg Annual Bench Return) / 5 year weighted avg Annual Min ATR%
The min and max return is calculated based on stocks excess return in comparison to the Benchmark return and adjusted for volatility of the stock.
When a stock underperforms the benchmark, the default is, it does not calculate a position size , however if we opt it to calculate it will use 1% for Min Risk% and 2% for Max Risk% but all the other calculations and scaling remain the same.
Rationale:
Stocks outperforming their benchmark with lower volatility (ATR%) score higher.
A stock with high returns but excessive volatility gets penalized.
This ensures volatility-adjusted performance is emphasized rather than absolute returns.
Depending on the risk preference aggressive or conservative
Aggressive Risk Scaling: a = max (m, n) and b = min (m, n)
Conservative Scaling: a = min (m, n) and b = max (m, n)
where n = traders win % /100 and m = 1 - (1/ (1+ profit ratio))
A default of 50% is used for win factor and 1.5 for profit ratio.
Aggressive risk scaling increases exposure when the strategy's strongest factor is favorable.
Conservative risk scaling ensures more stable risk levels by focusing on the weaker factor.
The Unadjusted Nasan risk is score is further refined based on a tolerance factor which is based on the stocks maximum annual drawdown and the trader's maximum draw down tolerance.
Tolerance = /100
The correction factor (Tolerance) adjusts the risk score based on downside risk. Here's how it works conceptually:
The formula calculates how much the stock's actual drawdown exceeds your acceptable limit.
If stocks maximum Annual drawdown is smaller than Trader's maximum acceptable drawdown % , this results in a positive correction factor (indicating the drawdown is within your acceptable range and increases the unadjusted score.
If stocks maximum Annual drawdown exceeds Trader's maximum acceptable drawdown %, the correction factor will decrease (indicating that the downside risk is greater than what you are comfortable with, so it will adjust the risk exposure).
Once the Risk Score (numerically equal to Risk %) The position size is calculated based on the current market conditions.
Nasan Risk Score (Risk%) = Unadjusted Nasan Risk Score * Tolerance.
Position Size = (Capital * Risk% )/ ATR-Multiplier * ATR
The ATR Multiplier is dynamically adjusted based on the stocks recent relative performance and the variability of the true range itself. It would range between 1 - 3.5.
The multiplier widens when conditions are not favorable decreasing the position size and increases position size when conditions are favorable.
This Calculation /Estimate Does not give you a very different result than the arbitrary 1% - 2%. However it does fine tune the % based on sock performance, traders performance and tolerance level.

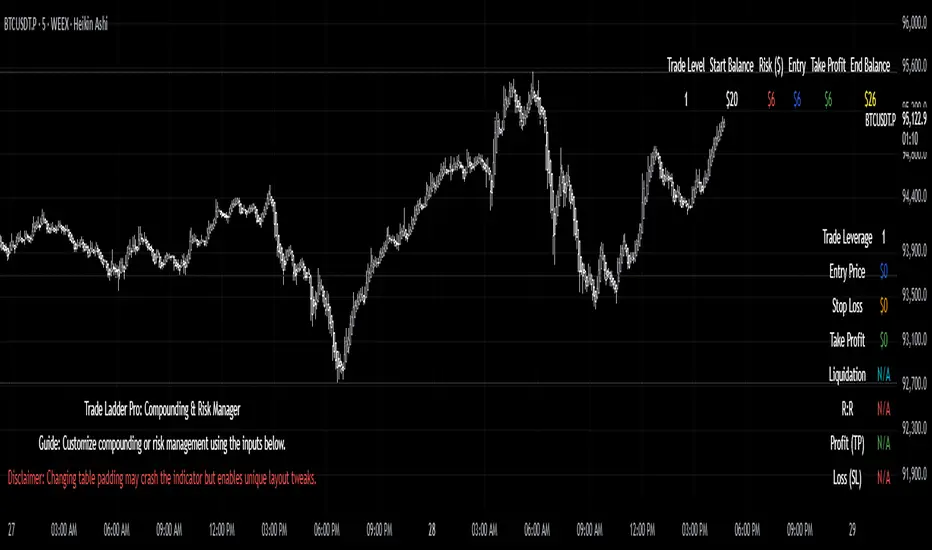
Trade Ladder Pro: Compounding & Risk ManagerTrade Ladder Pro: Compounding & Risk Manager
Inspired by the popular $20 to $52,000 trading challenge, this tool is designed to help you scale your trading account using systematic compounding and enhanced risk management techniques. Whether you’re aiming for disciplined growth or fine-tuning your risk/reward, Trade Ladder Pro offers a flexible approach to visualizing your trade levels.
How to Use:
Inputs:
Compounding Mode:
Set your starting balance, final balance goal, number of trades, and current trade level. You can move to the next trade after a successful trade in settings. The entries are not signals. They are there to help manage risk.
The script calculates the necessary compounding factor to grow your balance across the defined trades.
Risk Management Mode:
In addition to the above, specify a risk percentage and risk/reward ratio.
Input an entry price (or leave it at 0 to use the current price) to automatically compute the stop loss and take profit levels.
Display Options:
Choose the table’s position on the chart (e.g., Top Right, Top Left, Bottom Right, Bottom Left).
Pick between a vertical or horizontal layout for a display that suits your workflow.
Results:
The table will display the trade level, starting balance, risk amount, entry price, take profit, and (if in Risk Management mode) stop loss along with the projected ending balance.
Community & Feedback:
Your feedback is invaluable! Please share any tips or report any errors you encounter so we can continue to improve this tool. Happy trading!
Smart % Levels📈 Smart % Levels – Visualize Significant Percentage Moves
What it does:
This indicator plots horizontal levels based on a percentage change from the previous day's close (or open, if selected). It allows traders to visualize price movements relative to meaningful thresholds like ±1%, ±2%, etc.
What makes it different:
Unlike other level indicators, Smart % Levels only displays the relevant levels based on current price action. This avoids clutter by showing only the levels that are being approached or crossed by the current price. It's a clean and dynamic way to visualize key price zones for intraday analysis.
How it works:
- Select between using the previous day's Close or Open as the reference
- Choose the percentage spacing between levels (e.g., 1%, 0.5%, etc.)
- Enable optional labels to see the exact percentage of each level
- Automatically filters levels to only show those between yesterday's price and today's current price
- Includes customization for colors, line styles, widths, and opacity
Best for:
Day traders and scalpers who want a quick, clean view of how far the current price has moved from yesterday’s reference, without being overwhelmed by unnecessary lines.
Extra notes:
- The levels are recalculated each day at the market open
- All graphics reset at the start of each session to maintain clarity
- This script avoids repainting by only plotting levels relative to available historical data (no lookahead)
This tool is for informational purposes only and should not be considered as financial advice. Always do your own research before making trading decisions.

Cartera SuperTrends v4 PublicDescription
This script creates a screener with a list of ETFs ordered by their average ROC in three different periods representing 4, 6 and 8 months by default. The ETF
BIL
is always included as a reference.
The previous average ROC value shows the calculation using the closing price from last month.
The current average ROC value shows the calculation using the current price.
The previous average column background color represents if the ETF average ROC is positive or negative.
The current average column background color represents if the ETF average ROC is positive or negative.
The current average column letters color represents if the current ETF average ROC is improving or not from the previous month.
Changes from V2 to V3
Added the option to make the calculation monthly, weekly or daily
Changes from V3 to V4
Adding up to 25 symbols
Highlight the number of tickers selected
Highlight the sorted column
Complete refactor of the code using a matrix of arrays
Options
The options available are:
Make the calculation monthly, weekly or daily
Adjust Data for Dividends
Manual calculation instead of using ta.roc function
Sort table
Sort table by the previous average ROC or the current average ROC
Number of tickers selected to highlight
First Period in months, weeks or days
Second Period in months, weeks or days
Third Period in months, weeks or days
Select the assets (max 25)
Usage
Just add the indicator to your favorite indicators and then add it to your chart.

Trading Capital Management for Option SellingTrading Capital Management for Option Selling
This Pine Script indicator helps manage trading capital allocation for option selling strategies based on price percentile ranking. It provides dynamic allocation recommendations for index options (NIFTY and BANKNIFTY) and individual stock positions.
Key Features:
- Dynamic buying power (BP) allocation based on close price percentile
- Flexible index allocation between NIFTY and BANKNIFTY
- Automated calculation of recommended number of stock positions
- Risk management through position size limits
- Real-time INDIA VIX monitoring
Main Parameters:
1. Window Length: Period for percentile calculation (default: 252 days)
2. Thresholds: Low (30%) and High (70%) percentile thresholds
3. Capital Settings:
- Trading Capital: Total capital available
- Max BP% per Stock: Maximum allocation per stock position
4. Buying Power Range:
- Low Percentile BP%: Base BP usage at low percentile
- High Percentile BP%: Maximum BP usage at high percentile
5. Index Allocation:
- NIFTY/BANKNIFTY split ratio
- Minimum and maximum allocation thresholds
Display:
The indicator shows two tables:
1. Common Metrics:
- Total BP Usage with percentage
- Current INDIA VIX value
- Current Close Price Percentile
2. Capital Allocation:
- Index-wise BP allocation (NIFTY and BANKNIFTY)
- Stock allocation pool
- Recommended number of stock positions with BP per stock
Usage:
This indicator helps traders:
1. Scale positions based on market conditions using price percentile
2. Maintain balanced exposure between indices and stocks
3. Optimize capital utilization while managing risk
4. Adjust position sizing dynamically with market volatility
