Swing Trade Pros - Auto Trend LinesThe STP Auto Trend Lines accurately identify the real-time trend lines automatically helping you find breakouts before they happen. The indicator uses weighted moving averages to show the overall direction of the underlining asset. The higher time frames will always produce the most reliable trend lines. Once the second swing high or low has been identified the indicator automatically draws the trend lines. The Trend Lines form key market structures and once the pattern is broken a big move usually follows. If the trend is rising it indicates it may be better to enter long positions. If the trend is falling it indicates it may be better to enter short positions.
Tendance de volume de prix (PVT)
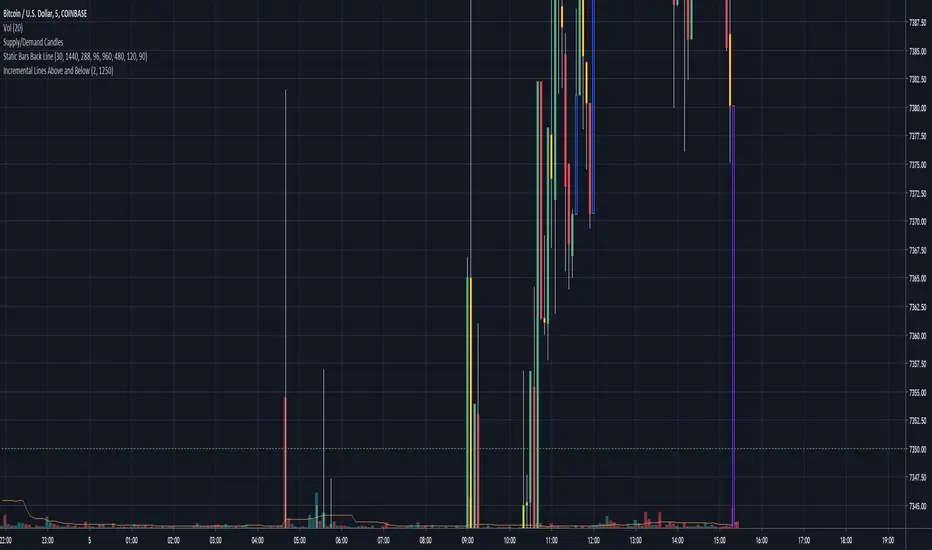
Incremental Lines Above and BelowPut lines above and below current price by a specified value. The step value refers to the mintick value of the symbol. (e.g. BTCUSD has a mintick value of 0.01 so if you wanted an increment of $12.50 you would use 1250 for the number of steps between value)
Engulfing Detector (Supply and Demand)Bullish and bearish engulfing candles marked with horizontal lines around engulfed candle. Currently looks a max of 2000 bars back.
This indicator can be used to assist in locating potential supply and demand zones.
The fresh zones will be of green and red line colors and the tested zone lines are grey in color.

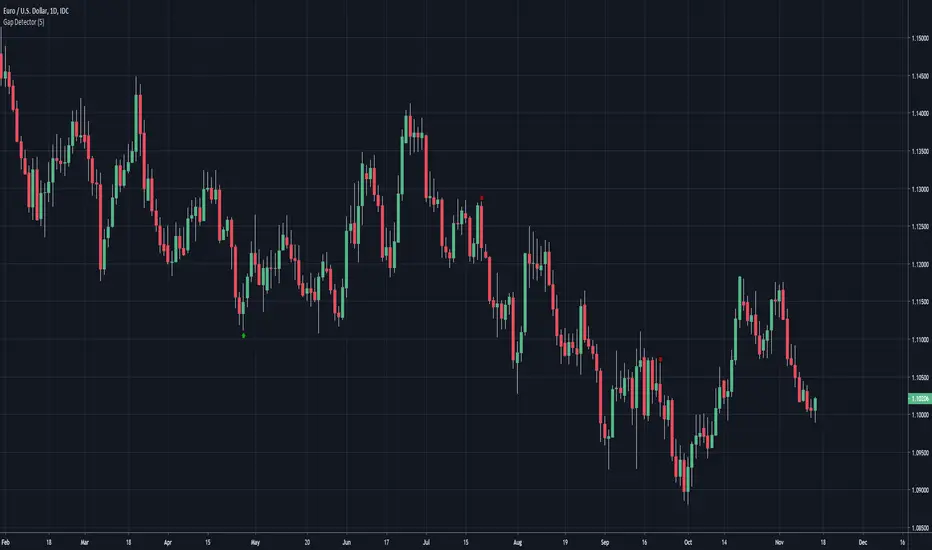
Gap DetectorArrow at candle where bullish or bearish gap occurred by a configurable minimum pip distance


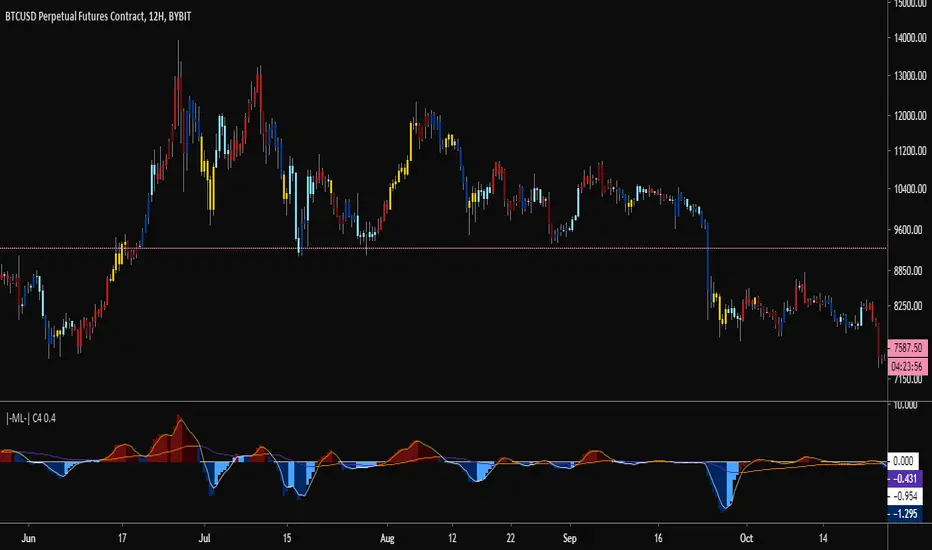
|-ML-| C4 - Amplified Volume Directional Bias OscillatorThis indicator presents an oscillator that suggests volume directional bias.
Colour switch (blue to ice-blue and red to maroon) confirms oscillator turnaround.
Confirmed divergences flag a trend change that can be used as a trade entry aid.
I suggest changing your candlesticks as follows:
Border: black
Wicks: grey
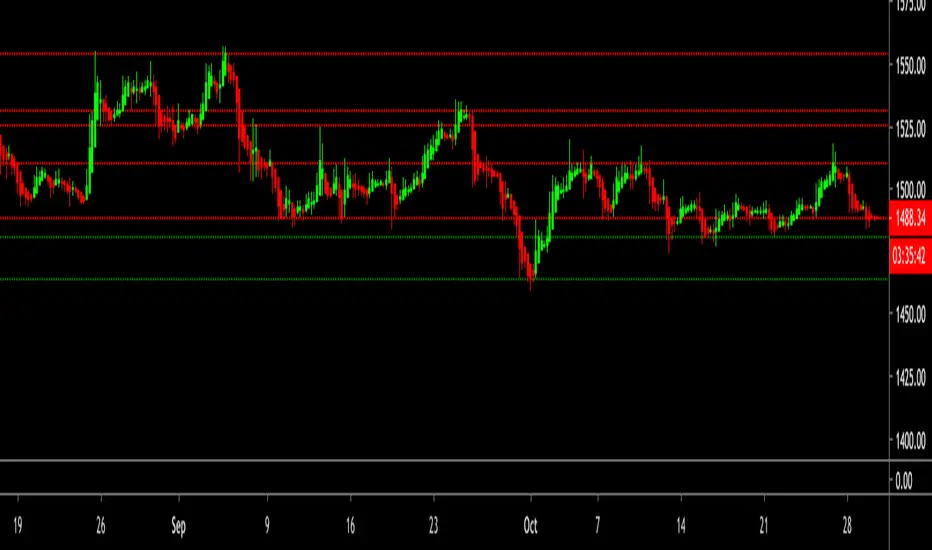
Swing Trade Pros - Support/Resistance LevelsThe STP Support/Resistance Levels accurately detect the key levels by identifying large swings/pivots in historical price action automatically. It identifies price levels where historically the price reacted by either bouncing or reversing the direction. Prior price behavior at these levels can leave clues for future price behavior. These tops and bottoms in price action show where lots of buyers or sellers came into the market and might act as future levels of support or resistance. By default, the code detects the last 3 significant swing highs and the last 3 swing lows. When price action breaks above the resistance line the color changes to green because it's now support. Likewise, when the price action breaks below the support line the color changes to red because it's now resistance.
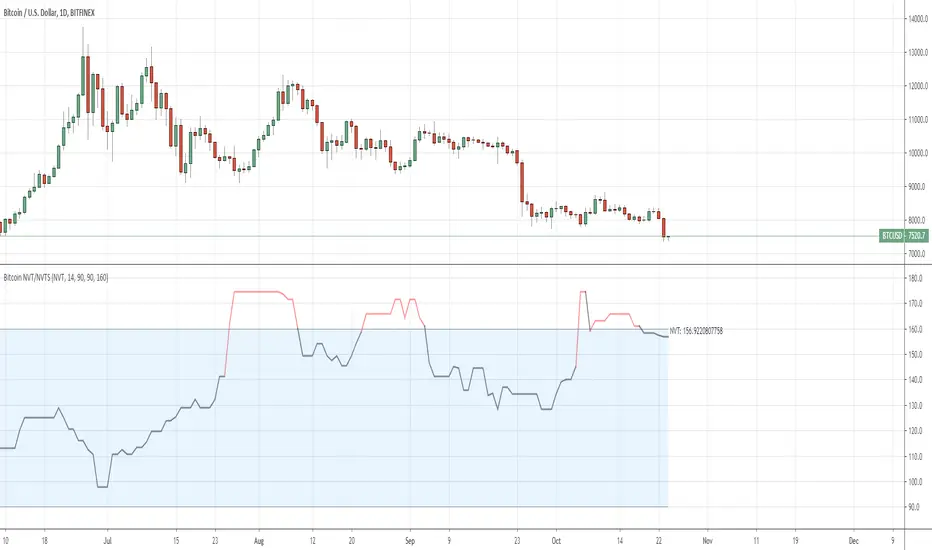
QuantNomad - Bitcoin NVT/NVTSIn this script I included 2 quite interesting indicators for Bitcoin:
* NVT (Network Value to Transactions Ratio)
* NVTS (NVT Signal)
Both indicators are based on Bitcoin Network Value (Market Cap) and 24h transaction volume.
For both these values I'm using Quandl datasets from Blockchainc.com:
market_cap: QUANDL:BCHAIN/MKTCP
transac_vol: QUANDL:BCHAIN/ETRVU
Calculation for both indicators are pretty simple:
NVT = median(market_cap / transac_vol, 14 bars)
NVTS = market_cap / sma(transac_vol, 90 bars)
NVT and NVTS are cryptocurrency's answers to P/E ratio. They can help you to understand if bitcoin is under/overvalued.
When NVT or NVTS is relatively high it can be a pretty good point to short bitcoin, if it's low it good time to buy bitcoin.
NVT Ratio - was created by Willy Woo
NVT Signal - was created by Dimitry Kalichkin
Because of different sources of transaction volume data, these indicators can differ in values from originals, but magnitude should be the same.
This is a pretty simple example where you can select only static overbought/oversold levels and when indicator will be above/below it you will see in changing in color.
I have many more things in my head how these indicators can be developed further and what strategies can be derived from them, but as is they can be a pretty good base for you. Will share my advanced findings later.
Volume with directionOscillator plots cumulative volume with direction defined by price (positive price change = positive volume and vice versa) divided by volume sma.
It is good for divergence indication and can be used for trend change prediction.
It is faster then stoch with the same length.


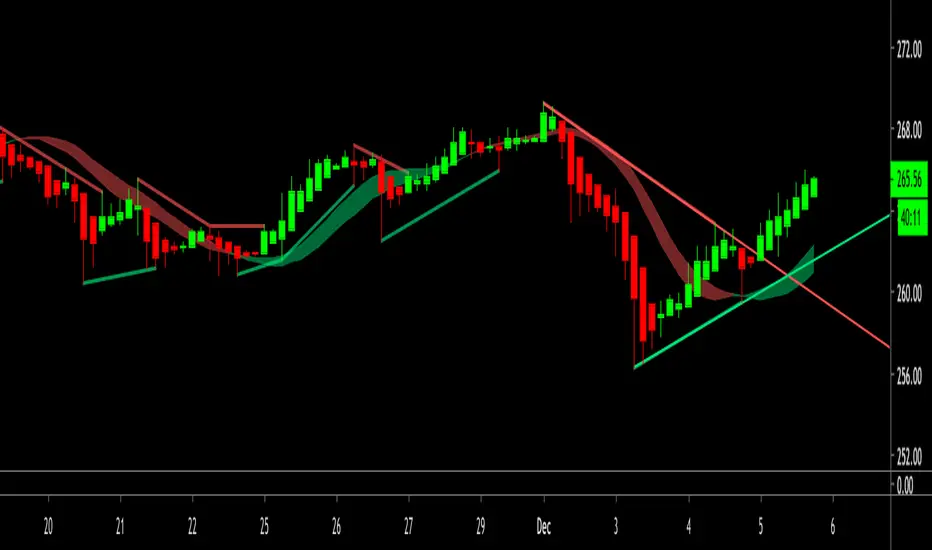
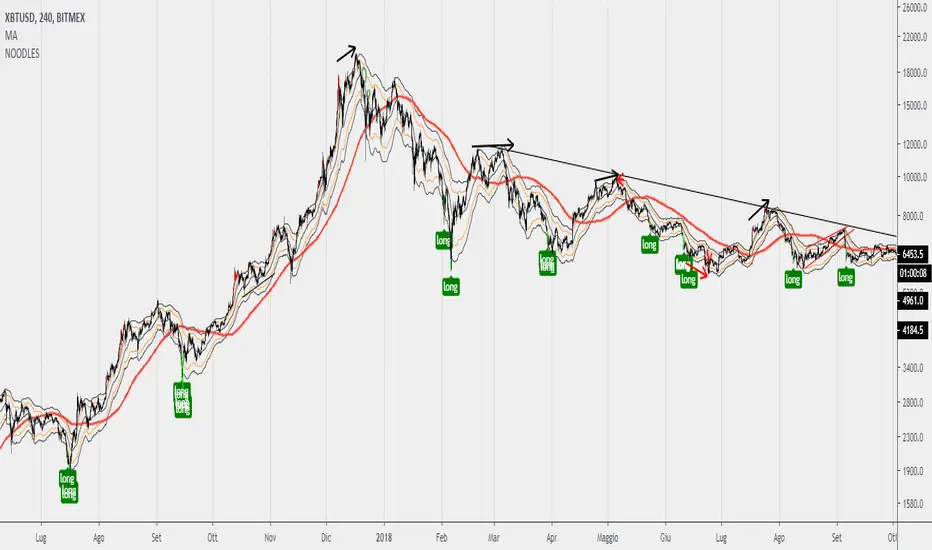
Noodles ema bands + BUY/SELL signal CandleEma bands as support and resistance based on 12/26.
+Buy and Sell signal candle (green and red)
This script work better on 1 hour timeframe. for altcoin change setup from source: ''LOW'' to ''OPEN''
TEDong Price Velocity MotionHi Folg,
TEDong Price Velocity Motion indikator for XBT is based on Physics Newton Law.
It gives a Buy signal when the Line value crosses up its EMA and a Sell signal when it crosses down its EMA .
Cross over markers Directional bgcolor, where RED for bearish (S) and GREEN for bullish (B)
If you include volume analyses in your trading strategy, automating EDong Price Velocity Motion will give buy signals whenever volume and price are rising altogether.
HINT:
Bullish when line/BG is green, bearish when line/BG is red. BUY on first green candle, SELLl on first red candle.
DONATE/TIP
BTC: 13nhMN2H4LoRi4VMcPcyR96jitxrH3uivB

💸 Divergence Finder v1.0 by Cryptothythms💸 Divergence Finder v1.0 by Cryptothythms
Intro
This indicator is meant as a quantitative look at divergences. Special thanks to RicardoSantos (legend!) for his divergence detection script which was used as a basis to construct this.
Usage
Lime Green = Regular Bullish Divergence
Dark Green = Hidden Bullish Divergence
Red = Regular Bearish Divergence
Maroon = Hidden Bearish Divergence
Remember... divergences do not have a high probability success overall. So to mitigate that this is an attempt to source many "opinions" on the state of divergence from many different classes of indicators.
Leading indicators - Lead price action, but have a higher probability of false signals
Real time indicators - Track price action, momentum, etc in a tick by tick state. Generally a 1-3 bars lag can be present.
Lagging indicators - Lag price action a little, but offer more in terms of confirmation of the divergence
Volume indicators - Look at volume flow in different fashions and give an added dimension to divergence finding. Remember volume divergences interact with price independently. For instance volume can be going down, but price going up. Be sure to understand the relationship of volume and price action when considering these readings.
👍 Enjoying this indicator or find it useful? Please give me a like and follow! I post crypto analysis, price action strategies and free indicators regularly.
💬 Questions? Comments? Want to get access to an entire suite of proven trading indicators? Come visit us on telegram and chat, or just soak up some knowledge. We make timely posts about the market, news, and strategy everyday. Our community isn't open only to subscribers - everyone is welcome to join.
For Trialers & Chat: t.me/cryptorhythms

The Rocket : Profit Factor [Bradford_Fournier]The Rocket
I hope this helps you as much as it has me.
Suggestions:
Use with tech stocks with reasonably high volatility
Time-frames are flexible but a 1-3month window is best.
REQUEST: If you find this useful, please let me know. I'd like to improve this script further. Any suggestions or encouragement are greatly appreciated
The rocket is based on my Trend Shift Indicator. Please take a look if you haven't yet.

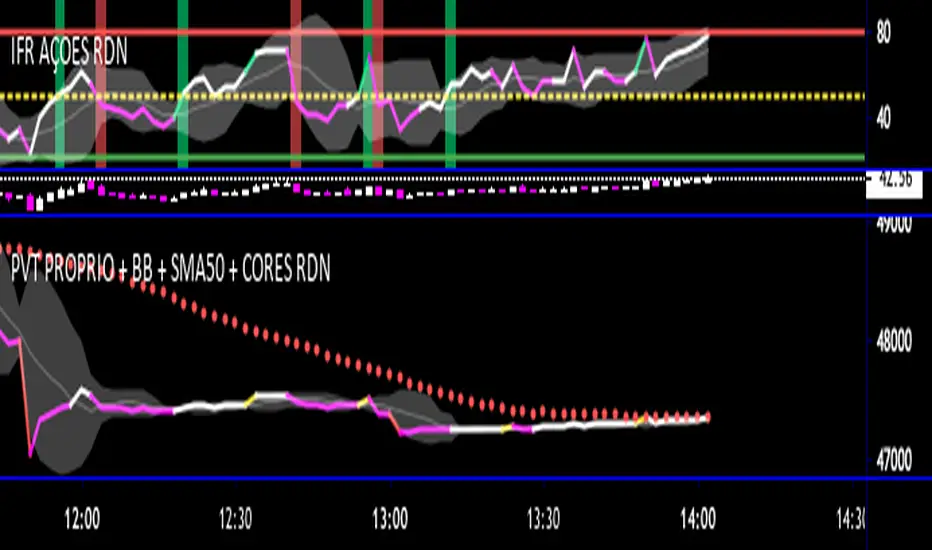
PVT + BB + Período Personalizado com cores RDNEste Script é personalizado. É um PVT com bandas de Bollinger que muda de cores os candles no gráfico e também a linha do PVT
Sugestões e maiores informações de uso adicione @rafdourado
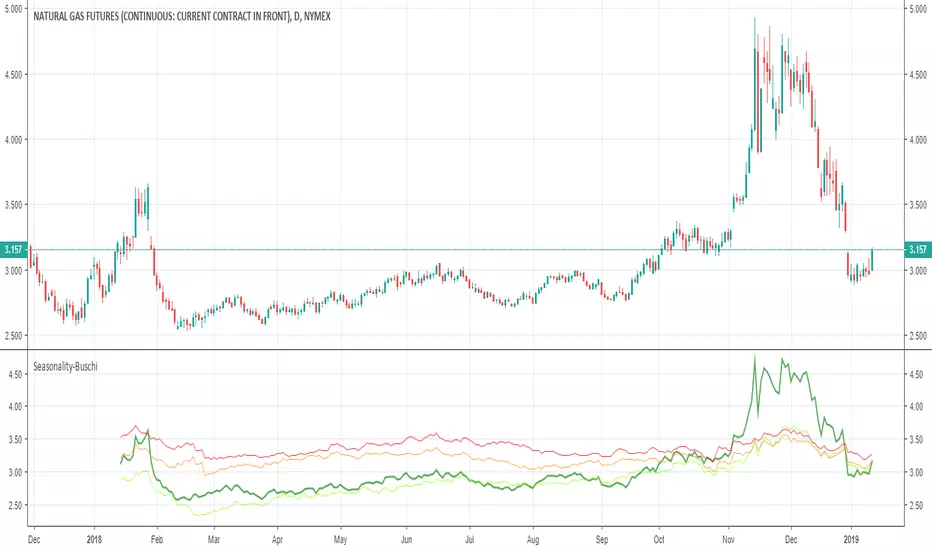
Seasonality-Buschi
English:
This script shows the price development over the last year (default: green) and mean prices over the last three (default: light green), six (default: orange) and nine (default: red) years and is therefore at least some kind of approach towards true seasonality.
Thanks to user "apozdnyakov" for providing most of the code!
Deutsch:
Dieses Skript zeigt den Kursverlauf über das letzte Jahr (Standard: grün) und die durchschnittlichen Verläufe über die letzten drei (Standard: hellgrün), sechs (Standard: orange) und neun (Standard: rot) Jahre und stellt damit zumindest eine Annäherung zu einer echten Saisonalität dar.
Dank an User "apozdnyakov", der den Großteil des Codes zur Verfügung gestellt hat!
Trader Set - Volume CandleThis is a candlestick system but not on price. These candles are drawn based on the volume movement. This is one of those professional charting systems that big industries use every day. Remember, the key to find what smart money is doing, is always VOLUME. Any new way that you can track new aspects of volume will help determining what the market will do, BEFORE it starts doing it !
There are total of Seven moving averages that you can ...:
1- Set their period separately
2- Set their type separately
3- Turn on/off separately
The averaging types that are supported, remember you have options PER moving average :
- SMA
- EMA
- RMA
- WMA
- HMA
- KAMA
- MAMA
- FAMA
This script IS FOR SALE , you can buy it with crypto currencies, or webmoney or perfect money. THE PRICE is 55$. for life time license.
You can find all the crypto wallet addresses plus webmoney and perfect money accounts in the link below. Please send the correct amount PLUS the transaction fee. After the transaction is confirmed, contact me with the info of the transaction for granting access.
AَِDDRESSES FOR WALLETS : justpaste.it

Cumulative Force IndexVolume indicator adapted from Elder's Force Index.
From here:
stageanalysis.net


[IE] RSI - BEAR/BULL - DivergencesDetect divergences in price and RSI.
Also mark overbought and oversold RSI.
Useful for scalps.
Contact in private for access
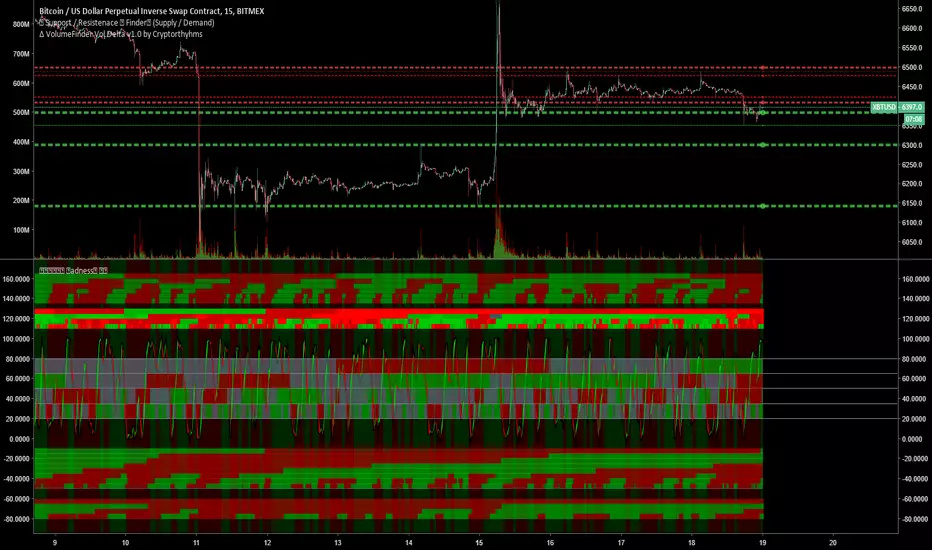
🕟𝕄🕗𝕋🕛𝔽 Madness MTF Grid by 🇨🇷🇾🇵🇹🇴🇷🇹🇭🇾🇭🇲🇸Here is a short description. This indicator being free will not have documentation for ALL things. Just the basics. There are 5 indicators included in it which I will not go into how each one works. There is ALOT of info on all the indicators included in here, just use google for that.
📊For each "row" of colored bands this represents one indicator. This is meant to be used on the 15m (or less) timeframe, and it looks up into higher TF's. It is meant to be maximized, so have this open in one tab and the chart on another. Dual Monitors are best. All options and Time frames are fully configurable inputs.
📈Indicators from top to bottom are:
1.)Polarity Filtration - 6 Timeframes
2.) Price Volume Trend - 4 Timeframes
3.) Stochastic RSI - 4 Timeframe Grid, and Current Timeframe in lines/ribbons
4.) MACD Crossovers - 8 Timeframes
5.)SuperTrend - 4 Timeframes
⏲Inside each larger "band" there are smaller rows. Each of these small rows represents one timeframe (30m, 60, 2h, 4h, etc) What timeframes you choose for them is completely configurable althought the current setup is already ideal to trade on 15m
⏲For these smaller rows the ones on top are highest timeframe(i.e. 4h) and the bottom small rows are lowest timeframe
⏲So each small row is like being able to check that indicator many timeframes at once. This will help you determine overall trends without switching to different timeframes on your chart all the time
📈The last piece of the puzzle is the background color. This background color is whether the chart is going up or down on the 1 hour heiken Ashi candle chart. Heiken ashi always shows up or down based on how they draw the candles, so its another useful trend indicator
👍If you enjoy MTF Madness all I ask in return is that you like the indicator and follow me on tradingview (profile here: www.tradingview.com)
❓If you have any questions, join us in the telegram chat in my signature!